
Differentiation device, differentiation method for depression symptoms, determination method for level of depression symptoms, stratification method for depression patients, determination method for effects of treatment of depression symptoms, and brain activity training device

a brain activity training and differentiation method technology, applied in the field of differentiation devices, can solve the problems of not sufficiently considering a more detailed functional connectivity, difficult general development of such a biomarker, etc., and achieve the effect of discriminating the level of depressive symptoms

Pending Publication Date: 2021-02-04
ATR ADVANCED TELECOMM RES INST INT +1
View PDF5 Cites 12 Cited by
  • Summary
  • Abstract
  • Description
  • Claims
  • Application Information

AI Technical Summary

Benefits of technology

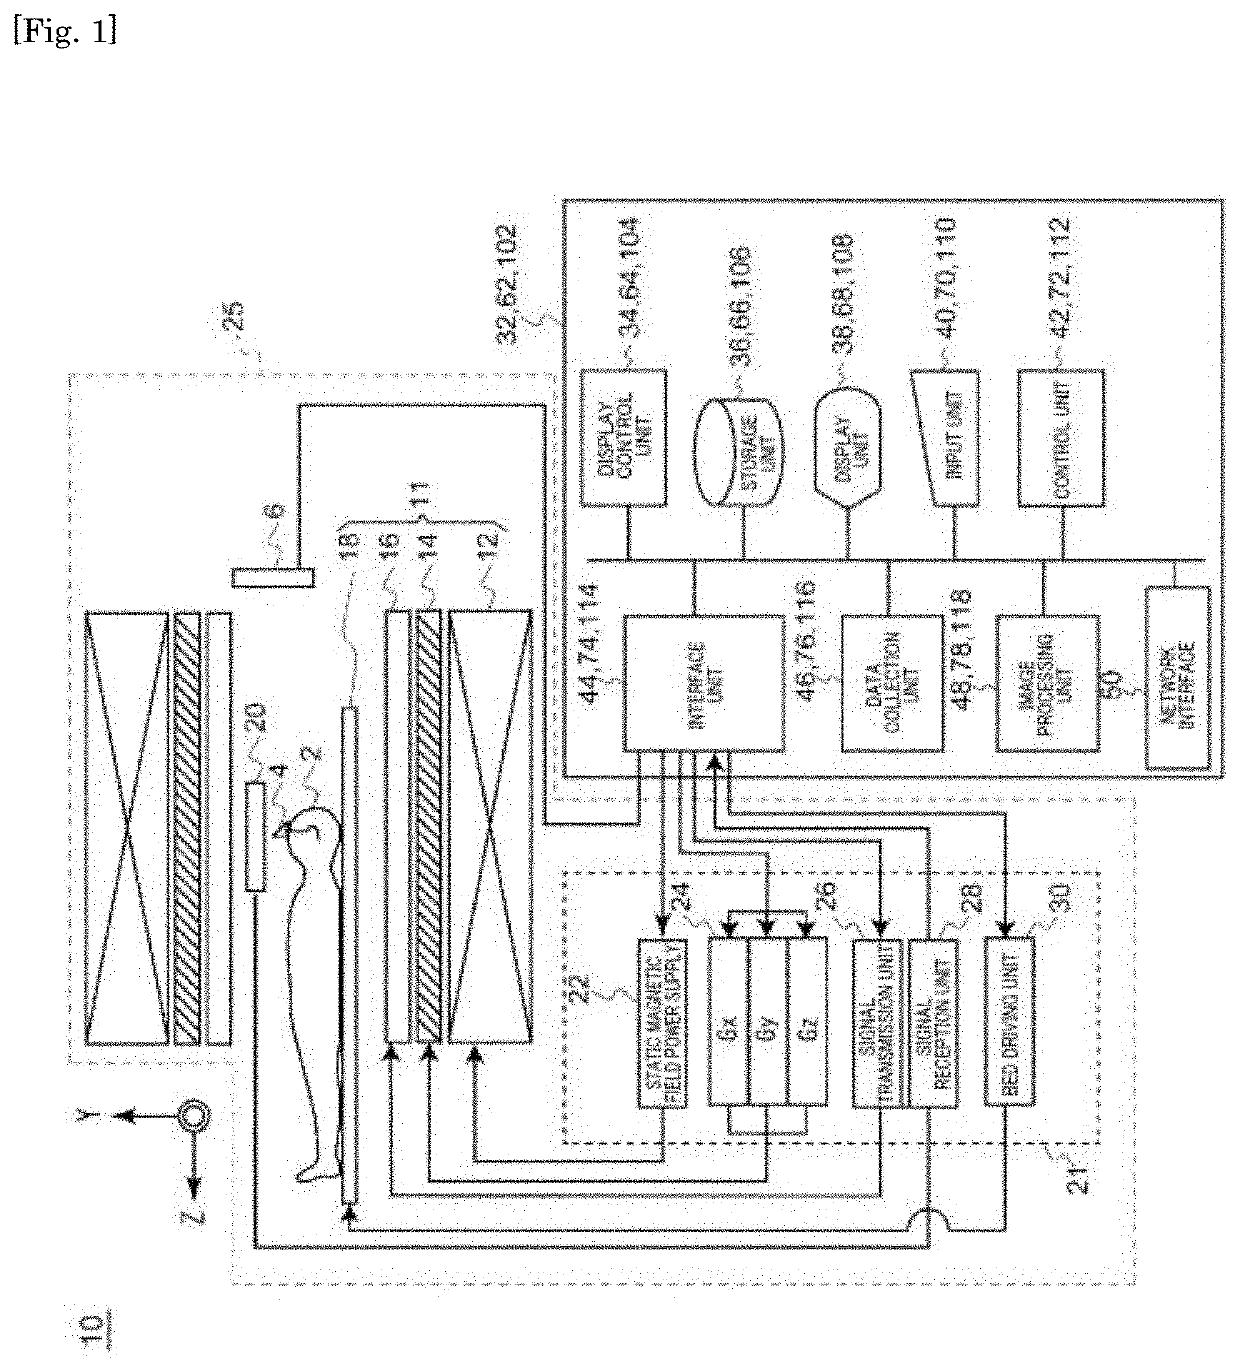
The present invention provides a device and method for objectively identifying indicators of depressive symptoms in a person's brain. It can also determine the effectiveness of therapy for treating those symptoms. The invention provides a tool for accurately identifying a person's level of depressive symptoms and also classify them as being either normal, mild, or severe. The invention also allows for neurofeedback training to help improve depleted brain function.

Problems solved by technology

However, development of such a biomarker is not easy in general.
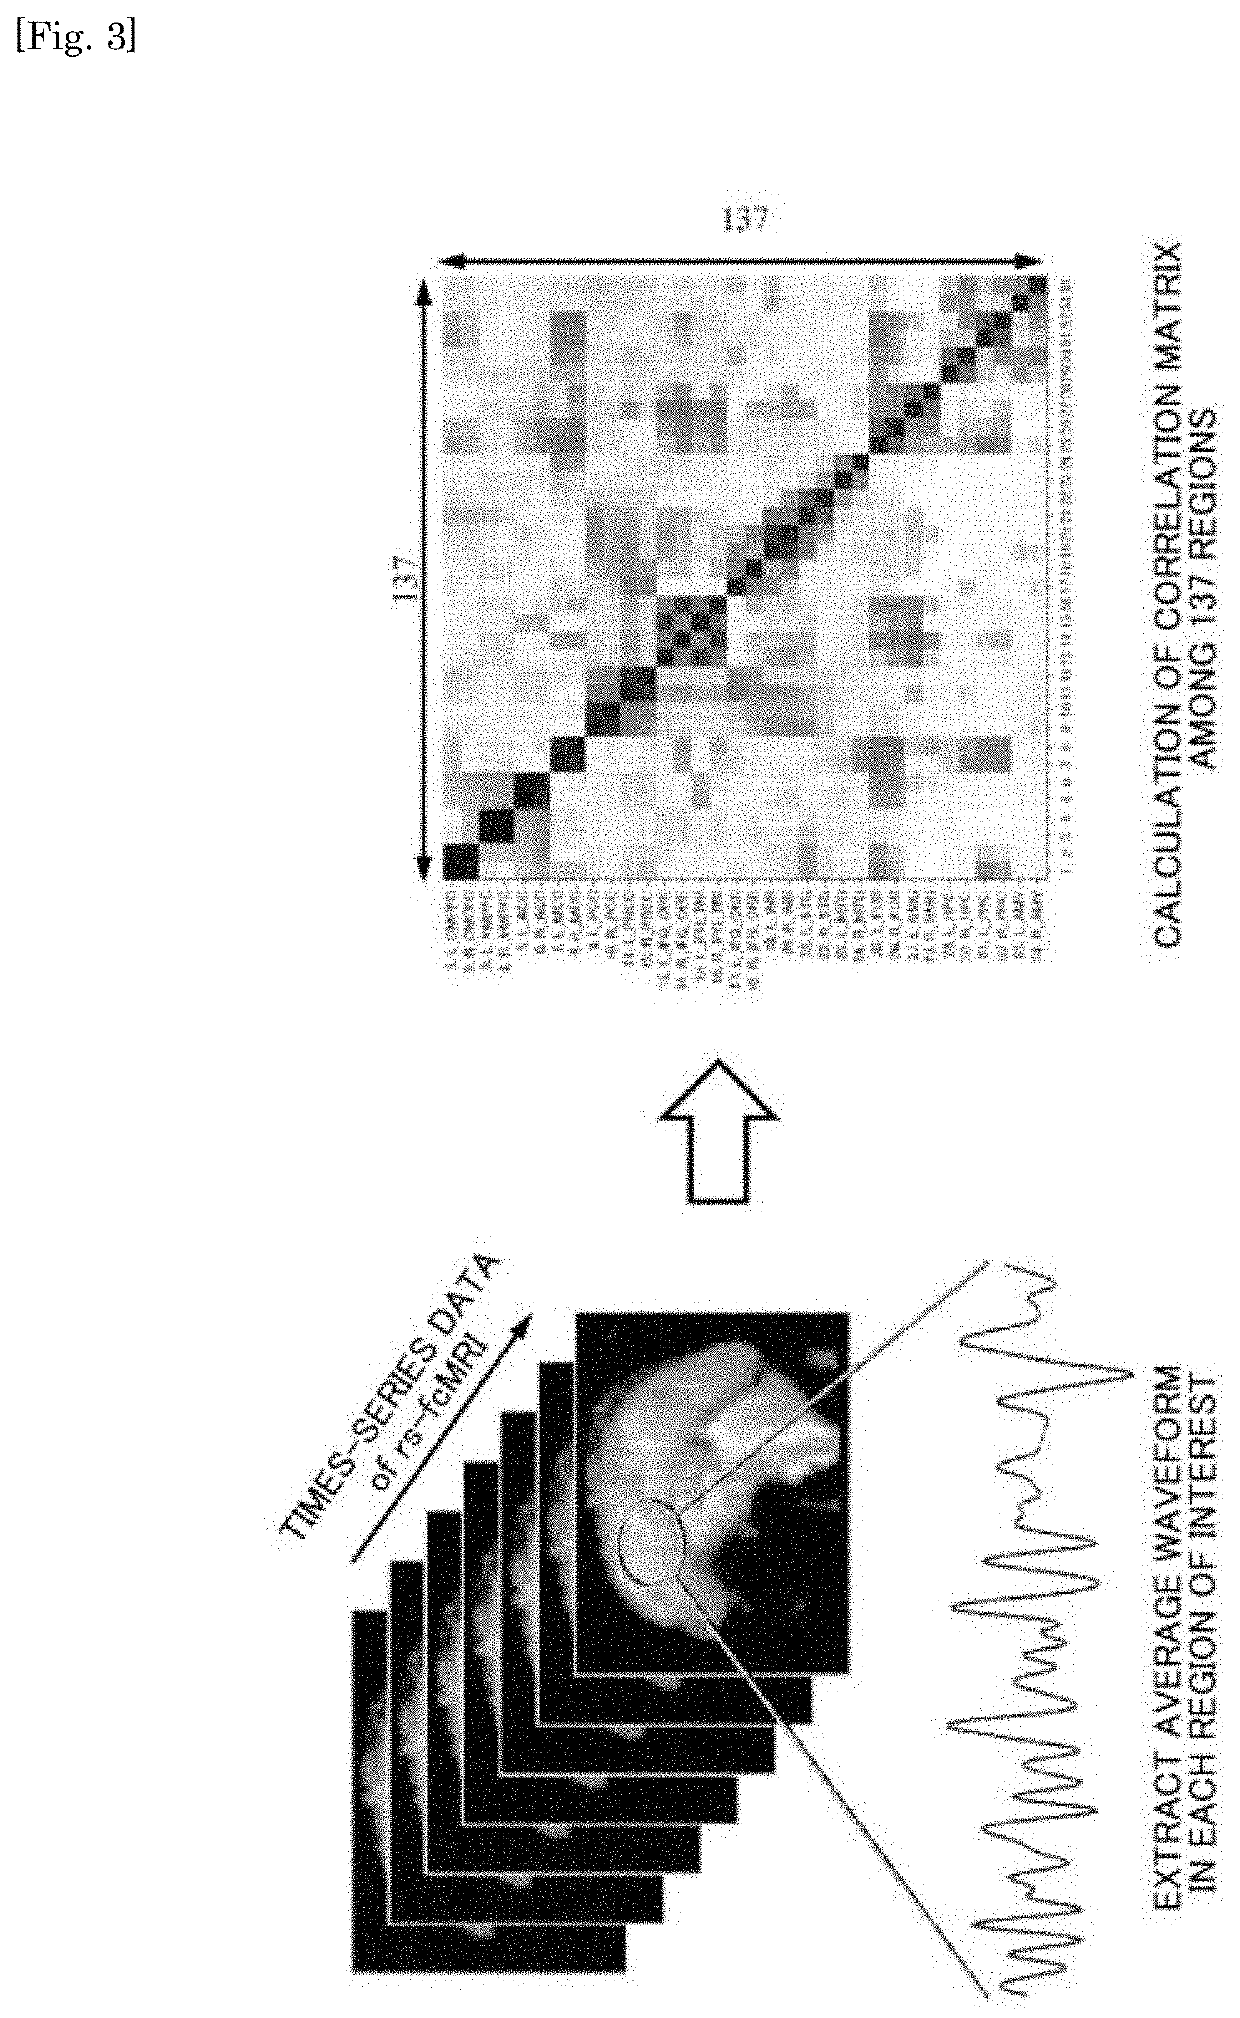
However, the related-art rs-fc MRI method examines the activity of a global neural network, for example, the above-mentioned default mode network, and currently does not sufficiently consider a more detailed functional connectivity.

Method used


Image

  • Differentiation device, differentiation method for depression symptoms, determination method for level of depression symptoms, stratification method for depression patients, determination method for effects of treatment of depression symptoms, and brain activity training device
  • Differentiation device, differentiation method for depression symptoms, determination method for level of depression symptoms, stratification method for depression patients, determination method for effects of treatment of depression symptoms, and brain activity training device
  • Differentiation device, differentiation method for depression symptoms, determination method for level of depression symptoms, stratification method for depression patients, determination method for effects of treatment of depression symptoms, and brain activity training device

Examples


example 1

II. Selection of 12 Pairs of Functional Connectivities for Classification of Melancholic MDD

[0559]In order to select 12 pairs of functional connectivities for classification of the melancholic MDD, rs-fMRI data of 66 melancholic MDD patients and 66 healthy individuals shown in Table 1a was used. The functional connectivity for classifying the melancholic MDD group was selected based on the procedure described in the embodiment in accordance with the method of creating the classifier for classifying autism (ASD) reported by the above-mentioned literature by Yahata et al.

[0560]This system uses the sparse canonical correlation analysis (L1-SCCA) subjected to L1 regularization and the sparse logistic regression (SLR). The SLR is not useful for classifying MDD, but has a capability of training the logistic regression model while at the same time trimming each functional connectivity in an objective manner. A certain amount of input was reduced by L1-SCCA before training by the SLR, and ...

example 2

III. Application of Classifier in the Present Invention to Non-Melancholic MDD Group and Whole MDD Group

[0573]FIG. 27c shows data obtained by creating the classifier in the present invention with each of the whole MDD group, the melancholic MDD group, and the non-melancholic MDD group serving as training data (vertical direction), and considering accuracy with each group serving as test data (horizontal direction). As a result of the LOOCV, for example, the classifier generated by the melancholic MDD group has the accuracy of 54% (sensitivity: 42%, specificity: 67%, and AUC: 0.65) for the non-melancholic MDD. The accuracy of the LOOCV for the whole MDD group is 66% (sensitivity: 58%, specificity: 74%, and AUC: 0.74).

[0574]The results indicate the fact that the classifier having the whole MDD group as training data has a lower classification accuracy compared to the classifier having the melancholic MDD group as training data or the classifier having the melancholic MDD group as tra...

example 5

12 Pairs of Functional Connectivities Through Treatment

[0579]Next, contribution to ΔWLS was considered for each functional connectivity in order to consider an influence of SSRI (escitalopram) on each of the 12 pairs of functional connectivities.

[0580]Specifically, in preliminary and subsequent analysis of administration, the following numerical expression was used to calculate a contribution score of each functional connectivity.

[Math.13]ci=wi(∑j=1NFCi,jpostN-∑j=1NFCi,jpreN)

[0581](In the expression given above, N represents the number of patients who have received the treatment, and wi represents the weight of the classifier.)

[0582]Further, in order to obtain a reference score, a similar contribution score between the MDD and the healthy control group was also calculated by the following numerical expression, to thereby calculate the contribution score.

[Math.14]si=wi(∑j=1NFCi,jHCN-∑k=1MFCi,kMDDM)

[0583](In the expression given above, M represents the number of MDDs, and N represents...


PUM


Abstract

Objective discrimination of a disease label of a depressive symptom with respect to an active state of a brain is achieved. One means for solving the problems of the present invention is to provide a discriminating device for assisting in determination of whether a subject has a depressive symptom. The discriminating device includes a storage device for storing information for identifying a classifier generated by classifier generation processing based on a signal obtained by using a brain activity detecting apparatus to measure, in advance and time-sequentially, a signal indicating a brain activity of a plurality of predetermined regions of each brain of a plurality of participants in a resting state, the plurality of participants including healthy individuals and patients with depression. The classifier is generated so as to discriminate a disease label of a depressive symptom based on a weighted sum of a plurality of functional connectivities selected by feature selection as being relevant to the disease label of the depressive symptom through machine learning from among functional connectivities of the plurality of predetermined regions. The discriminating device further includes a processor configured to execute discriminating processing of generating a classification result for the depressive symptom of the subject by using the classifier.

Description

TECHNICAL FIELD[0001]The present invention relates to a discriminating device, a discriminating method for a depressive symptom, a discriminating method for a level of the depressive symptom, a classification method for a patient with depression, a discriminating method for a therapeutic effect on the depressive symptom, and a brain activity training device.BACKGROUND ART[0002](Biomarker)[0003]An indicator that quantifies biological information to quantitatively grasp biological changes inside a living body is called a “biomarker”.[0004]The United States Food and Drug Administration (FDA) defines the biomarker as a “characteristic that is measured as an indicator of normal biological processes, pathogenic processes, or responses to an exposure or intervention, including therapeutic interventions.” Further, a biomarker that characterizes a state or change of a disease or a degree of recovery is used as a surrogate marker (alternative marker) for verifying effectiveness of a new drug ...

Claims


Application Information

Patent Timeline
Patent Type & Authority Applications(United States)
IPC IPC(8): G06K9/62G06T7/00G16H20/70G16H70/60G16H30/20G16H50/30G16H50/70G06N20/00
CPCG06K9/628G06T7/0014G06K9/6256G16H20/70A61B5/055G16H30/20G16H50/30G16H50/70G06N20/00G16H70/60G06T7/0012G06T2207/10088G06T2207/20081G06T2207/20084G06T2207/30016G06F18/2431G06F18/214
Inventor LISI, GIUSEPPEMORIMOTO, JUNKAWATO, MITSUOYAMADA, TAKASHIICHIKAWA, NAHOOKAMOTO, YASUMASA
Owner ATR ADVANCED TELECOMM RES INST INT
Learn More