Method and apparatus for profiling of non-instrumented programs and dynamic processing of profile data

a non-instrumental program and profile data technology, applied in the field of runtime profiles, can solve the problems of code size explosion, slow execution of code, complex and time-consuming instrumentation-based methods for gathering profile data,

Inactive Publication Date: 2001-05-15
HEWLETT PACKARD CO
View PDF5 Cites 149 Cited by
  • Summary
  • Abstract
  • Description
  • Claims
  • Application Information

AI Technical Summary

Problems solved by technology

Instrumentation based methods for gathering profile data tend to be complex and time consuming.
Instrumentation of the code can result in a code size explosion due to the added instructions.
The additional probe instructions also slow execution of the code and a profiled, or instrumented, version of a program can run as much as thirty times slower than the original version.
Execution slow down is more than an inconvenience.
Validating the profile is difficult without a large scale study of user habits.
In the absence of a user study, profiling is typically done using a large set of inputs which increases the time required to produce accurate profiling data.
Smaller test input suites, however, reduce the accuracy of the resultant profile data.
Therefore, there is a trade-off between the accuracy of profiling and the time required to perform profiling.
There remain, however, some programs for which it is difficult or impossible to come up with representative test input data.
Real time applications, such as operating system (OS) kernels and embedded systems, are excluded from the benefits of profile driven optimizations because of their execution nature.
Furthermore, analyzing and using the profile data requires additional processing steps.
However, for large systems, such as commercial database applications, this requires significant alteration of build scripts.
A large number of man-hours are invested in these scripts.
In addition, large systems will require a significant amount of processing time for analysis and recompilation.
As a result, software vendors are hesitant to adopt profile driven optimizations.
Therefore, there is a trade-off between overhead and accuracy when selecting the sampling frequency.
Further, the statistical PC sampling approach described above typically results in too fine a level of granularity.
It also doesn't really track the control flow well and requires a high level of analysis in order to use it in the process of optimizing the code.
This is difficult to do when the profile data is associated with a bunch of program count values that are taken at arbitrary intervals.
This has the disadvantage that some of the dynamic addressing information may be lost, such as the runtime control flow of the program within a dynamically linked library.
In addition, the requirement of post-runtime analysis prevents statistical PC sampling from being used for on-the-fly optimization.
However, these static estimates are typically not as accurate as profiling.
Furthermore, control flow within dynamically bound procedures is difficult to estimate statically.
Only direct branches are handled by modern branch prediction hardware, indirect branches cannot be predicted.
Zeroing out the branch history each time it is sampled by the operating system does not solve the problem, because "0" entries in the history also signify not-taken branches.
The disadvantage of Conte et al's scheme is that the branch history information maintained by the branch prediction hardware is shared by all programs running on the processor, and is not part of the state of the profiled program.
However, this branch history information cannot be used to reconstruct the actual sequence of branch instructions executed by the program at runtime.
The high level of analysis required to process the WCFG makes it too expensive to apply at runtime while the program is executing.
Another disadvantage of Conte et al's profiling technique is that the program has to be essentially "instrumented" by enhancing it with the CFG structure.
In addition, indirect branches (i.e., branches whose targets may be different for different executions of the branch) cannot be handled, requiring the compiler to convert indirect branches into a sequence of conditional direct branches in order to profile them.
Both these problems make this scheme unusable on legacy program binaries (i.e., programs that cannot be recompiled).

Method used


Image

  • Method and apparatus for profiling of non-instrumented programs and dynamic processing of profile data
  • Method and apparatus for profiling of non-instrumented programs and dynamic processing of profile data
  • Method and apparatus for profiling of non-instrumented programs and dynamic processing of profile data

Examples


Embodiment Construction

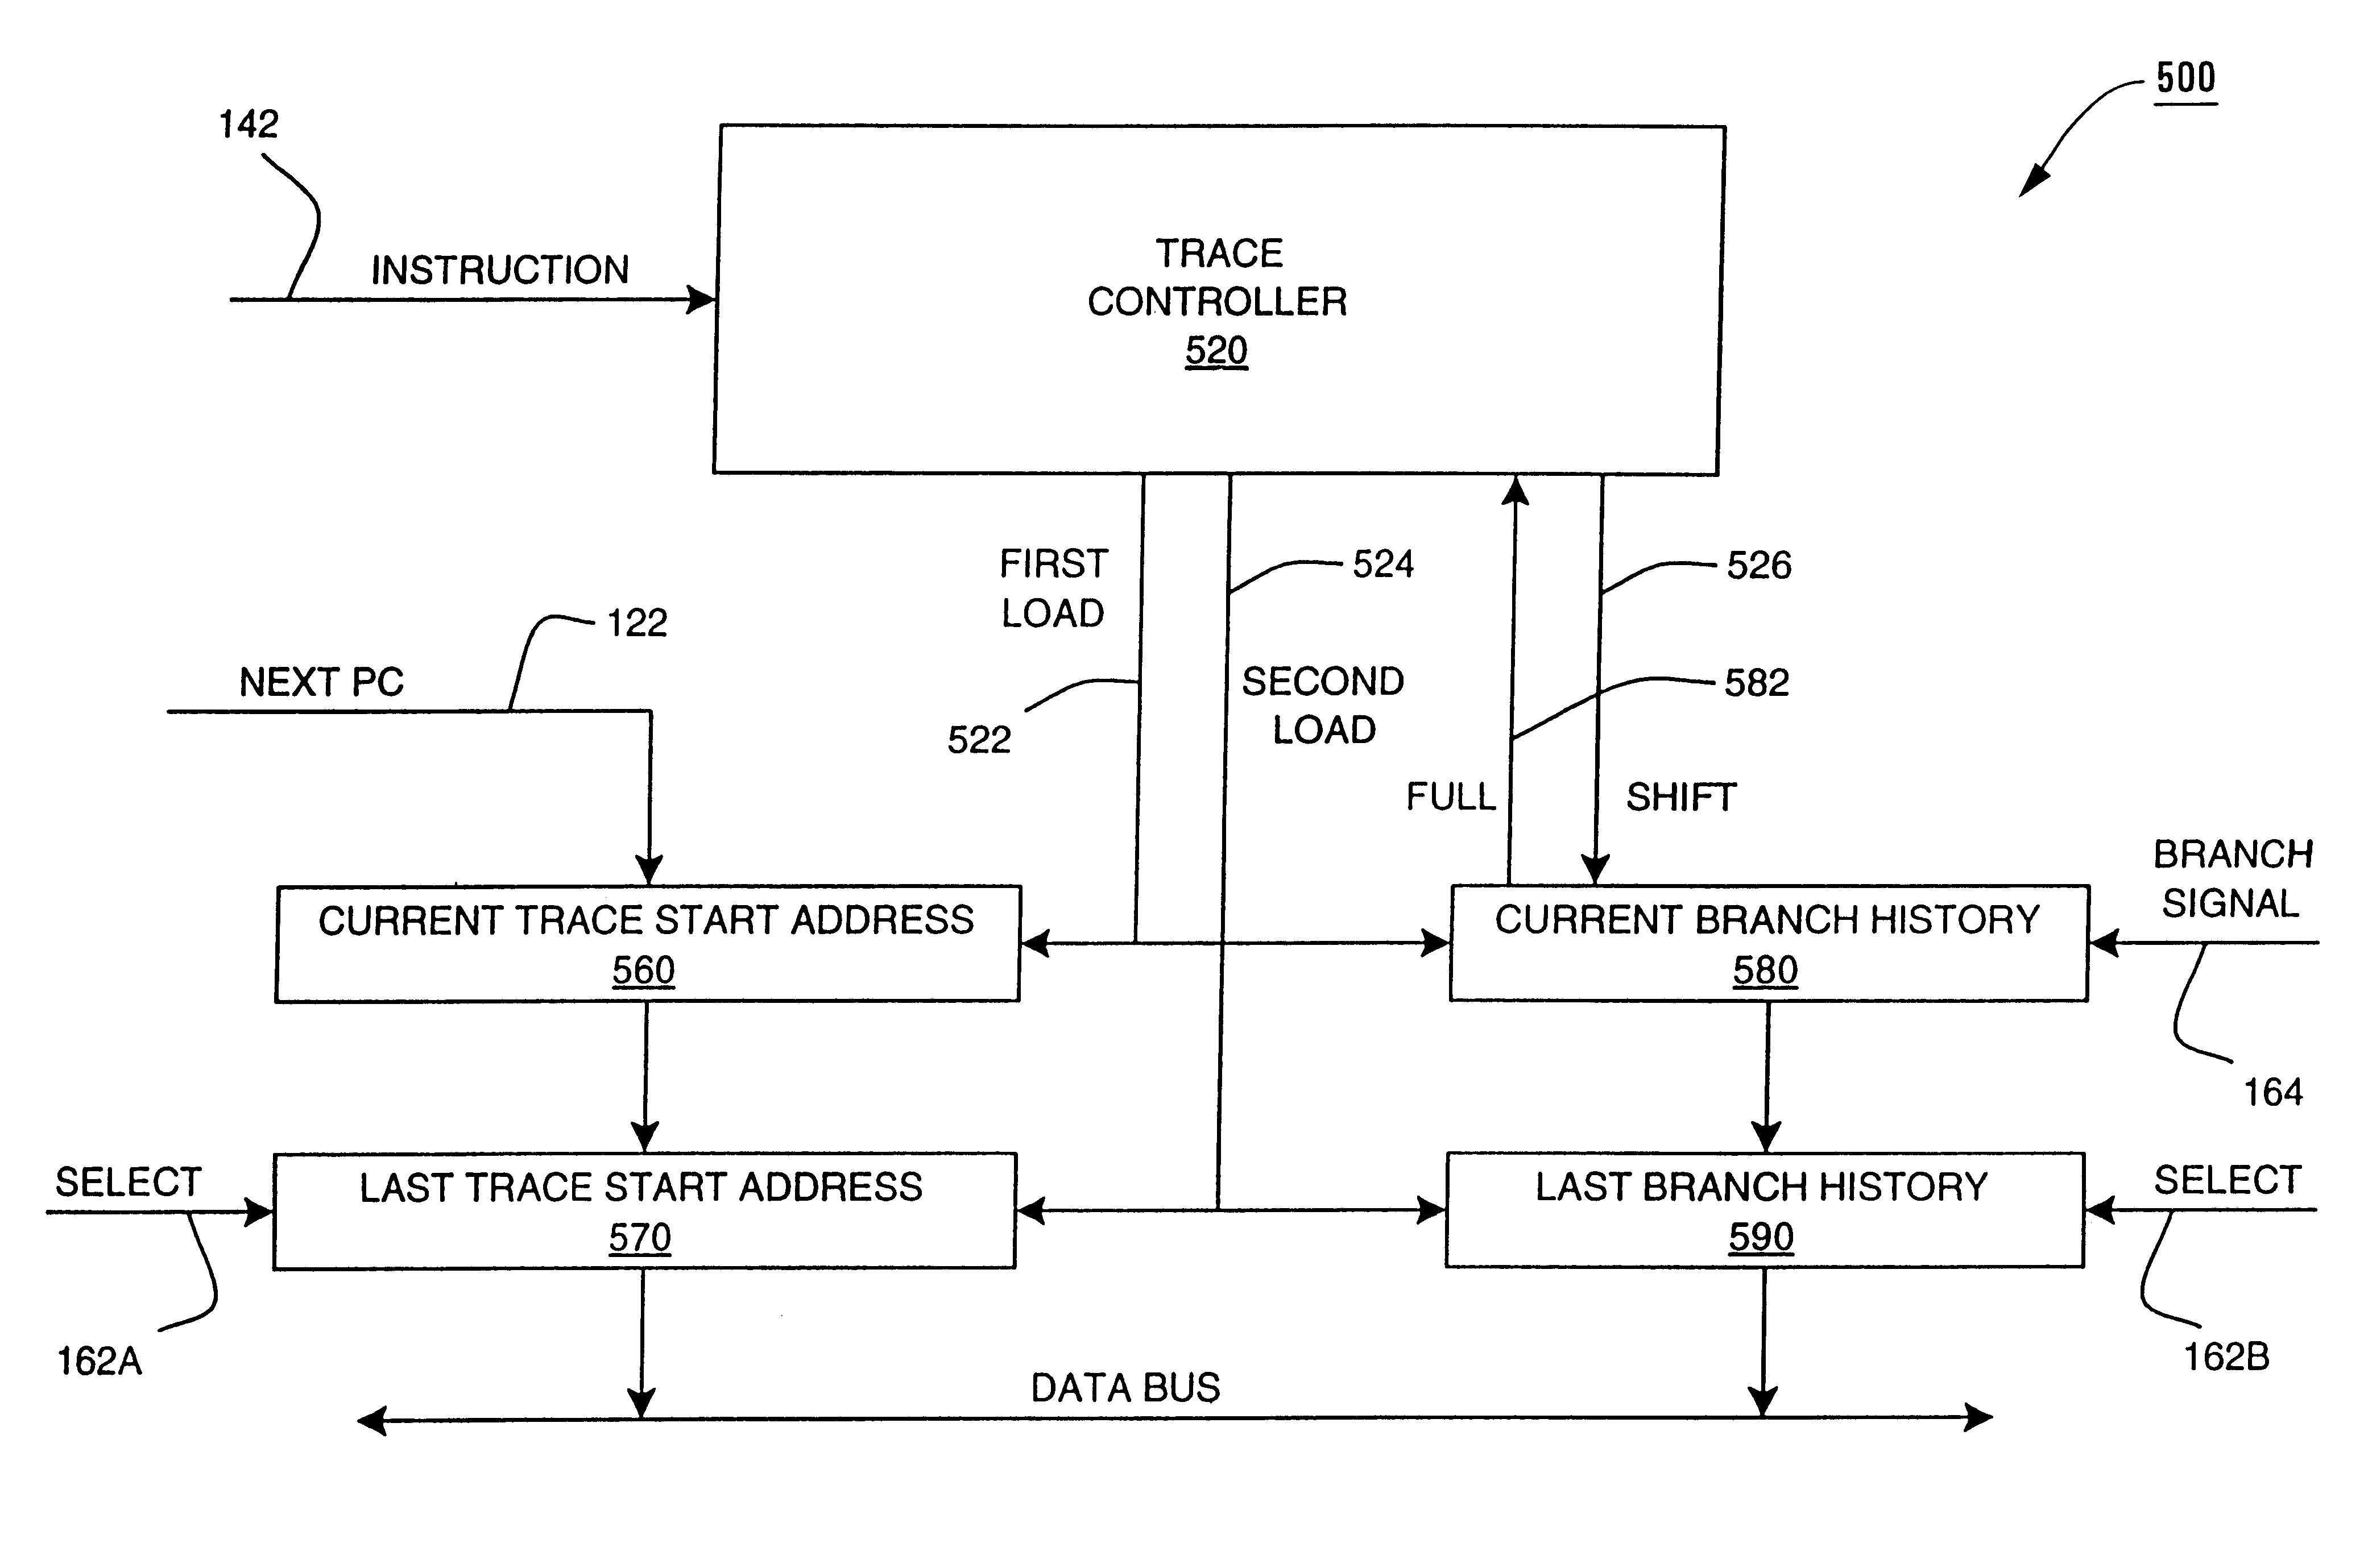
The present invention is directed towards statistical trace sampling of a program's control flow behavior as it executes on a processor, such as the processor of FIG. 4. A trace is a dynamic sequence of branches that ends when a "trace termination condition" is true. Examples of trace termination conditions are a backward taken branch, where the branch target address is a lower program count than the program count of the branch instruction, or an indirect branch, where the branch target can only be determined by executing that instance of the branch (i.e., the target cannot be determined by decoding the branch instruction itself.

It is also advantageous to limit the overhead involved with trace sampling by placing a limit on the branch history size for a trace and generating a trace termination condition when the limit is reached. The branch history limit is the maximum number of conditional direct branches allowed in a trace. The branch history limit serves to bound the size of the ...


PUM


Abstract

An apparatus and method are shown for collecting a branch history value of a program executing in a processor. A current start address register latches a program count value in response to a trace termination condition, such as an indirect branch instruction. A current branch history register is cleared in response to the trace termination condition and shifts in a branch outcome value of the processor in response to a conditional direct branch instruction. A last trace start address latches the content of the current trace start address and a last branch history register latches the content of the current branch history register when a trace termination condition occurs.

Description

1. Field of the InventionThis invention relates generally to the runtime profiles of software programs executing on computers.2. Description of the Related ArtRuntime profiling is a mechanism for understanding a program's runtime behavior. A runtime profile is a collection of information indicating the control flow path of a program, i.e. which instructions executed and where branches in the execution took place. Profile-based optimizations can then be used for instruction scheduling, loop scheduling, data preloading, function in-lining, and instruction cache performance enhancement.The runtime profile of a program is used by optimizing compilers and dynamic translators to focus their analysis efforts on parts of the program where greater performance benefit is likely. Advanced compilers perform optimizations across block boundaries to increase instruction-level parallelism, enhance resource usage and improve cache performance. Profile data is also useful for software developers in ...

Claims


Application Information

Patent Timeline
Patent Type & Authority Patents(United States)
IPC IPC(8): G06F11/36G06F9/38G06F9/32G06F11/28
CPCG06F11/3612G06F9/30061
Inventor BALA, VASANTH
Owner HEWLETT PACKARD CO
Why Eureka
Try Eureka