
Method and tool for network vulnerability analysis

a vulnerability analysis and network technology, applied in the field of countermeasures against attacks, can solve the problems of inability to inability to quantify security risks in computer networks, and current methods that do not trace causality throughout the system

Inactive Publication Date: 2006-03-14
SANDIA NAT LAB
View PDF13 Cites 258 Cited by
  • Summary
  • Abstract
  • Description
  • Claims
  • Application Information

AI Technical Summary

Benefits of technology

[0011]An object of the present invention is to provide a graph-based approach to network vulnerability analysis that is flexible, allows analysis of attacks from both outside and inside the network, and can analyze risks to a specific network asset, or examine the universe of possible consequences following a successful attack.
[0012]Another object of the invention is to provide a graph-based tool that can identify the set of attack paths that have a high probability of success (or a low “effort” cost) for the attacker.

Problems solved by technology

According to the Commission Report of the Presidential Commission of Critical Infrastructure Protection, “Critical Foundations: Protecting America's Infrastructures” (October 1997), industry and government are vulnerable to attack through their reliance on information technologies.
The current approach to information assurance, however, is often driven by checklists and compliance standards, and not by an overall understanding of system requirements and the components chosen to implement those requirements within a required risk level.
Further, current methods do not trace causality throughout a system.
Quantifying security risks in computer networks is very difficult.
These methods, however; have limited effectiveness in the analysis of computer networks because they cannot model multiple attacker attempts, time dependencies, or access controls.
Methods such as influence diagrams and event trees suffer from the same limitations as fault trees.
Such tools, however, do not consider the physical network topology in conjunction with set of attacks.
However, these scanners do not verify that all conditions for a complete attack are met, nor do they identify linked attacks potentially more harmful than individual attacks.
Though they can suggest fixes for local potential problems, they don't consider the network as a whole, proposing a global set of cost-effective defenses designed to protect the network's most critical resources.
However, they were not always able to compute METF, even for fairly small graphs.

Method used


Image

  • Method and tool for network vulnerability analysis
  • Method and tool for network vulnerability analysis
  • Method and tool for network vulnerability analysis

Examples


example

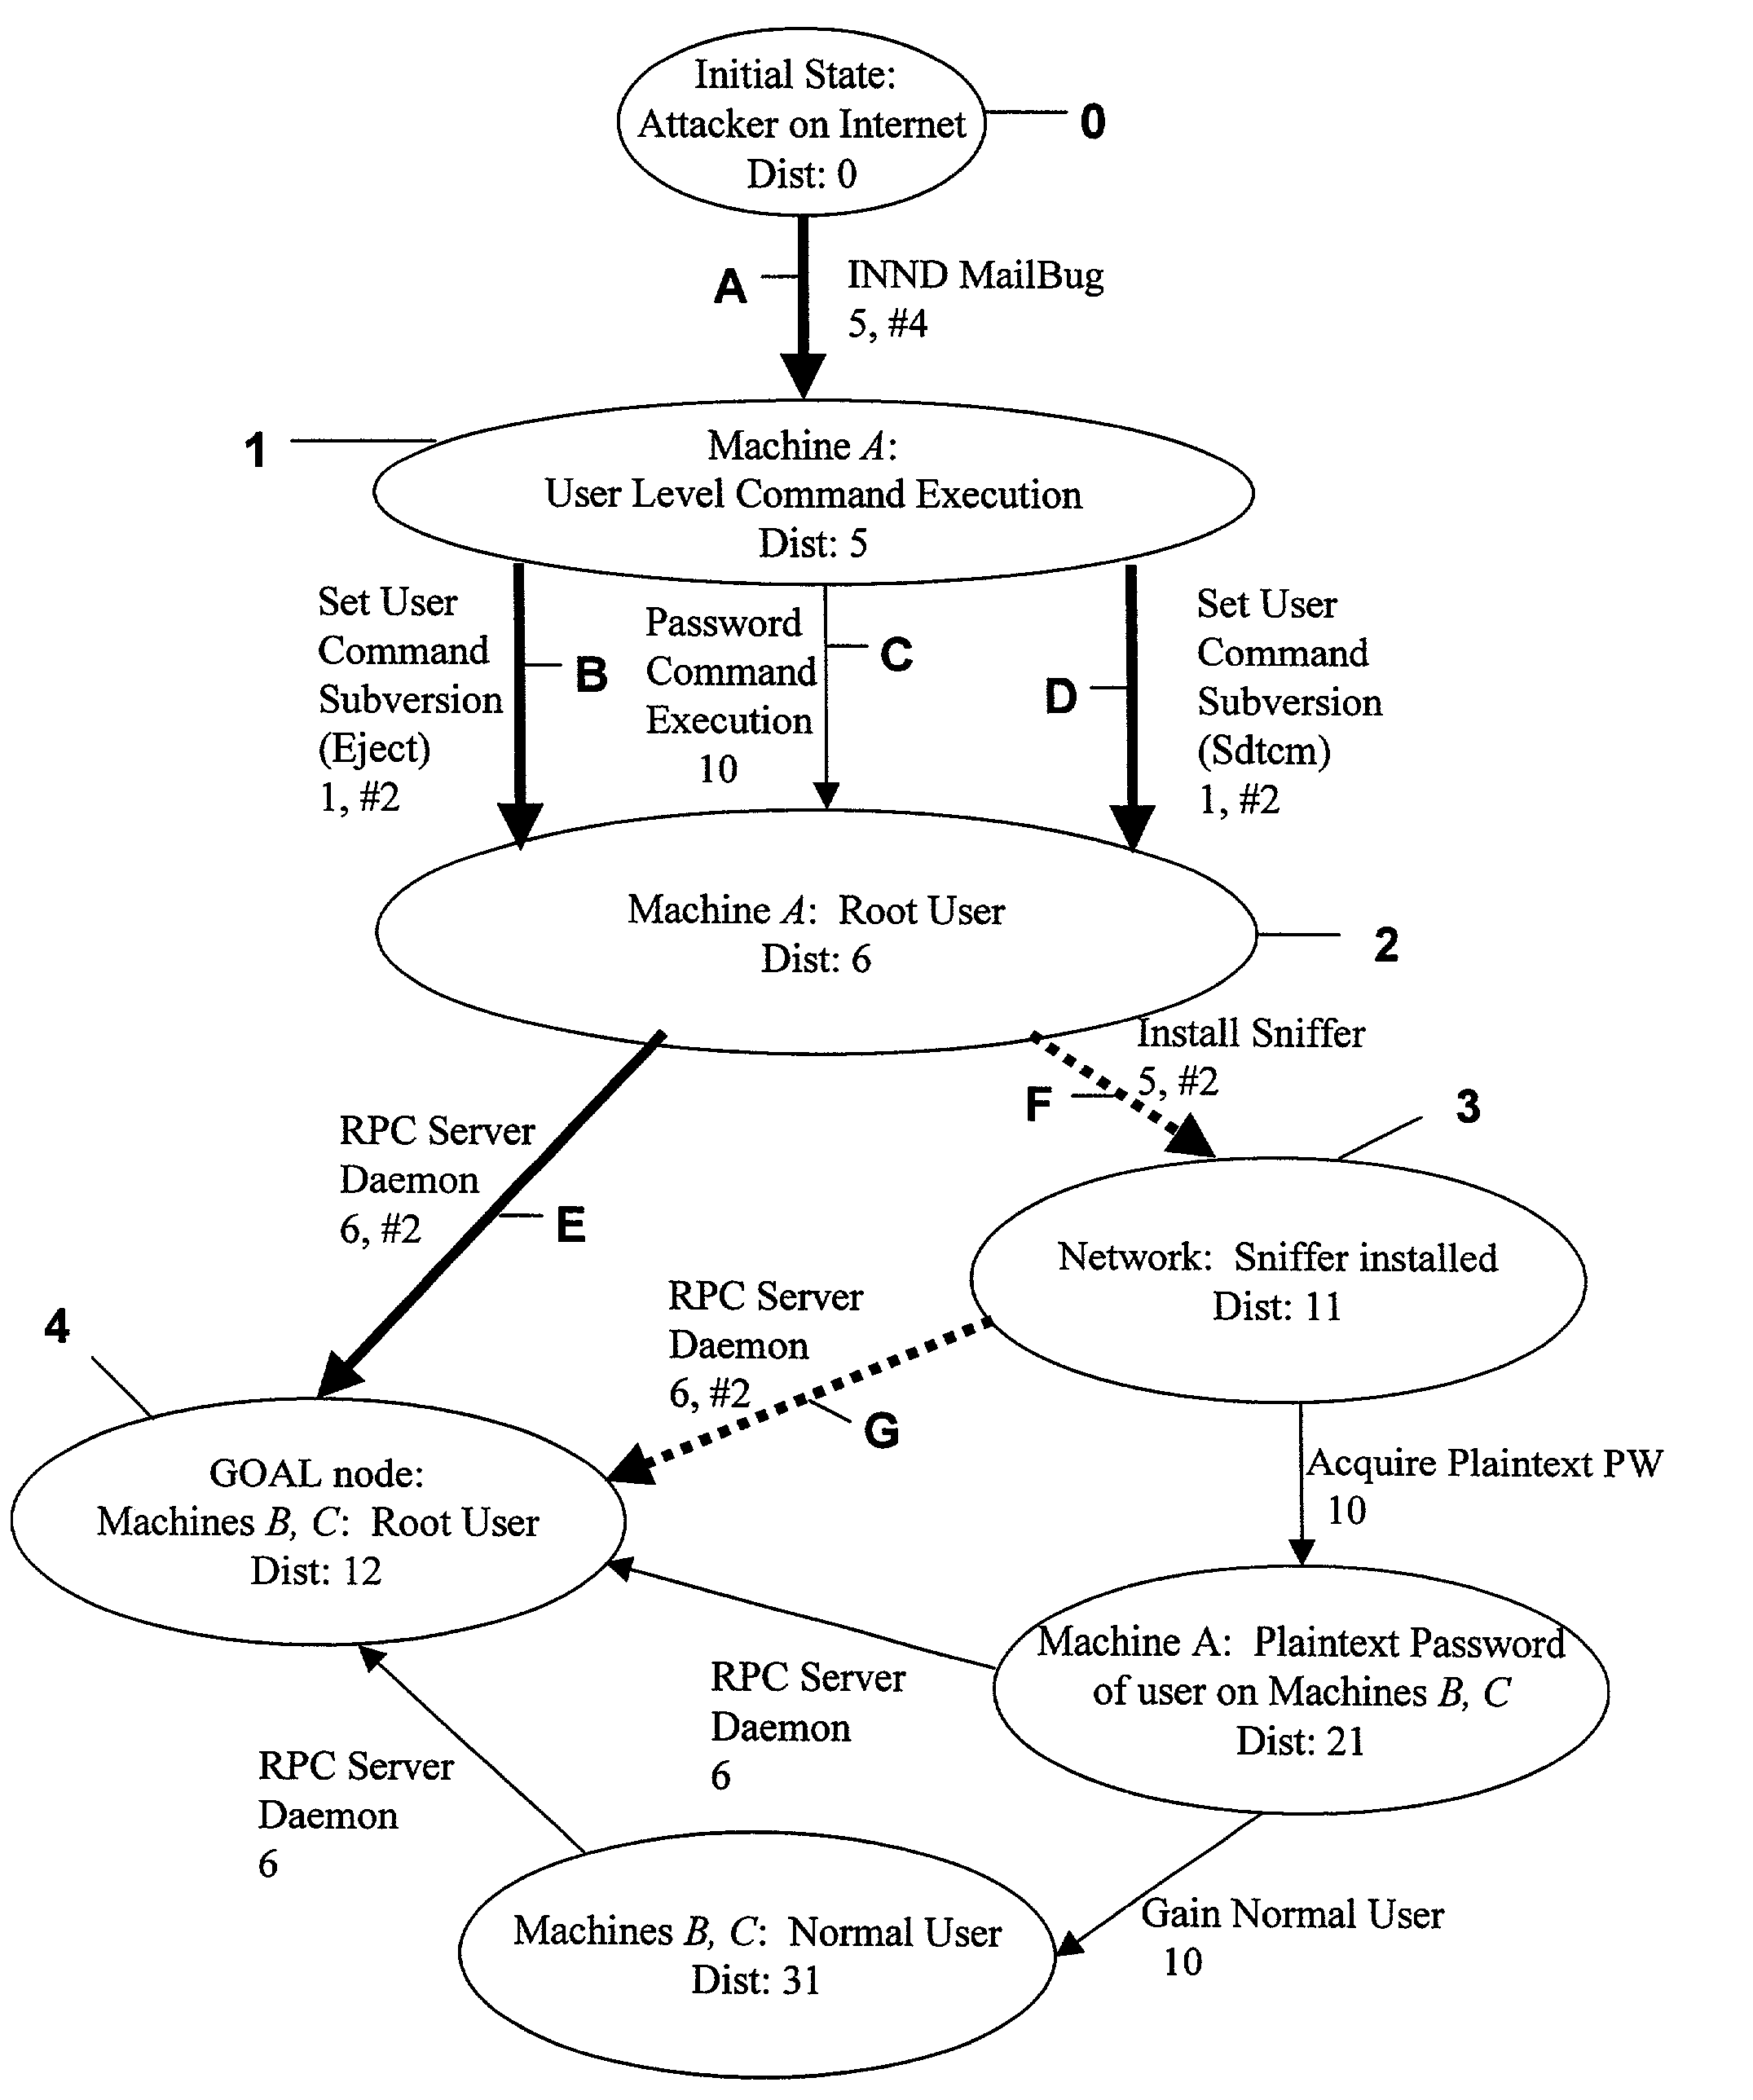
[0029]The following is a description of a working prototype tool. In the embodiment of the prototype tool, the graph-generation program is linked to a user interface developed in Tcl / Tk. The user interface allows the user to specify basic parameters for the graph generation, run the graph generator, analyze the graph, and view the output. The attack graph is drawn and displayed with a program called dot, which is public-release software developed by AT&T Research for drawing general graphs. Other graph drawing programs can be substituted for dot without departing from the principles of the claimed invention. Those skilled in the applicable art will be capable of selecting suitable programs for this purpose.

[0030]The tool comprises several different modules. In this example, as previously outlined with regard to the invention, generally, attack templates include a listing of requirements on one or more machines and a list of vulnerabilities and capabilities that are added or deleted ...


PUM


Abstract

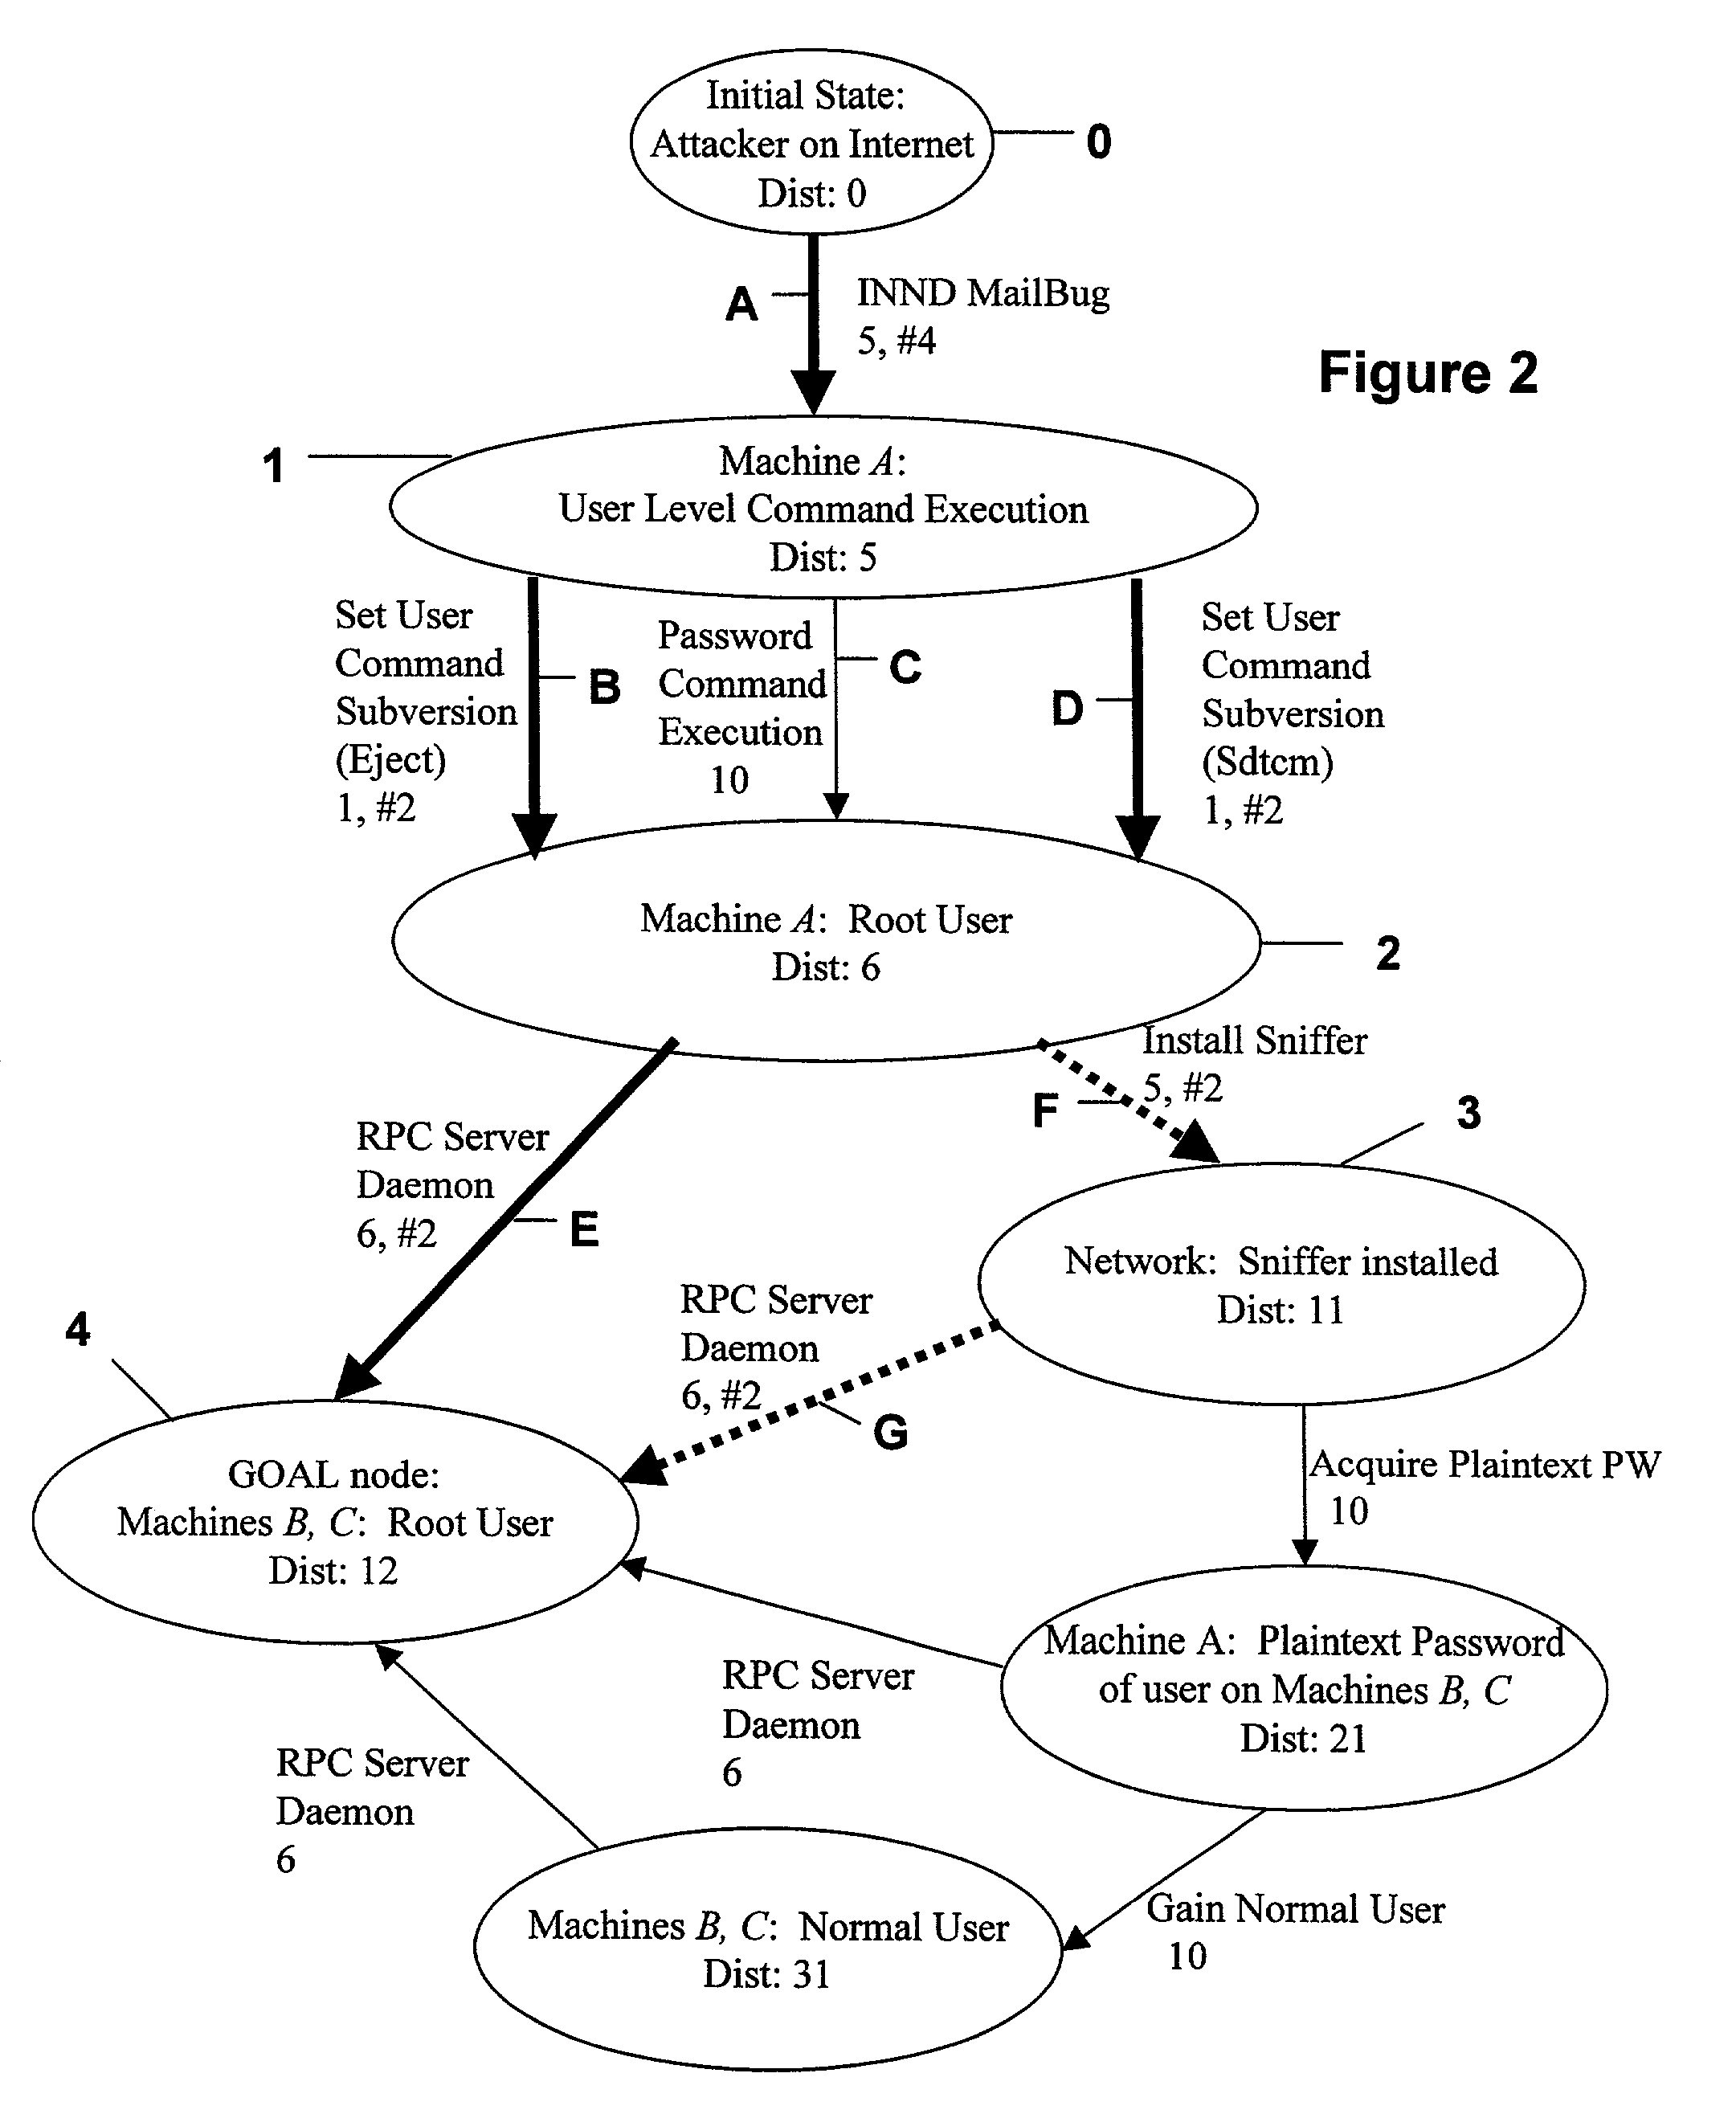
A computer system analysis tool and method that will allow for qualitative and quantitative assessment of security attributes and vulnerabilities in systems including computer networks. The invention is based on generation of attack graphs wherein each node represents a possible attack state and each edge represents a change in state caused by a single action taken by an attacker or unwitting assistant. Edges are weighted using metrics such as attacker effort, likelihood of attack success, or time to succeed. Generation of an attack graph is accomplished by matching information about attack requirements (specified in “attack templates”) to information about computer system configuration (contained in a configuration file that can be updated to reflect system changes occurring during the course of an attack) and assumed attacker capabilities (reflected in “attacker profiles”). High risk attack paths, which correspond to those considered suited to application of attack countermeasures given limited resources for applying countermeasures, are identified by finding “epsilon optimal paths.”

Description

[0001]This invention was made with Government support under Contract DE-AC04-94AL85000 awarded by the U.S. Department of Energy. The Government has certain rights in the invention.BACKGROUND OF THE INVENTION[0002]1. Field of the Invention[0003]This invention relates to the field of countermeasures against attacks on computer systems, and more particularly to a rigorous analysis method and computer software tool designed to identify which parts of a computer network are most vulnerable to attack by an adversary. Specifically, according to the invention, an attack graph is generated based on hypothesized capabilities of an adversary, network configuration information, and knowledge of the requirements for a successful attack. An attack graph generated in this fashion is then analyzed to determine high-risk attack paths and to provide insight into how to reduce network vulnerability.[0004]2. Description of the Related Art[0005]Military, government, commercial, and civilian operations a...

Claims


Application Information

Patent Timeline
IPC IPC(8): H04L9/00G06F11/30
CPCH04L63/1433H04L63/1441
Inventor SWILER, LAURA PAINTONPHILLIPS, CYNTHIA A.
Owner SANDIA NAT LAB
Learn More