Systems and methods for diagnosing the cause of trend shifts in performance data

a technology of performance data and system, applied in the field of automatic statistical systems and methods, can solve the problems of inefficient manual processes, inability to accurately diagnose the cause of trend shifts in performance data, and inability to accurately predict the effect of trend shifts, etc., to achieve the effect of optimizing the performance of automated diagnostic systems, large size and large siz

Inactive Publication Date: 2006-04-18
GENERAL ELECTRIC CO
View PDF3 Cites 37 Cited by
  • Summary
  • Abstract
  • Description
  • Claims
  • Application Information

AI Technical Summary

Benefits of technology

[0005]The systems and methods of the present invention allow an expert to enter one or more fuzzy functions related to one or more trend shifts into an automated diagnostic system. The automated diagnostic system then uses these rules to diagnose problems associated with a mechanical system, an electrical system, or an electro-mechanical system. A plurality of examples or validation cases are used to improve and refine the one or more fuzzy functions, optimizing the performance of the automated diagnostic system. Preferably, the improved fuzzy functions are presented to an engineer or the like for verification.
[0006]As an overview, the automated diagnostic systems and methods of the present invention allow an expert to build a plurality of fuzzy models describing how the mean of each of a plurality of performance parameters shifts for each of a plurality of predetermined problems. Outliers are removed using standard statistical techniques. The performance data is split by time in such a way as to allow linear or non-linear regressions to be run through each of a plurality of performance data segments with the lowest total residuals. The split points are evaluated to determine which are most likely to represent the beginning of a given problem. Data sets from the end of the performance data and around the best split point(s) are chosen such that each data set includes as many data points as possible without a standard deviation too far above that of the standard deviation of the linear regression residuals of the entire data window. T-tests or the like are then run on the data sets and rolled together with the fuzzy functions incorporated in the fuzzy models. Modeled problems that receive the highest scores are reported.
[0007]In one embodiment of the present invention, an automated method for diagnosing the cause of a trend shift in performance data associated with a system includes selecting a fuzzy model describing how the mean associated with a parameter shifts when a predetermined problem occurs and receiving performance data associated with the system. The diagnostic method also includes applying a preferred set of piecewise regressions. The diagnostic method further includes selecting a start date and selecting data sets near the start date and an end date that have a relatively large size without violating normal scatter. The diagnostic method still further includes measuring the mean shift between a plurality of samples using one or more statistical tests and combining the results with the fuzzy model to achieve a diagnosis.
[0008]In another embodiment of the present invention, an automated method for diagnosing the cause of a trend shift in performance data associated with an aircraft engine system includes selecting a fuzzy model describing how the mean associated with a parameter shifts when a predetermined problem occurs and achieving a diagnosis using the fuzzy model. The diagnostic method also includes providing a plurality of validation cases associated with the aircraft engine system and validating the fuzzy model using the plurality of validation cases. The diagnostic method further includes providing an evaluation function and using the evaluation function to determine how well the fuzzy model differentiates the diagnosis from a plurality of incorrect diagnoses for the plurality of validation cases.
[0009]In a further embodiment of the present invention, an automated system for diagnosing the cause of a trend shift in performance data associated with a system includes a fuzzy model describing how the mean associated with a parameter shifts when a predetermined problem occurs and means for receiving performance data associated with the system. The diagnostic system also includes a first algorithm operable for applying a preferred set of piecewise regressions. The diagnostic system further includes a second algorithm operable for selecting a start date and a third algorithm operable for selecting data sets near the start date and an end date that have a relatively large size without violating normal scatter. The diagnostic system still further includes a fourth algorithm operable for measuring the mean shift between a plurality of samples using one or more statistical tests and means for combining the results with the fuzzy model to achieve a diagnosis.
[0010]In a still further embodiment of the present invention, an automated system for diagnosing the cause of a trend shift in performance data associated with an aircraft engine system includes a fuzzy model describing how the mean associated with a parameter shifts when a predetermined problem occurs and means for achieving a diagnosis using the fuzzy model. The diagnostic system also includes means for receiving a plurality of validation cases associated with the aircraft engine system and means for validating the fuzzy model using the plurality of validation cases. The diagnostic system further includes an evaluation function, wherein the evaluation function is used to determine how well the fuzzy model differentiates the diagnosis from a plurality of incorrect diagnoses for the plurality of validation cases.

Problems solved by technology

Typically, diagnosing the cause of trend shifts in performance data associated with mechanical systems, electrical systems, and electro-mechanical systems involves inconsistent, inefficient manual processes.
Such diagnostic systems are prone to over-fitting data and making important decisions based on infrequent and / or irrelevant information.
These diagnostic systems, however, are useful for diagnosing problems where examples or validation cases are plentiful and there is relatively little domain knowledge.
Examples or validation cases, however, are not plentiful.
These manually written rules suffer from the fact that they do not always match the examples or validation cases perfectly.
Differences in the way symptoms are measured and the inability to predict the magnitude and / or speed of symptoms cause the rules to be imprecise, even if they are relatively easily interpreted and corrected by engineers or the like performing manual diagnoses.
An automated diagnostic system performing such diagnoses, such as a computerized diagnostic system, has a relatively difficult time correcting the rules in real time.
Additionally, when multiple performance parameters are examined over time, rule-based systems, also referred to herein as “model-based systems,” suffer from model uncertainty (related to the inability to determine how large of a trend shift to correlate to a given problem) and measurement uncertainty (related to the inability to determine the extent of the effect of noise on a given trend shift).
These trend shift alerts often utilize dimensionality that is too low to make an accurate diagnosis and, historically, rules are only corrected when they fail, i.e., they are not optimized.

Method used


Image

  • Systems and methods for diagnosing the cause of trend shifts in performance data
  • Systems and methods for diagnosing the cause of trend shifts in performance data
  • Systems and methods for diagnosing the cause of trend shifts in performance data

Examples


Embodiment Construction

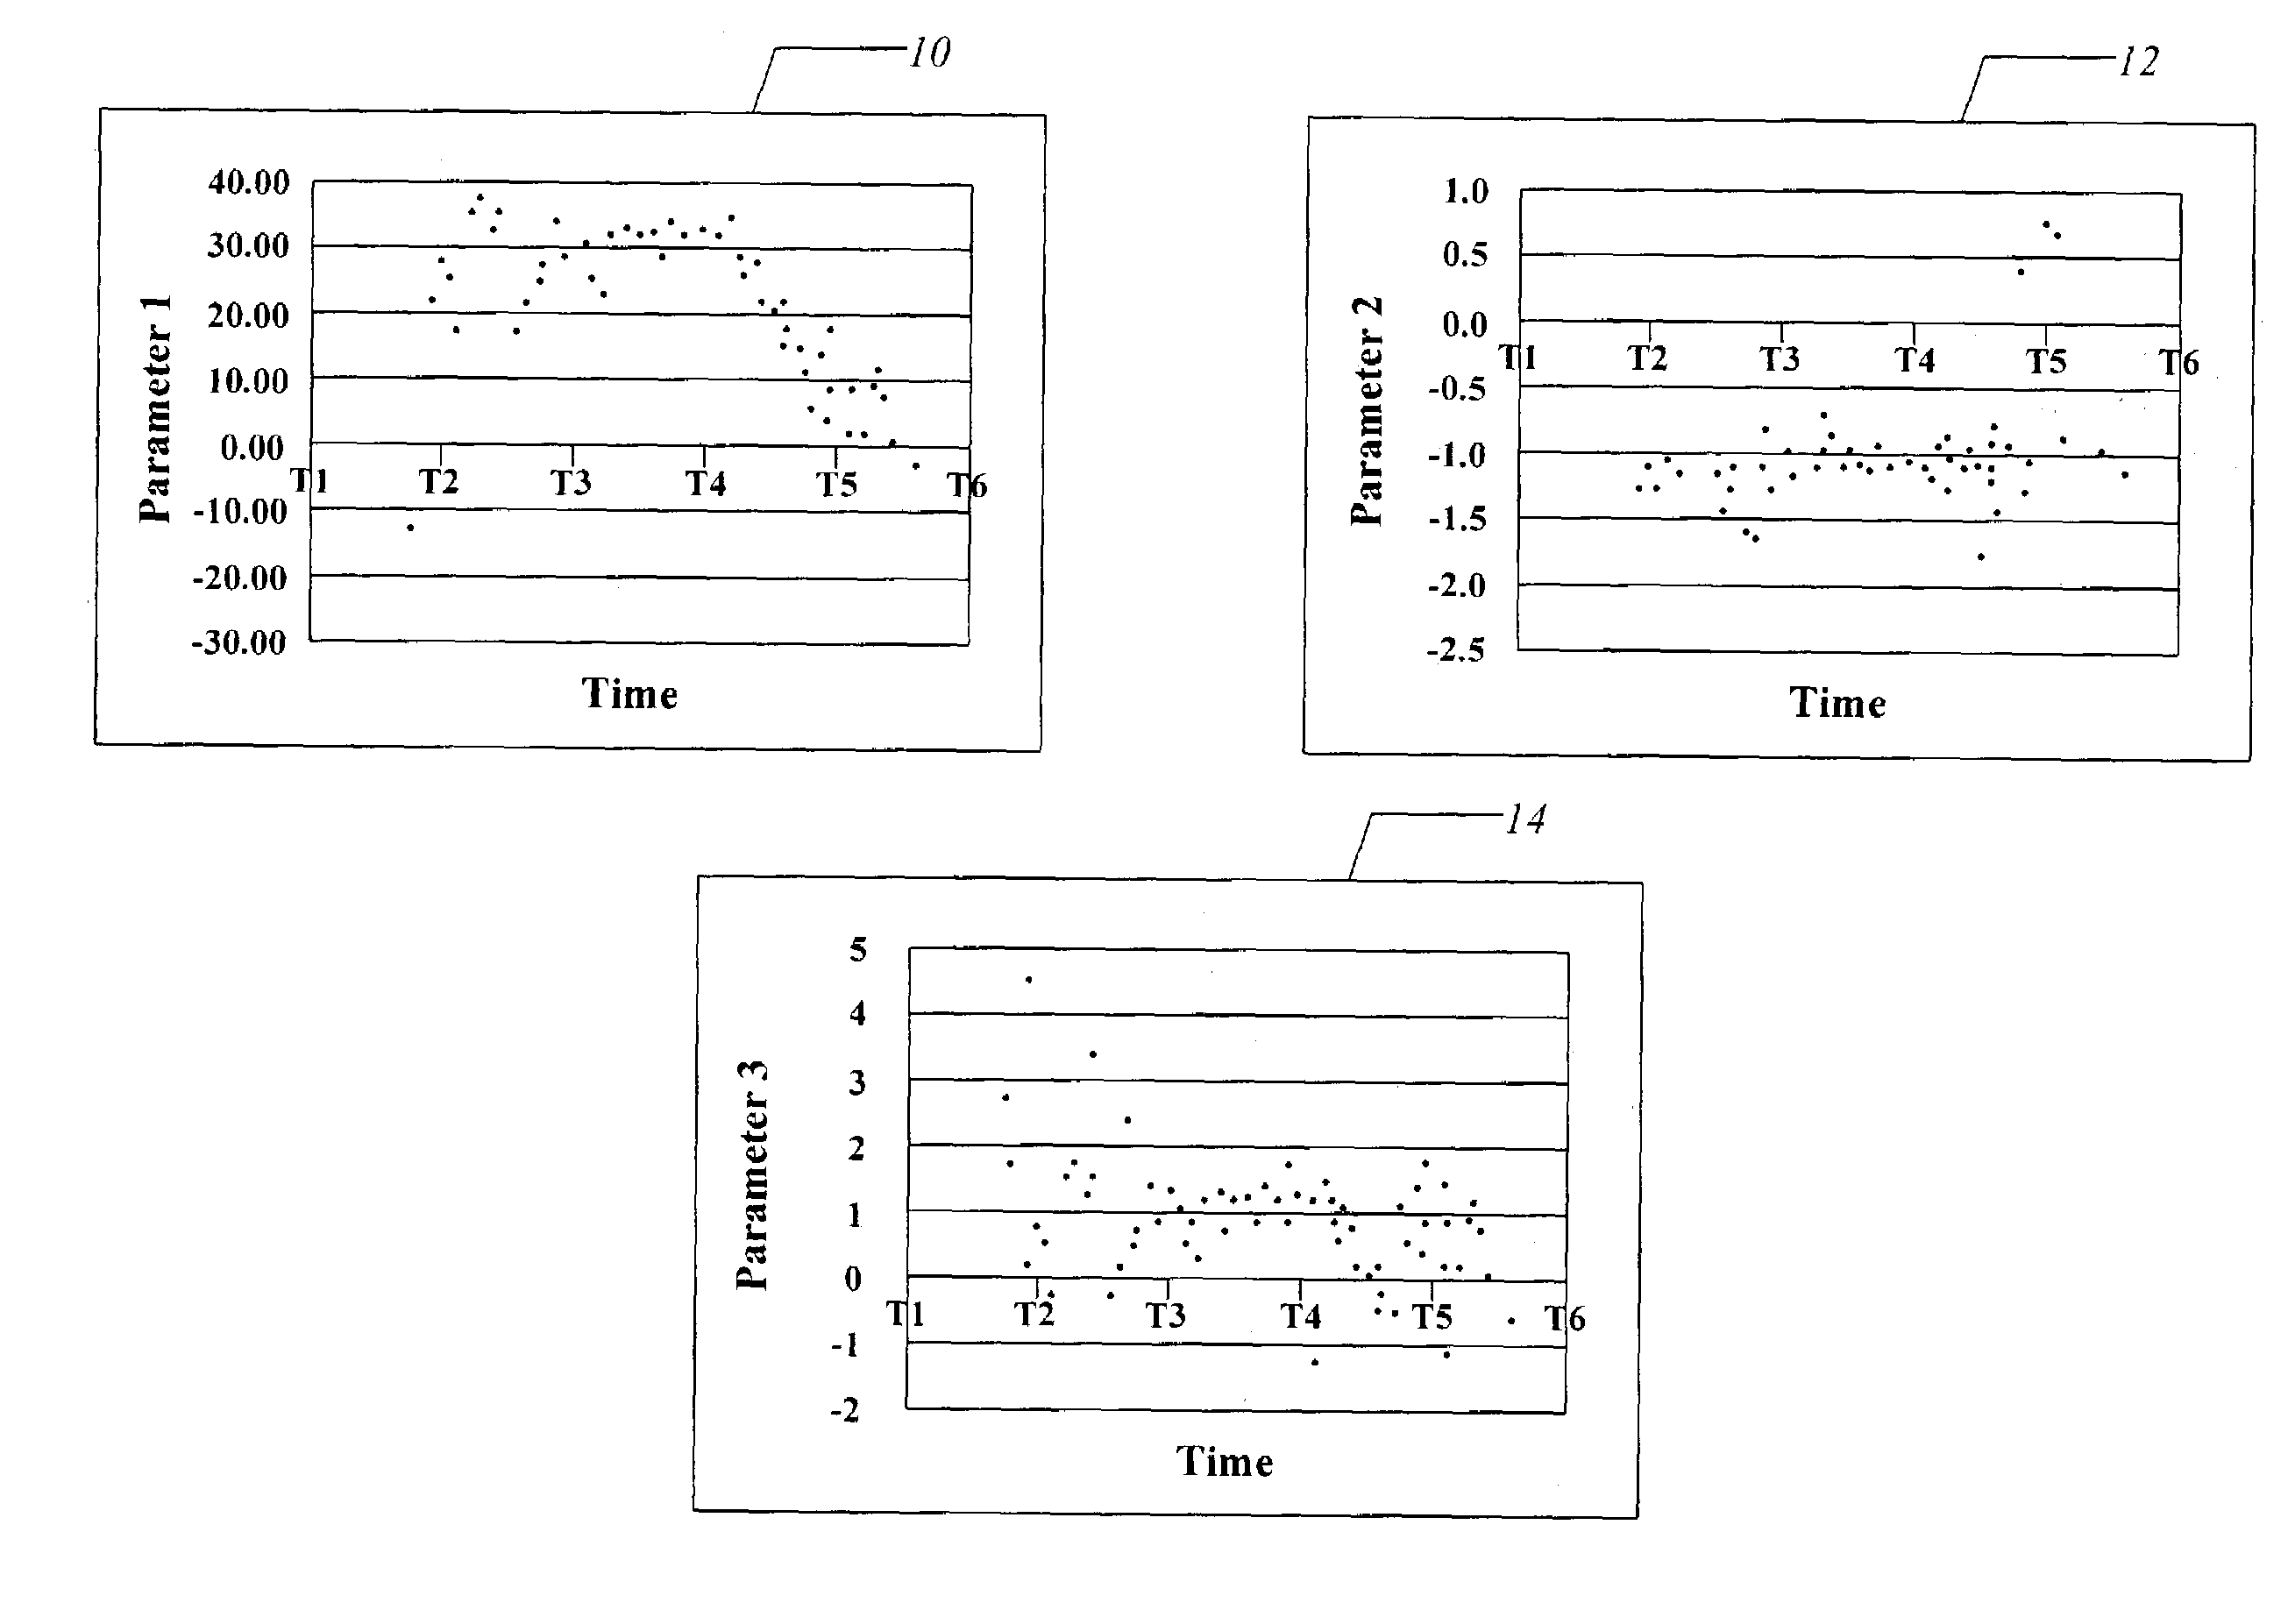
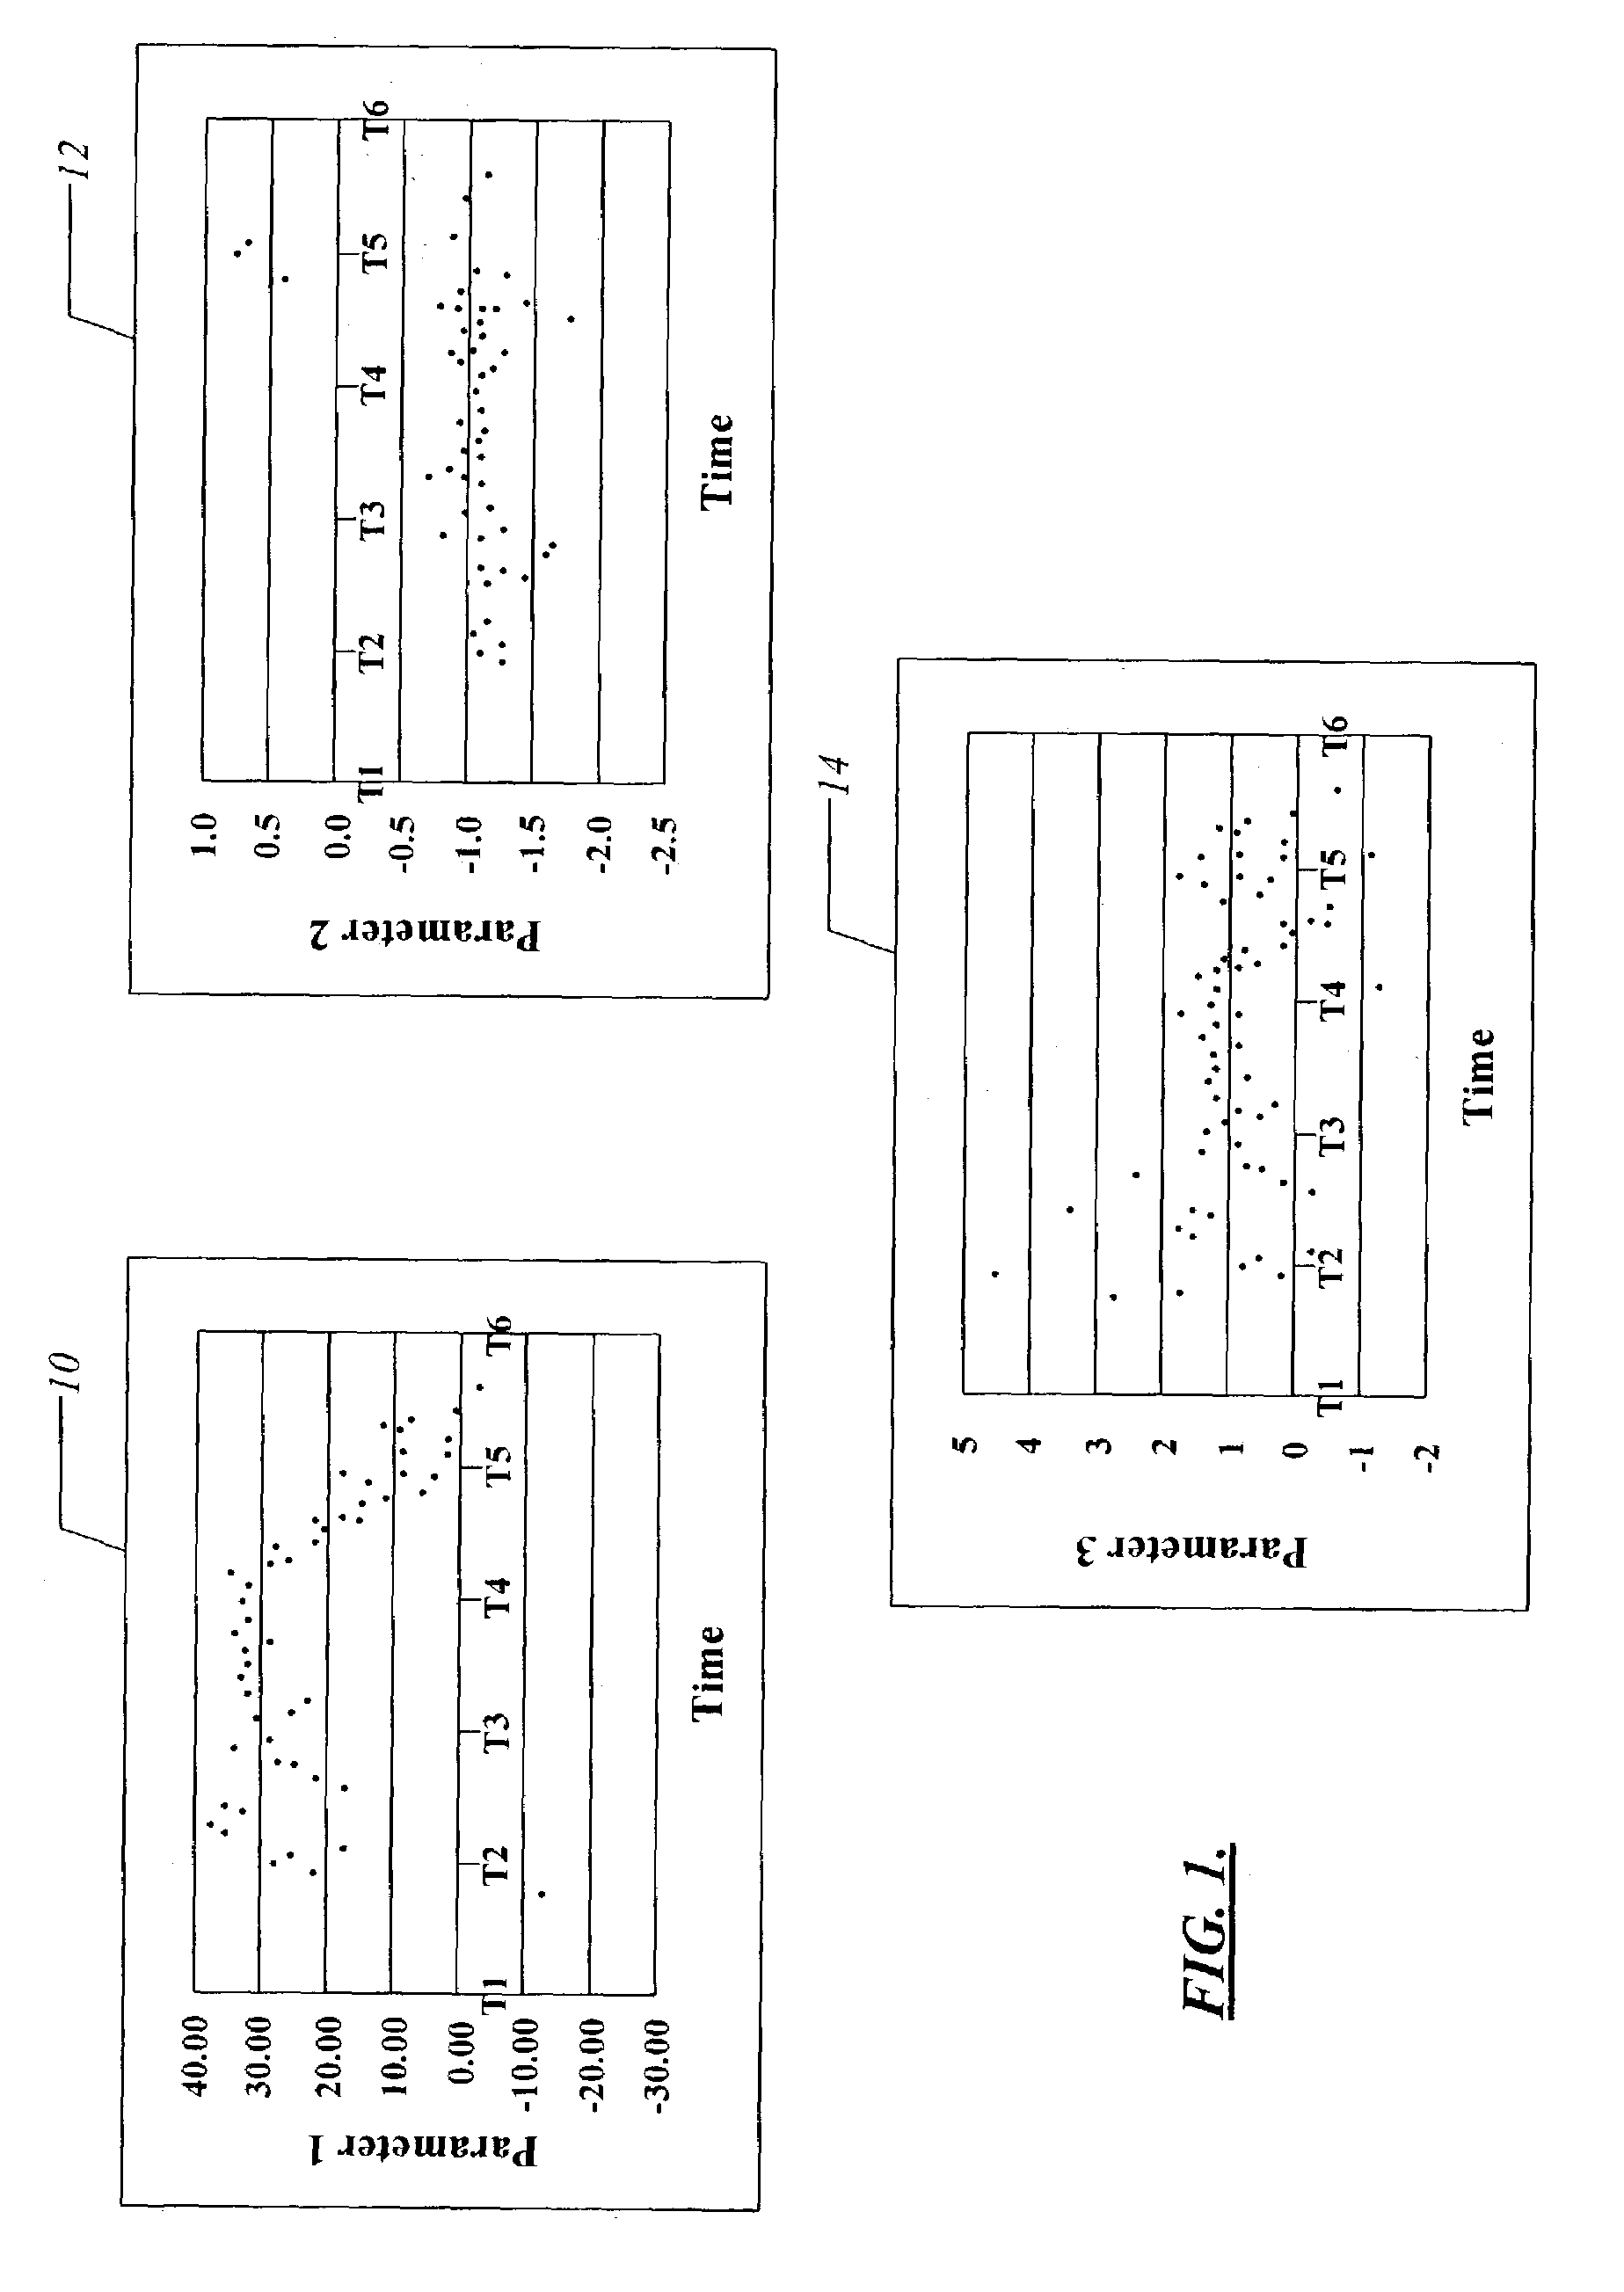
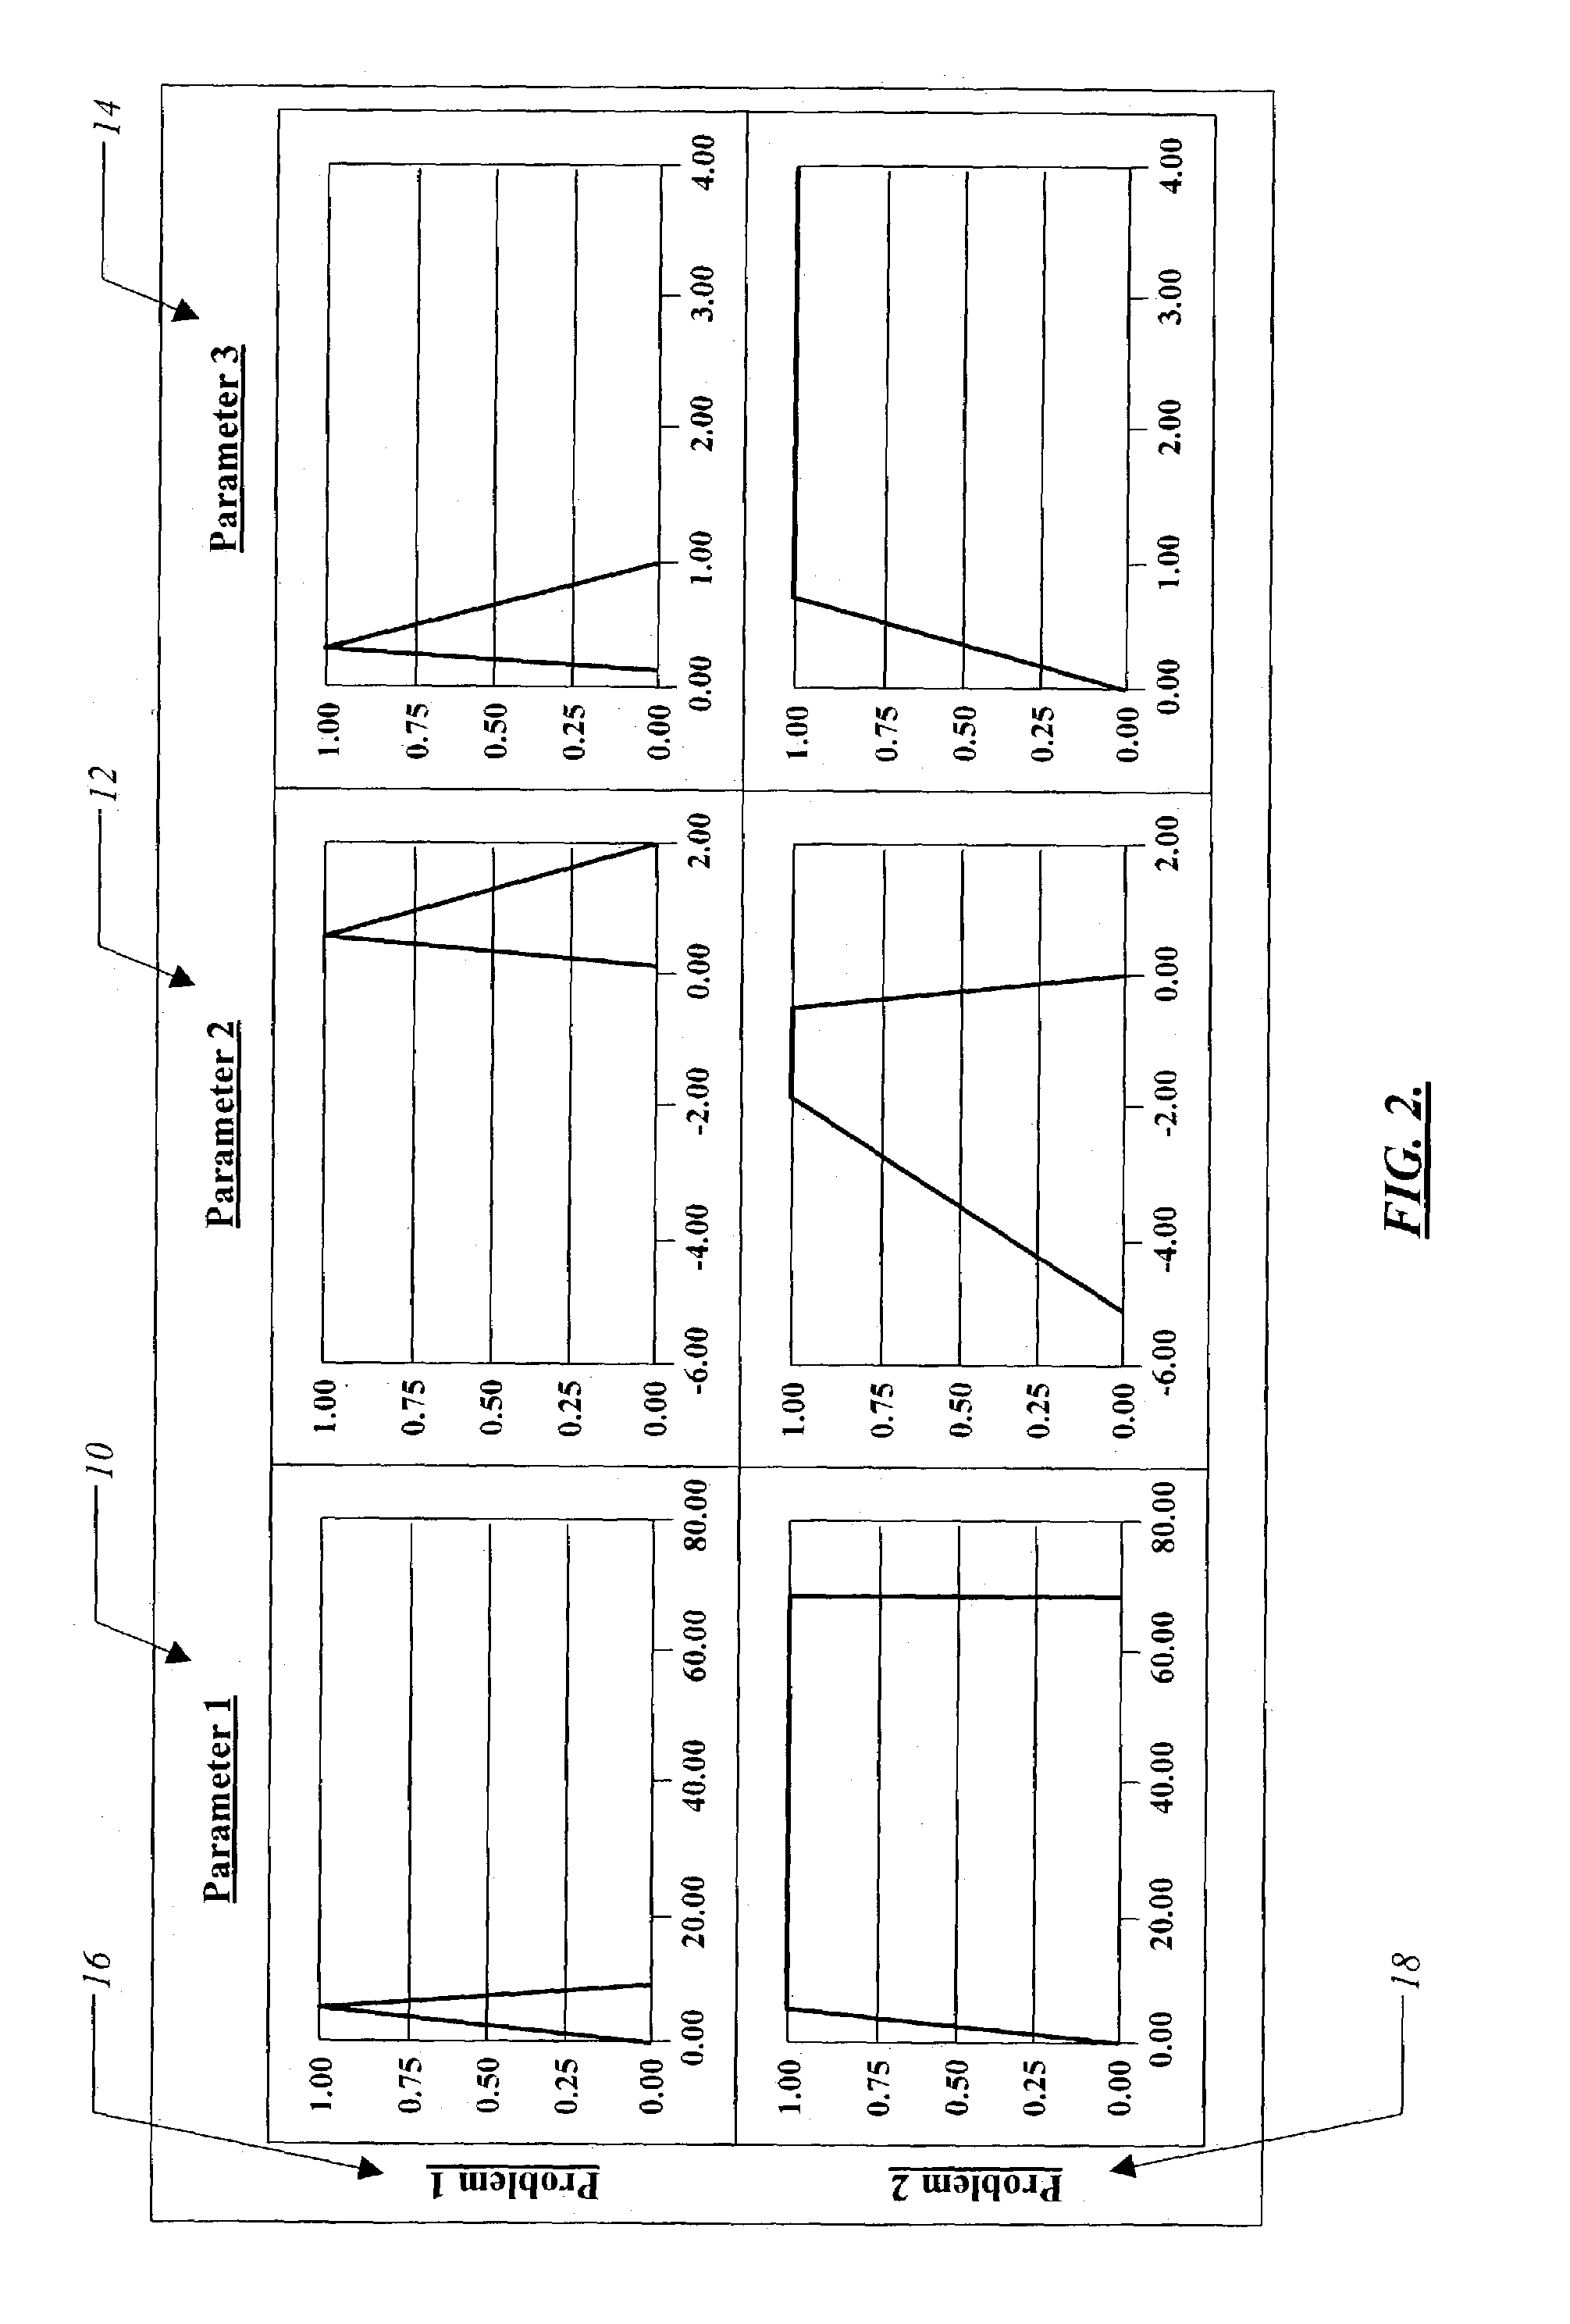
[0015]As an overview, the automated diagnostic systems and methods of the present invention allow an expert to build a plurality of fuzzy models describing how the mean of each of a plurality of performance parameters shifts for each of a plurality of predetermined problems. Outliers are removed using standard statistical techniques. The performance data is split by time in such a way as to allow linear or non-linear regressions to be run through each of a plurality of performance data segments with the lowest total residuals. The split points are evaluated to determine which are most likely to represent the beginning of a given problem. Data sets from the end of the performance data and around the best split point(s) are chosen such that each data set includes as many data points as possible without a standard deviation too far above that of the standard deviation of the linear regression residuals of the entire data window. T-tests or the like are then run on the data sets and rol...


PUM


Abstract

Automated systems and methods for diagnosing the cause of a trend shift in performance data associated with a system including selecting a fuzzy model describing how the mean associated with a parameter shifts when a predetermined problem occurs and receiving performance data associated with the system. The diagnostic systems and methods also including applying a preferred set of piecewise regressions. The diagnostic systems and methods further including selecting a start date and selecting data sets near the start date and an end date that have a relatively large size without violating normal scatter. The diagnostic systems and methods still further including measuring the mean shift between a plurality of samples using one or more statistical tests and combining the results with the fuzzy model to achieve a diagnosis.

Description

FIELD OF THE INVENTION[0001]The present invention relates generally to automated statistical systems and methods. More specifically, the present invention relates to systems and methods for diagnosing the cause of trend shifts in performance data. In one exemplary embodiment, the present invention relates to systems and methods for diagnosing the cause of trend shifts in aircraft engine performance data.BACKGROUND OF THE INVENTION[0002]Typically, diagnosing the cause of trend shifts in performance data associated with mechanical systems, electrical systems, and electro-mechanical systems involves inconsistent, inefficient manual processes. Engineers and the like who use such diagnostic systems have to choose between data-driven systems and rule-based systems. Data-driven systems, also referred to herein as “case-based systems” or “experience-based systems,” require the incorporation of a relatively large number of examples or validation cases before a given diagnostic system “learns...

Claims


Application Information

Patent Timeline
Patent Type & Authority Patents(United States)
IPC IPC(8): G06F11/30H04L12/24H04L12/26
CPCH04L43/00
Inventor CUDDIHY, PAUL E.CLEARY, DANIEL J.YU, LIJIE
Owner GENERAL ELECTRIC CO
Why Eureka
Try Eureka