Methods for reducing background fluorescence
a background fluorescence and fluorescence technology, applied in the field of background fluorescence reduction methods, can solve the problems of low background noise, false positive signals, and inability of labeled cells to distinguish labels, and achieve the effect of reducing background fluorescence and effectively reducing background fluorescence produced
- Summary
- Abstract
- Description
- Claims
- Application Information
AI Technical Summary
Benefits of technology
Problems solved by technology
Method used
Image
Examples
example 1
Background Fluorescence Reduction in Cell-Free Solutions
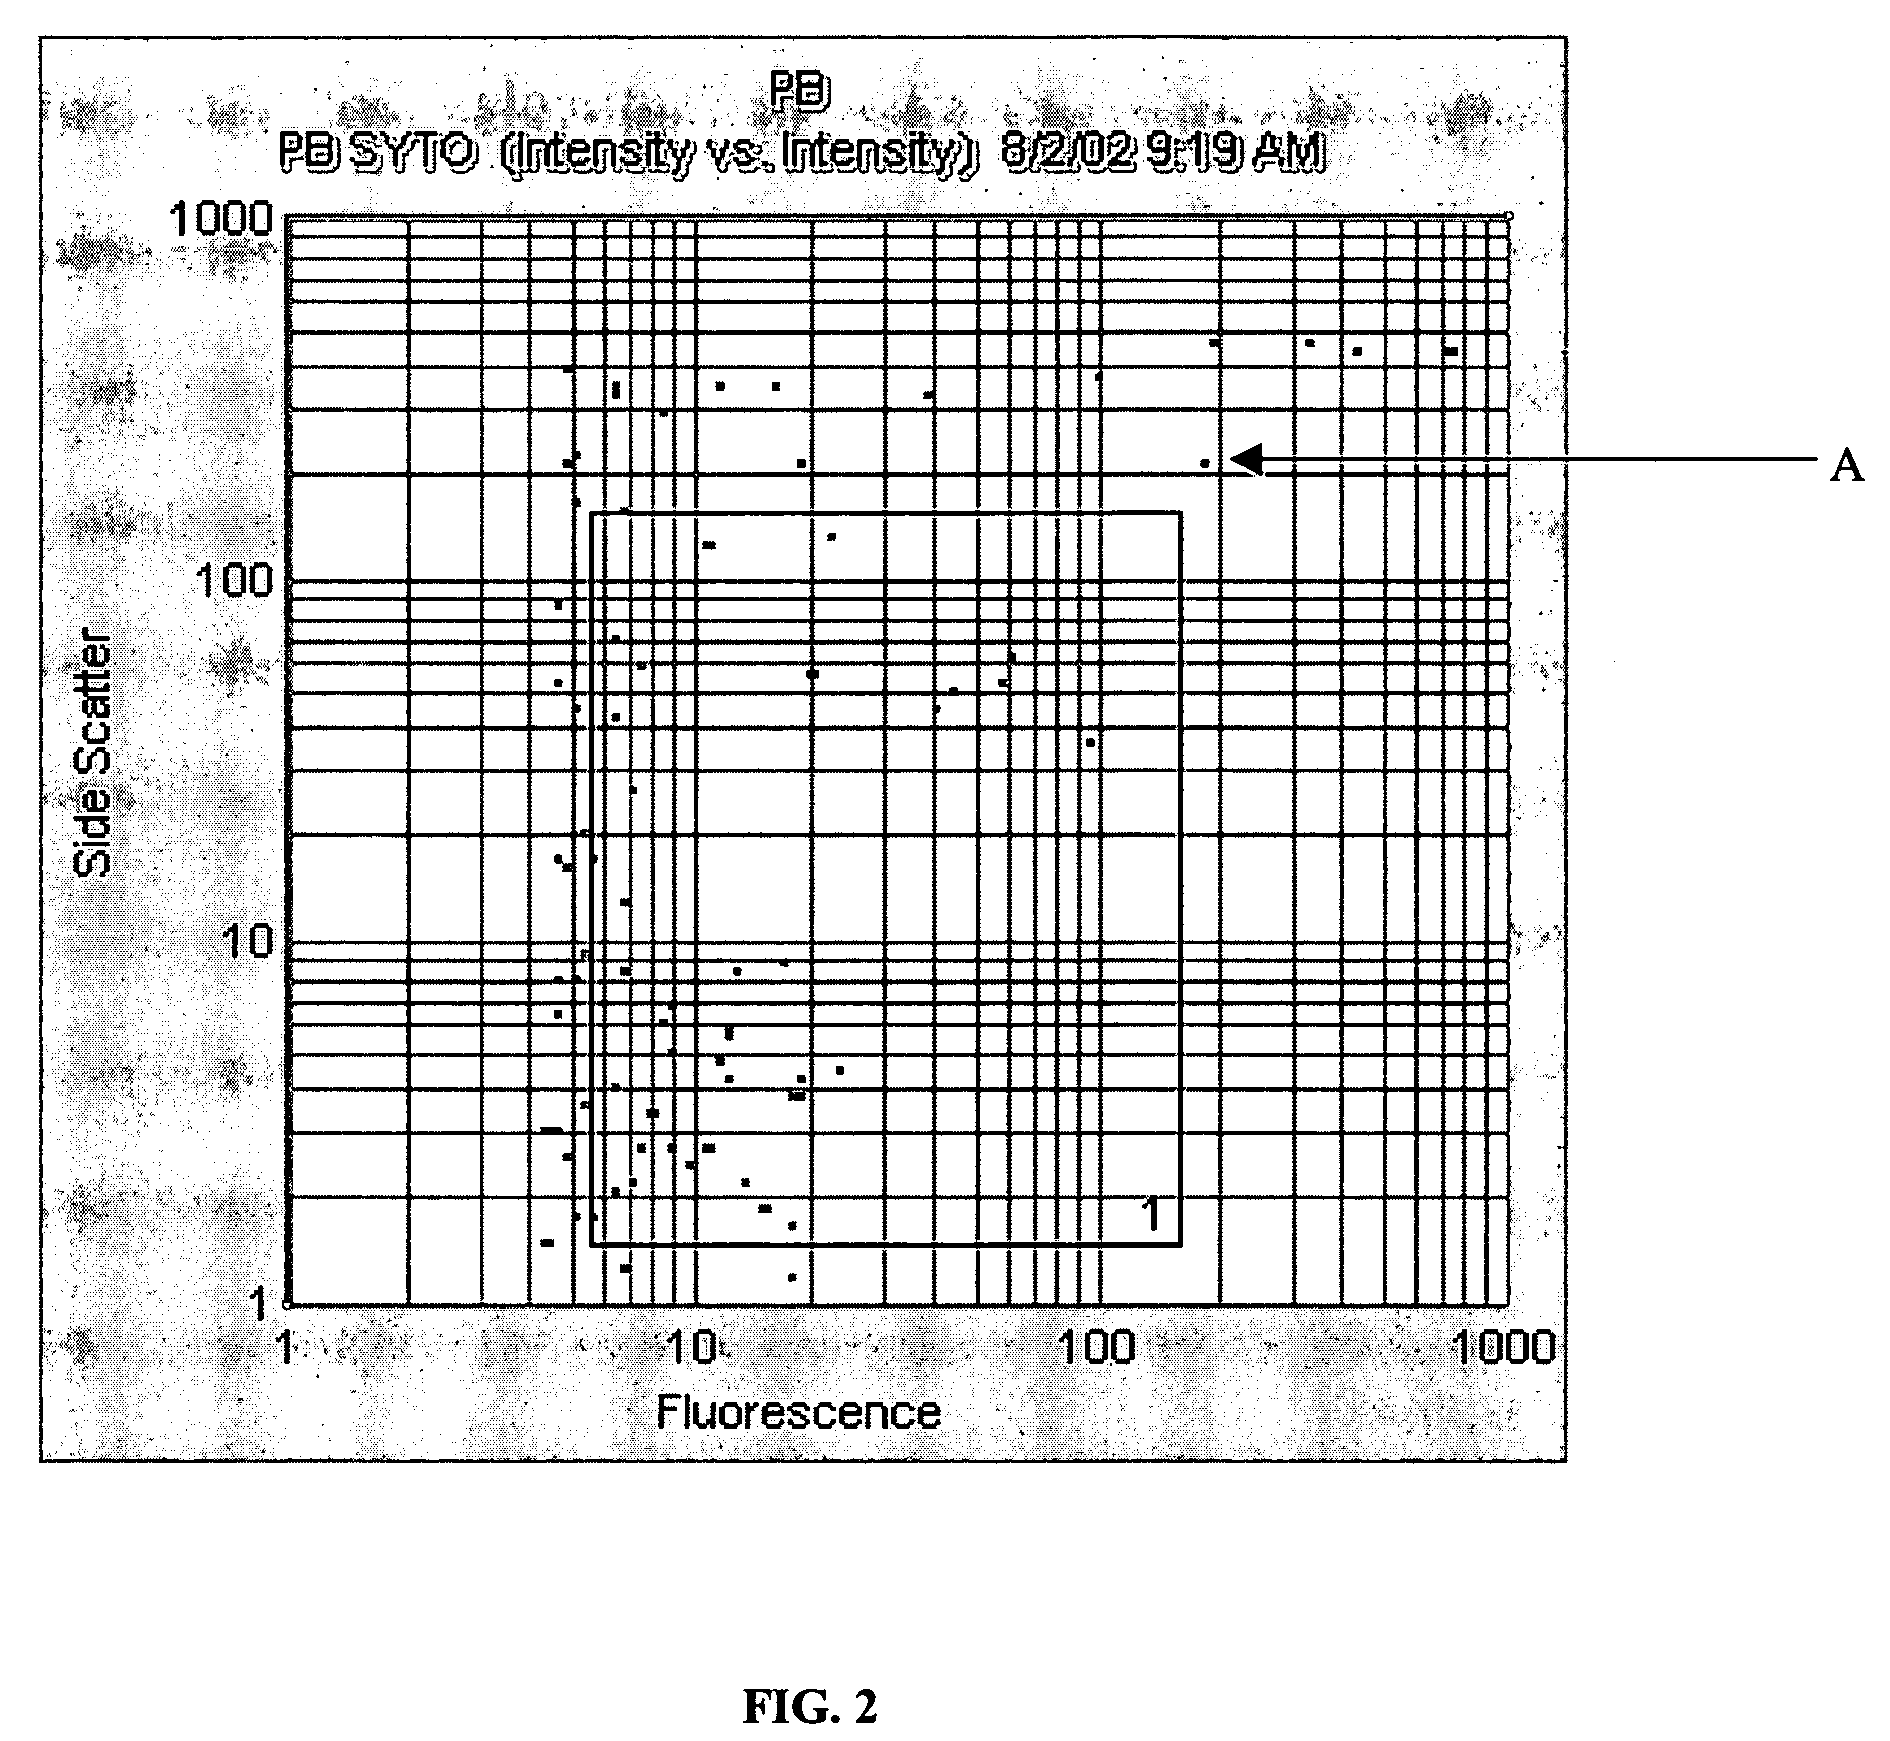
[0030]A cell-free solution containing 10 mM phosphate (pH 7.2) and 100 nM Syto 62 (Molecular Probes, Inc.) was introduced into a flow cytometer. Fluorescence and side scatter signals were collected, and their respective intensities were plotted against the x- and y-axis, as shown in FIG. 2.
[0031]Each spot in FIG. 2 corresponds to an individual count, meaning that the instrument was triggered by a fluorescent object to acquire data as the object traveled through the flow cytometer. The solution did not contain detectable cells. Therefore, the spots in FIG. 2 correspond to particles in the solution that were labeled with enough fluorescent dye (SYTO 62) to trigger the instrument. Each of these particles has its own size, shape and intensity of fluorescence. The location of the spot indicates both its fluorescence intensity (read from the x-axis) and its scattered light intensity (read from the y-axis). For example, the object lab...
example 2
Background Fluorescence Reduction in Solutions Containing Labeled Microbes
[0035]A solution containing 100 nM Syto 62 and an expected population of 14,400 cells / mL of Enterococcus fecaelis was introduced into a flow cytometer. FIG. 4 illustrates the scatter versus fluorescence plot of the solution. Two regions of interest in FIG. 4 were selected (box 1 and box 2). Most counts in box 1 correspond to signals produced by debris in the solution, such as mineral particulates. Most counts in box 2 (lower) correspond to signals produced by the cells in the solution. The total counts in boxes 1 and 2 were 902 and 2973, respectively. The total counts in FIG. 4 were 6396.
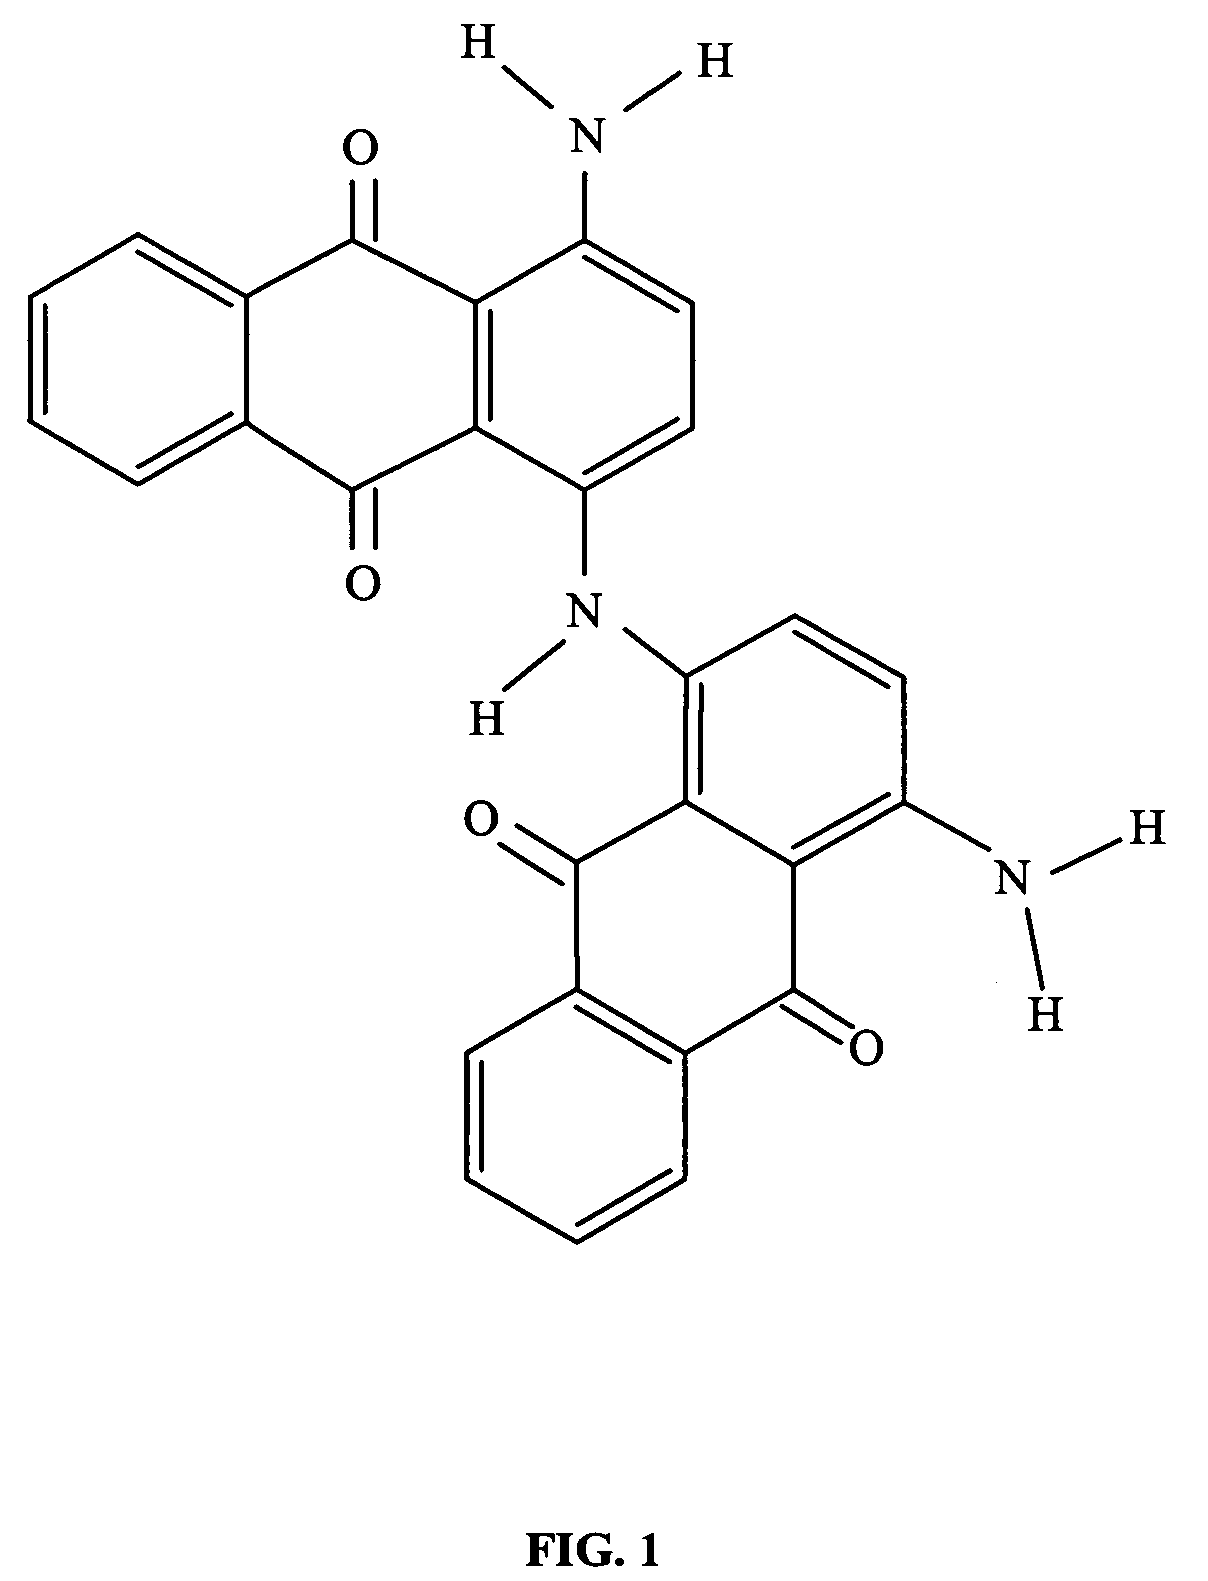
[0036]FIG. 5 shows the scatter versus fluorescence plot of the same solution as in FIG. 4, except that 22 μM Acid Black 48 was added. A significant reduction in background fluorescence was observed in FIG. 5, as compared to FIG. 4. The total counts in box 2 were 2684, while the total counts in box 1 was dramatically reduced to...
PUM
| Property | Measurement | Unit |
|---|---|---|
| emission wavelength | aaaaa | aaaaa |
| excitation wavelength | aaaaa | aaaaa |
| absorption wavelength | aaaaa | aaaaa |
Abstract
Description
Claims
Application Information
 - R&D
- Intellectual Property
- Life Sciences
- Materials
- Tech Scout
- Unparalleled Data Quality
- Higher Quality Content
- 60% Fewer Hallucinations
Browse by: Latest US Patents, China's latest patents, Technical Efficacy Thesaurus, Application Domain, Technology Topic, Popular Technical Reports.
© 2025 PatSnap. All rights reserved.Legal|Privacy policy|Modern Slavery Act Transparency Statement|Sitemap|About US| Contact US: help@patsnap.com


