Significance analysis of microarrays

a microarray and significance analysis technology, applied in the field of statistical analysis of gene related data, can solve the problems of erroneously identifying genes with changes of statistical significance, deemed potentially significant genes with scores greater than an adjustable threshold,

Inactive Publication Date: 2008-04-22
THE BOARD OF TRUSTEES OF THE LELAND STANFORD JUNIOR UNIV
View PDF11 Cites 9 Cited by
  • Summary
  • Abstract
  • Description
  • Claims
  • Application Information

AI Technical Summary

Benefits of technology

[0017]A new method, referred to herein as Significance Analysis of Microarrays (SAM), identifies genes with statistically significant differences in expression or other biological characteristics (such as gene copy number or levels of protein encoded by the genes), referred to below as values associated with the genes, by assimilating a set of gene-specific microarray data. For example, SAM may assign each gene a score representing such associated values, based on differences in gene expression or other biological characteristics in the data relative to the standard deviation of repeated measurements for that gene. Genes with scores greater than an adjustable threshold are deemed potentially significant. In some situations, gene expression may vary over a wide range of values, so that, in order to take full advantage of statistical analysis, it is preferable to choose statistical parameters for characterizing genes so that statistical significance can be assessed despite such variation of values. Preferably the parameters are chosen so that they are substantially independent of the ranges of values that characterize the genes. Thus, where a plurality of genes are associated with a plurality of sets of values obtained from data sources, a statistical parameter is provided that contains information concerning differences in the associated values of the genes among the sets. In one implementation, the parameters of the genes are adjusted so that the parameters are substantially independent of the average associated values of the genes over the sets. An observed value and an expected value of the adjusted parameter are calculated and compared to identify genes whose associated values differ by an amount of statistical significance among the sets. The sets of associated values of genes may be obtained from measurements using microarrays, data derived from such measurements, calculations or predictions using gene models, or other data sources.

Problems solved by technology

Genes with scores greater than an adjustable threshold are deemed potentially significant.
Furthermore, factors inherent in the process of acquisition of the data analyzed may introduce noise that may mask changes or differences in gene expression, or cause genes to be erroneously identified as having changes of statistical significance.

Method used


Image

  • Significance analysis of microarrays
  • Significance analysis of microarrays
  • Significance analysis of microarrays

Examples


Embodiment Construction

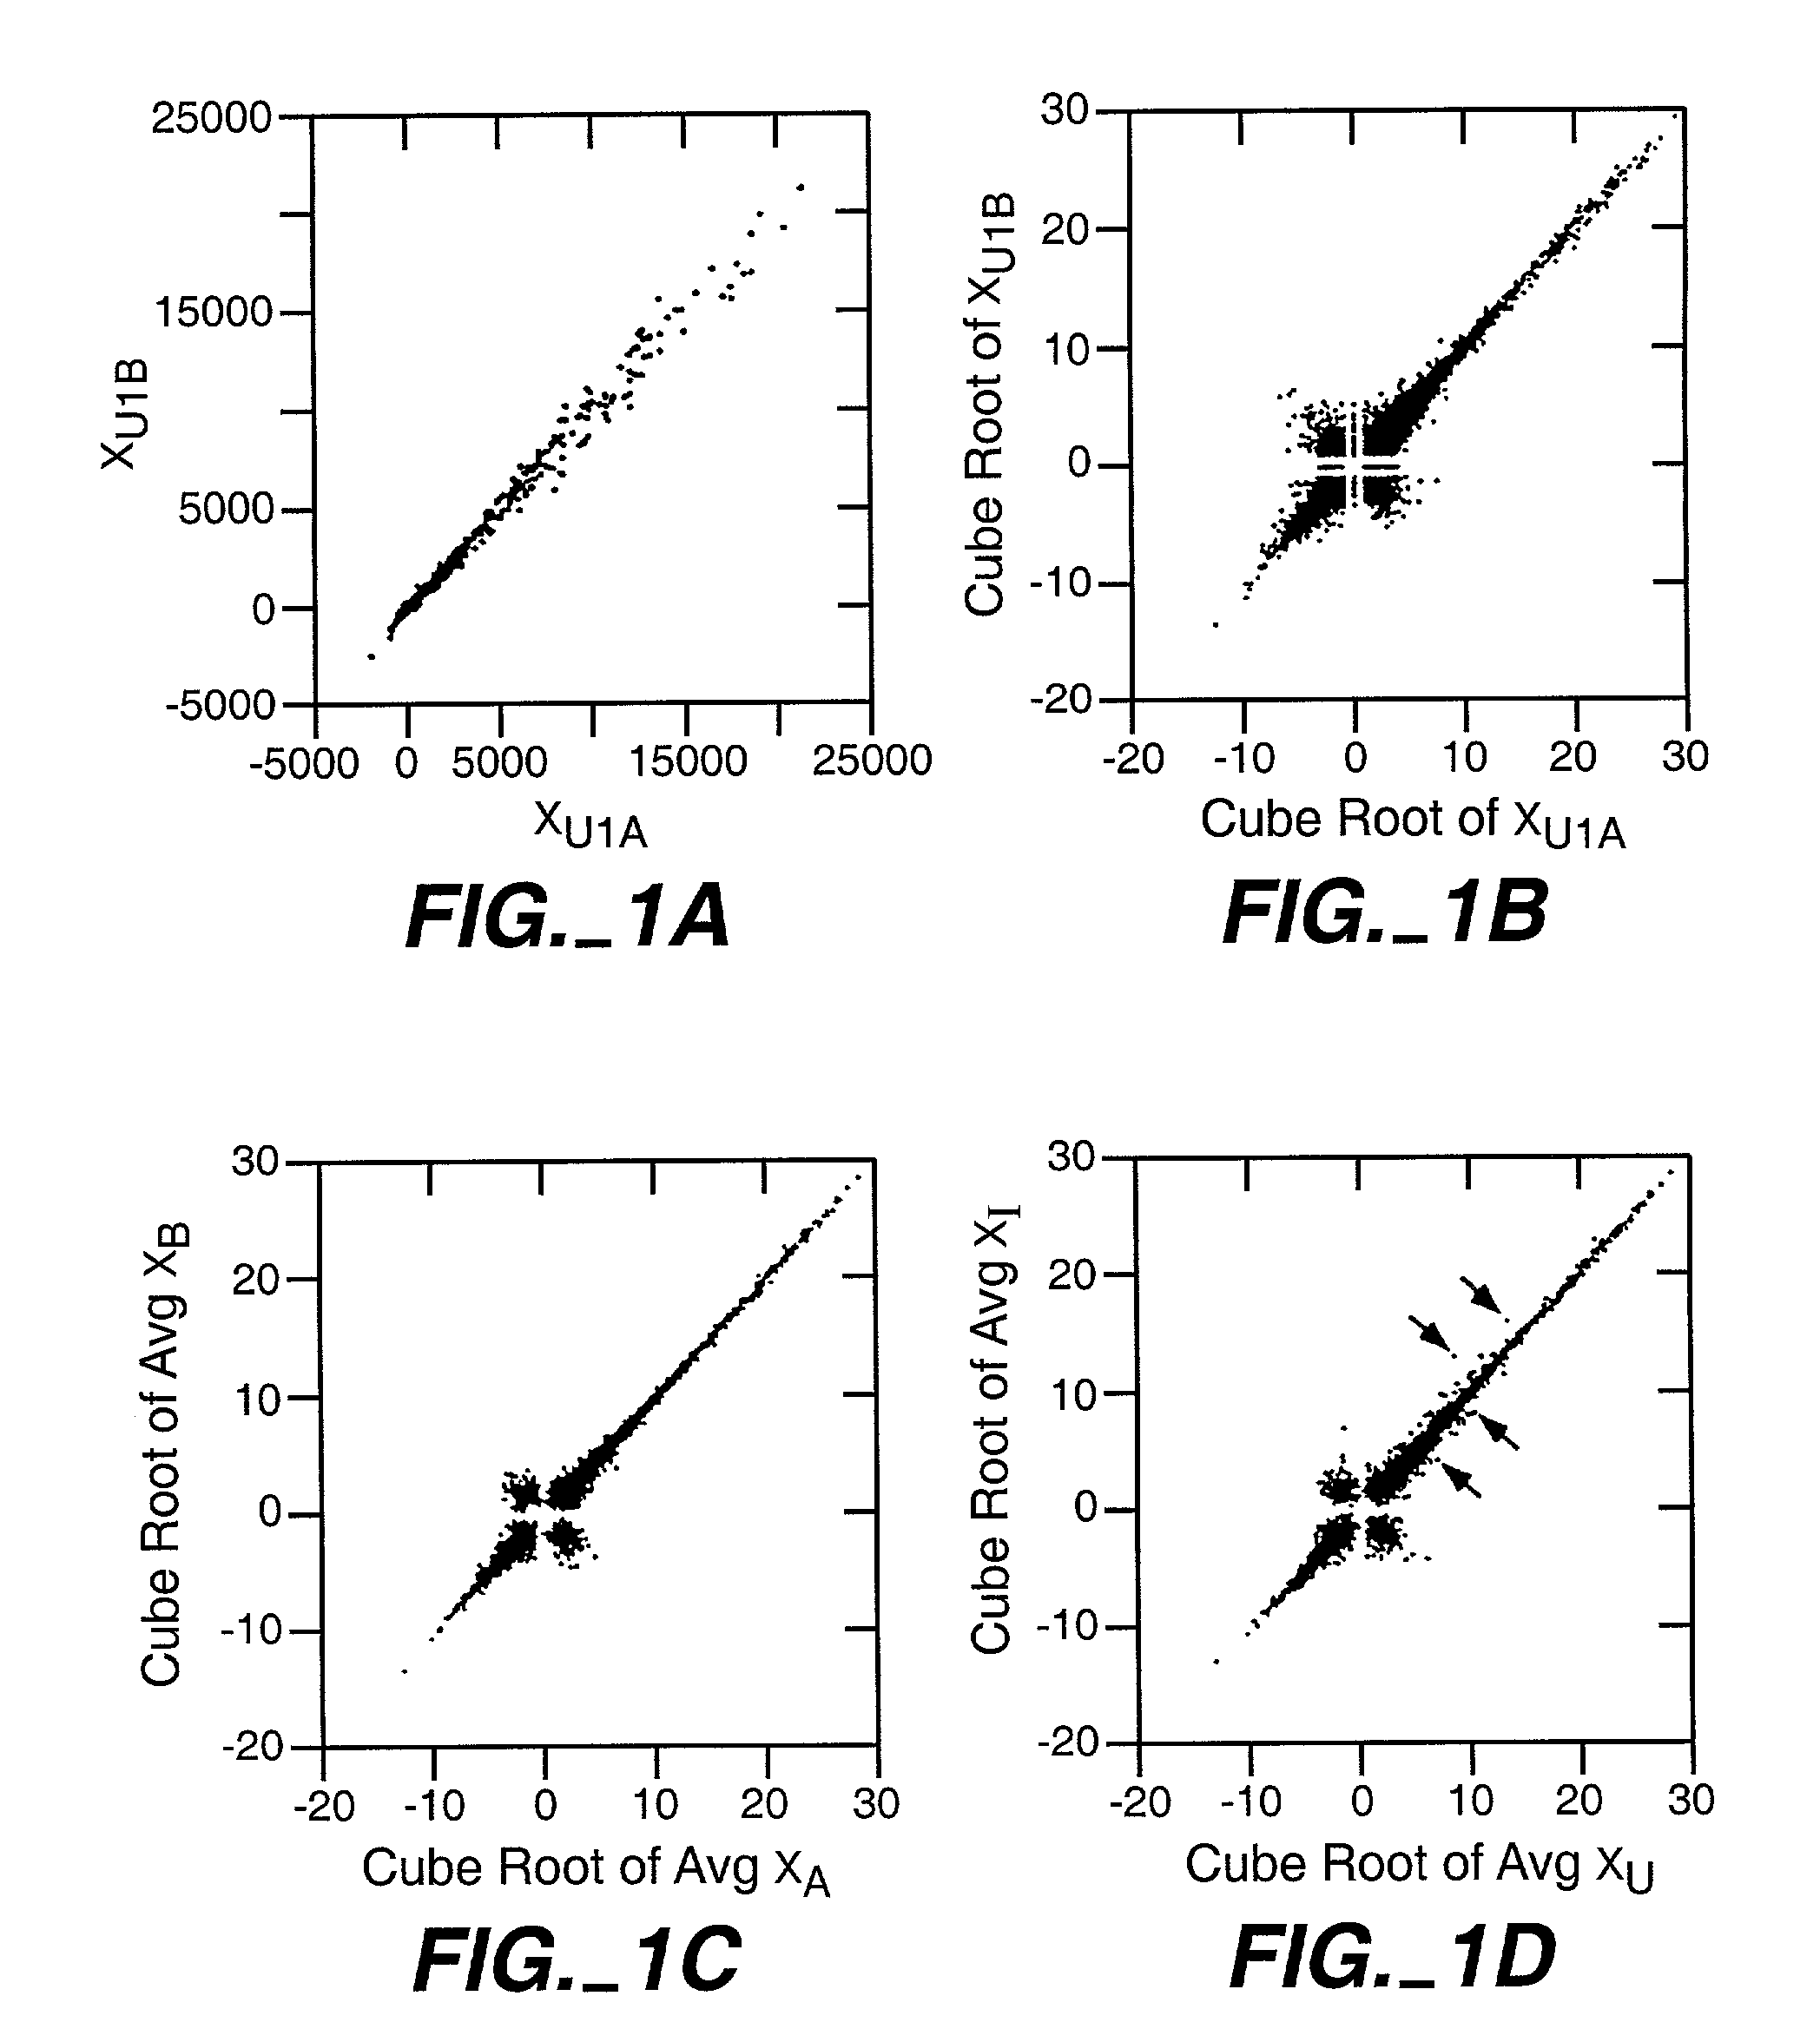
[0048]Because of its biological importance, SAM is applied to the transcriptional response of lymphoblastoid cells to ionizing radiation (IR). Although the data were obtained from oligonucleotide microarrays representing 6800 genes, SAM can also be applied to cDNA microarrays in a similar manner.

Materials and Methods Used in the Invention

[0049]Preparation of RNA. Lymphoblastoid cell lines GM14660 and GM08925 (Coriell Cell Repositories, Camden, N.J.) were seeded at 2.5×10⁵ cells / ml and exposed to 5 Gy 24 hours later. RNA was isolated, labeled and hybridized to the HuGeneFL GeneChip® microarray according to manufacturer's protocols (Affymetrix, Santa Clara, Calif.).

[0050]Microarray hybridization. Each gene in the microarray was represented by 20 oligonucleotide pairs, each pair consisting of an oligonucleotide perfectly matched to the cDNA sequence and a second oligonucleotide containing a single base mismatch. Because gene expression was computed from differences in hybridization to ...


PUM

PropertyMeasurementUnit
timeaaaaaaaaaa
densityaaaaaaaaaa
fluorescenceaaaaaaaaaa

Abstract

Microarrays can measure the expression of thousands of genes and thus identify changes in expression between different biological states. Methods are needed to determine the significance of these changes, while accounting for the enormous number of genes. We describe a new method, Significance Analysis of Microarrays (SAM), that assigns a score to each gene based on the change in gene expression relative to the standard deviation of repeated measurements. For genes with scores greater than an adjustable threshold, SAM uses permutations of the repeated measurements to estimate the percentage of such genes identified by chance, the false discovery rate (FDR). When the transcriptional response of human cells to ionizing radiation was measured by microarrays, SAM identified 34 genes that changed at least 1.5-fold with an estimated FDR of 12%, compared to FDRs of 60% and 84% using conventional methods of analysis. Of the 34 genes, 19 were involved in cell cycle regulation, and 3 in apoptosis. Surprisingly, 4 nucleotide excision repair genes were induced, suggesting that this repair pathway for UV-damaged DNA might play a heretofore unrecognized role in repairing DNA damaged by ionizing radiation.

Description

CROSS REFERENCE TO RELATED APPLICATION[0001]This application claims the benefit of U.S. Provisional Application Ser. No. 60 / 208,073, filed May 4, 2000, which is hereby incorporated by reference in its entirety for all purposes.BACKGROUND OF THE INVENTION[0002]This invention relates in general to statistical analysis of gene related data and, in particular, to analysis of microarray data for identifying genes that exhibit statistically significant behavior.[0003]Different biological systems are characterized by differences in the copy number of genes or in levels of transcription of particular genes. By measuring such biological phenomena, insight into and possible treatment of human diseases may be found.[0004]Microarrays of various types have been employed for measuring the expression levels of large numbers of genes. One type of microarray is the oligonucleotide microarray, one example of which is the Gene Chip® microarray manufactured by Affymetrix corporation of California. Inte...

Claims


Application Information

Patent Timeline
Patent Type & Authority Patents(United States)
IPC IPC(8): G06F19/00C12Q1/68G16B25/10
CPCG06F19/20C12Q2600/158G16B25/00G16B25/10
Inventor TUSHER, VIRGINIA GOSSTIBSHIRANI, ROBERTCHU, GILBERT
Owner THE BOARD OF TRUSTEES OF THE LELAND STANFORD JUNIOR UNIV
Why Eureka
Try Eureka