
System for evaluating price risk of financial product or its financial derivative, dealing system and recorded medium

a technology for evaluating price risk and financial products, applied in the field of system for assessing price risk of financial products or their financial derivatives, dealing systems and recorded media, can solve the problems of low probability of occurrence of big price changes, insufficient reliability of conventional techniques for evaluating risk for financial products or derivatives, and inability to provide reliable results. , to achieve the effect of removing defects or drawbacks

Inactive Publication Date: 2009-06-23
KK TOSHIBA
View PDF18 Cites 24 Cited by
  • Summary
  • Abstract
  • Description
  • Claims
  • Application Information

AI Technical Summary

Benefits of technology

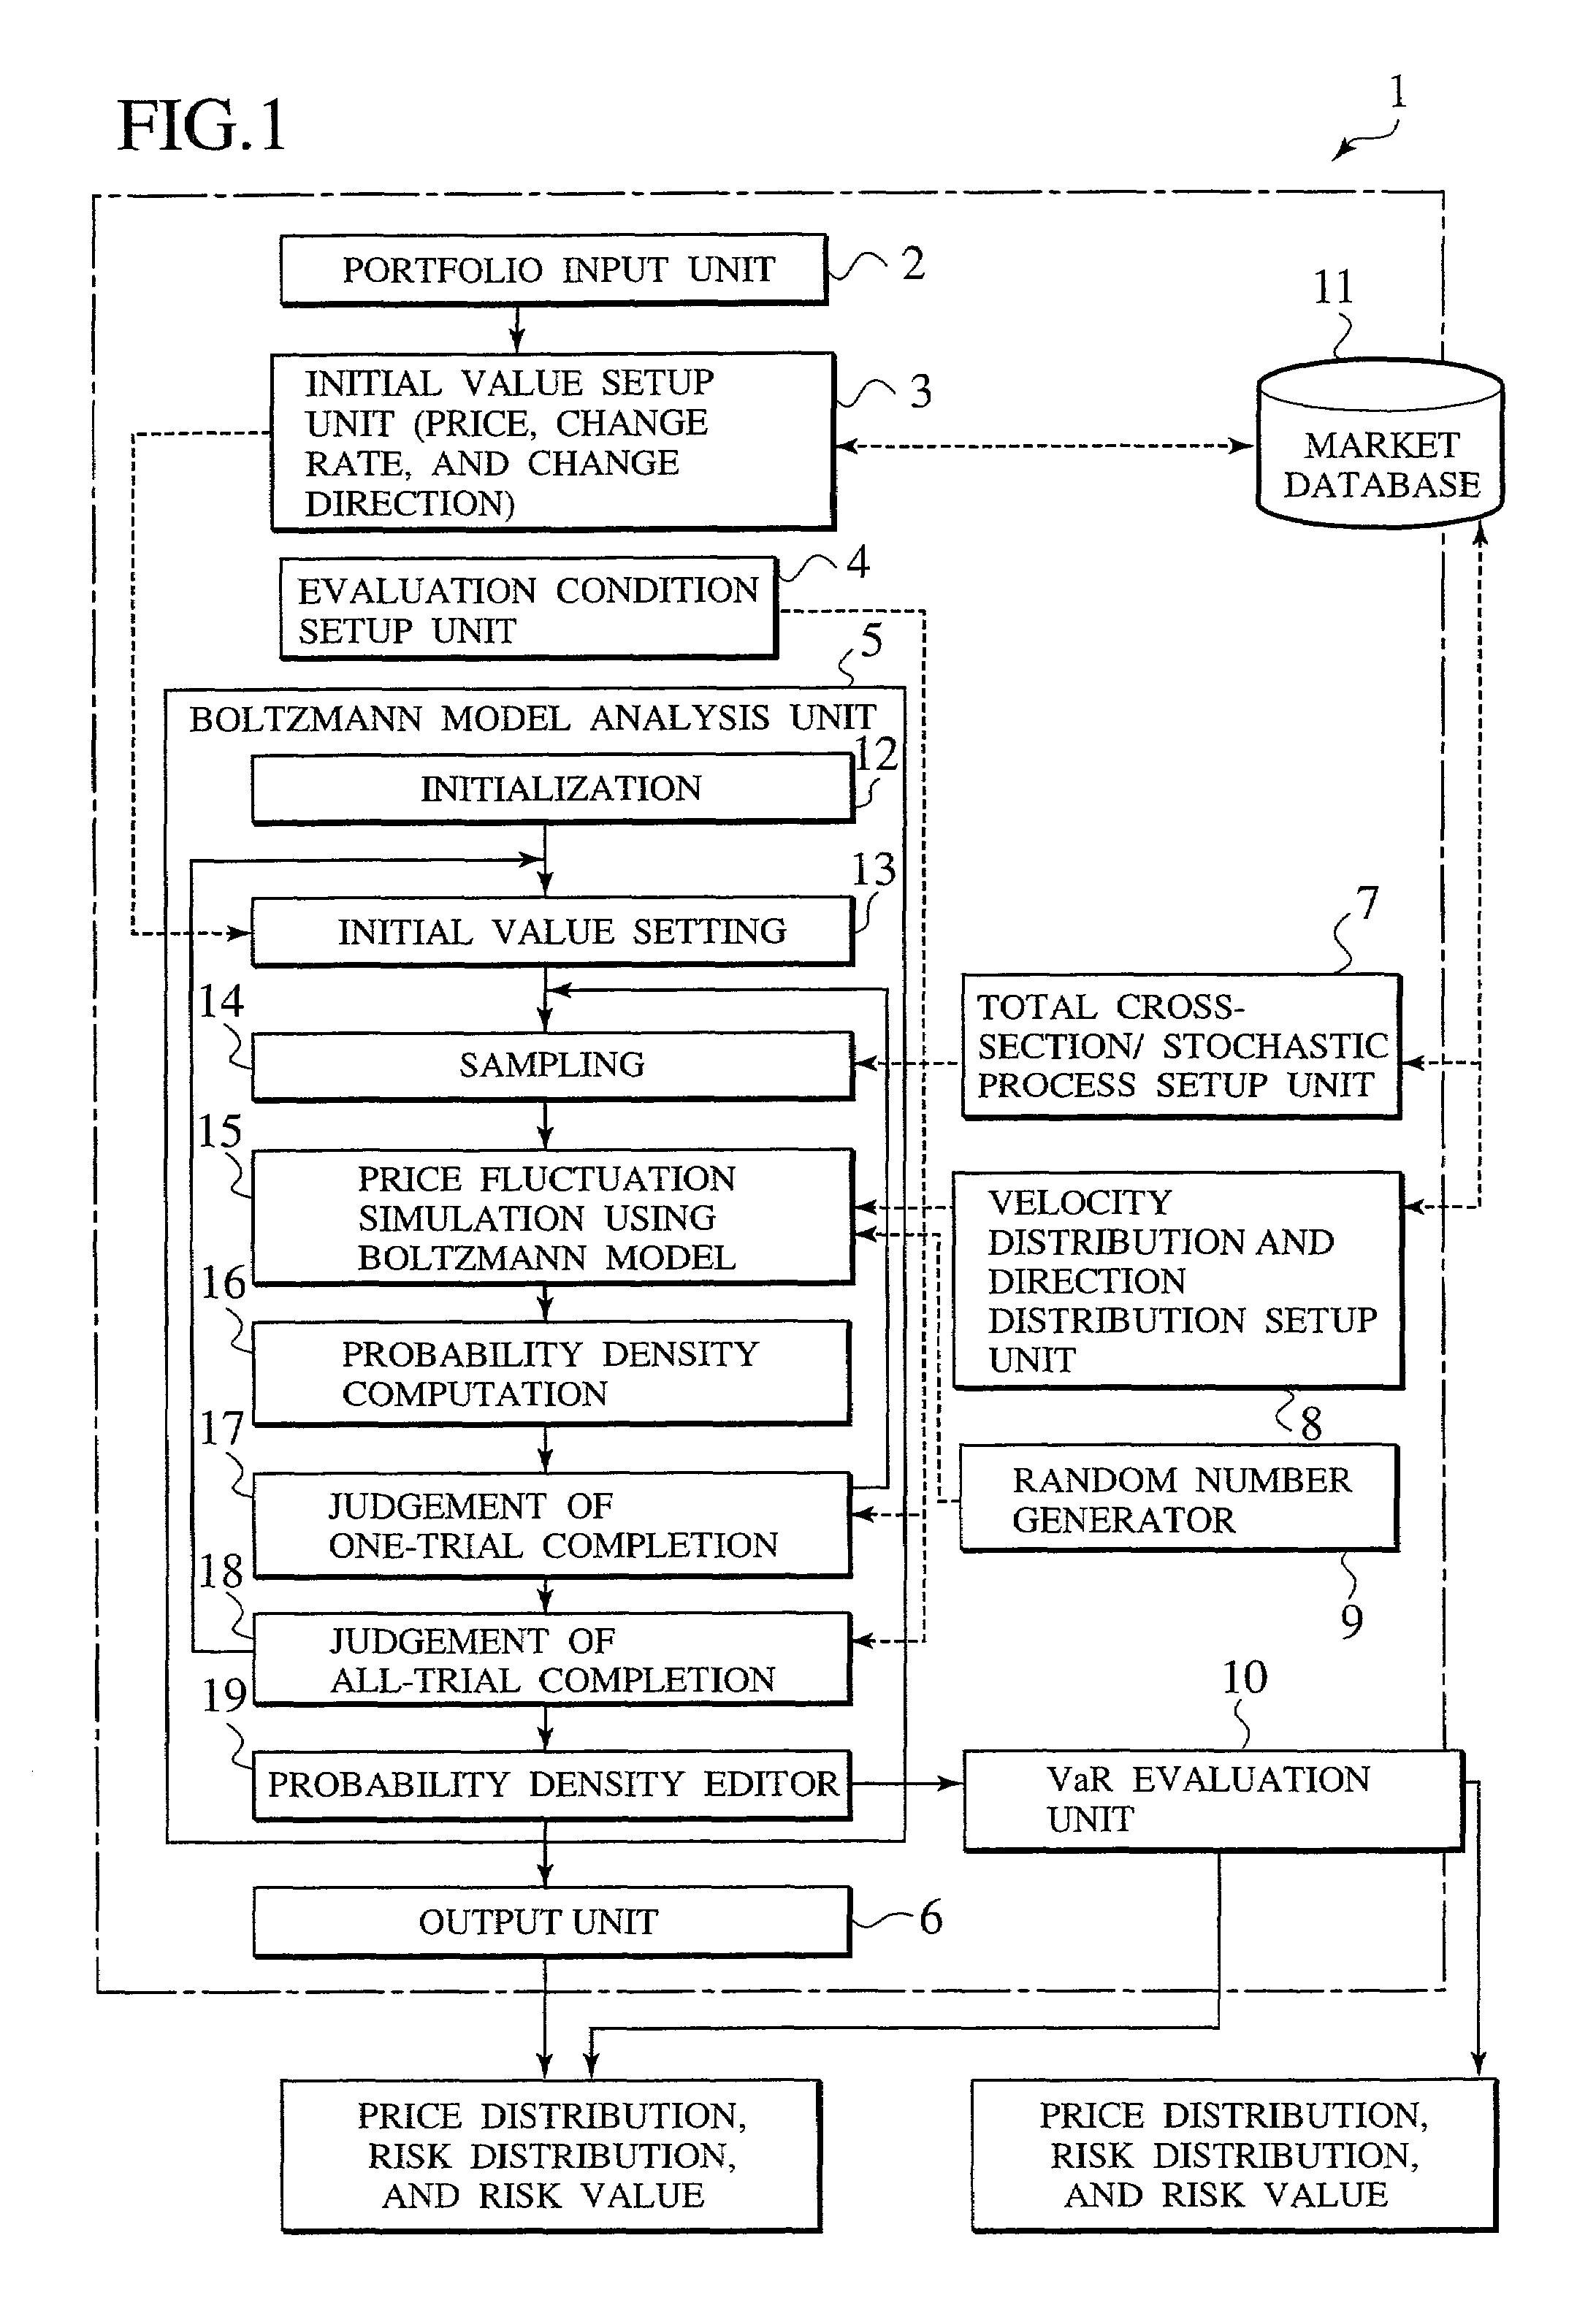
The present invention provides a price and risk evaluation system for financial products or their derivatives using a new calculation method. This system has an initial value setter and an evaluation condition setter, which allow users to input the initial values and evaluation conditions of the financial product. The system also includes a Boltzmann model analyzer that can accurately evaluate price or risk distribution for financial products or their derivatives. The system can also handle fat-tail problems and has a random number generator for generating probability distributions. The velocity / direction distribution setter receives past records of the financial product or its derivatives and generates a probability distribution for the price change rate and direction. The total cross-section / stochastic process setter sets the sampling time width of the simulation of price fluctuation. The system can also evaluate the price distribution or risk distribution of the financial product or its derivatives using a linear or non-linear Boltzmann model. The system reduces the variance of the price or risk by applying the point detector technique.

Problems solved by technology

However, the conventional technique for evaluating risks for the financial products or the derivatives is not capable of providing sufficiently reliable results, as is known in this field.
This is because that conventional method evaluates risks of financial products based on the Gaussian distribution, and therefore, the probability of occurrence of a big price change is underestimated.
Although the likelihood of occurrence of a big price change is low, such a big price change has a significant influence to investing risks, as compared with h situations under the normal price changes.
Accordingly, any risk evaluation methods or systems for financial products can not be reliable in the practical aspect unless the probability for the big price changes is accurately treated.
Another problem is that the conventional risk evaluation technique requires some corrections to a heterogeneous problem, in which the probability density function changes depending on prices, or to a non-linear problem, in which the probability density function used for the evaluation is a non-linear function.
Furthermore, the conventional risk evaluation technique has very limited capabilities for description, definition, and selection of the variables to produce price fluctuations observed in the markets.
In other words, with the conventional technique, the probability density function can not be sufficiently evaluated with variables for describing risks for financial products, if the actual price change distribution of an financial product is located out of the standard Gaussian-type distribution.
The conventional technique is not capable of describing the probability density function for the price change direction as well, and therefore, the probability distribution of the price change direction for the financial products are disregarded.
Further problems in actual application of the conventional risk evaluation method for financial products relate to insufficient numerical techniques, such as random number sampling and variance reduction areas for making Monte Carlo calculations.
Consequently, undesirable variance inevitably remains in the conventional technique.
However, the conventional dealing systems have many problems listed below in item (1) through (8).
Once if this fact would be introduced from the early state, evolution theoretical financial engineering deployment and implementation to a computer system would have become much more difficult in actual application.
However, these methods have drawbacks in actual application for some reasons.
For example, if transaction is not active enough, there is no continuity in the movement for the price of the underlying assets.
Even in the case that the transaction is active, the conventional methods are not suitable to estimate the volatility under the fat-tailed regime because these methods assume normality in the risk probability distribution for the market behaviors.
However, in a non-active market (for instance, the option transaction market for underlying assets in the current Japanese security market), as the number of observed transactions for options is small, the implied volatility for the corresponding options cannot be well-defined from the actual market data.
On the other hand, in some cases that under the transactions in moderately active market, the option prices observed in the market are scattered in a wide range, it becomes difficult to grasp a comprehensive trend.
However, because these models assume normality in the probability distributions, they can not deal with the Fat-Tail problem sufficiently.
Therefore, this technique is not suitably used in a non-active option market.
However, the jump model has an assumption of discontinuous price fluctuation, and therefore, the stochastic volatility model (SVM) naturally becomes a nonlinear problem.
For this reason, the risk-neutral measure can not be achieved invariably, which prevent the option price from being defined uniquely.
(8) In conclusion, no conventional techniques can provide minute and accurate information in real time for solving the Fat-Tail problem and being applicable to a non-active market, although it has been desired for dealers and traders to receive significant smile curves or a volatility matrix on their displays in real time in response to the actual market that changes every moment.
The conventional technique is incapable of automatically acquiring necessary data required for computation in response to requests from the dealers in an interactive manner, and of automatically selecting the optimum model to analyze the market deeply and flexibly.

Method used


Image

  • System for evaluating price risk of financial product or its financial derivative, dealing system and recorded medium
  • System for evaluating price risk of financial product or its financial derivative, dealing system and recorded medium
  • System for evaluating price risk of financial product or its financial derivative, dealing system and recorded medium

Examples


example 1

r=0.05, σ2=0.11, and T=0.25 year

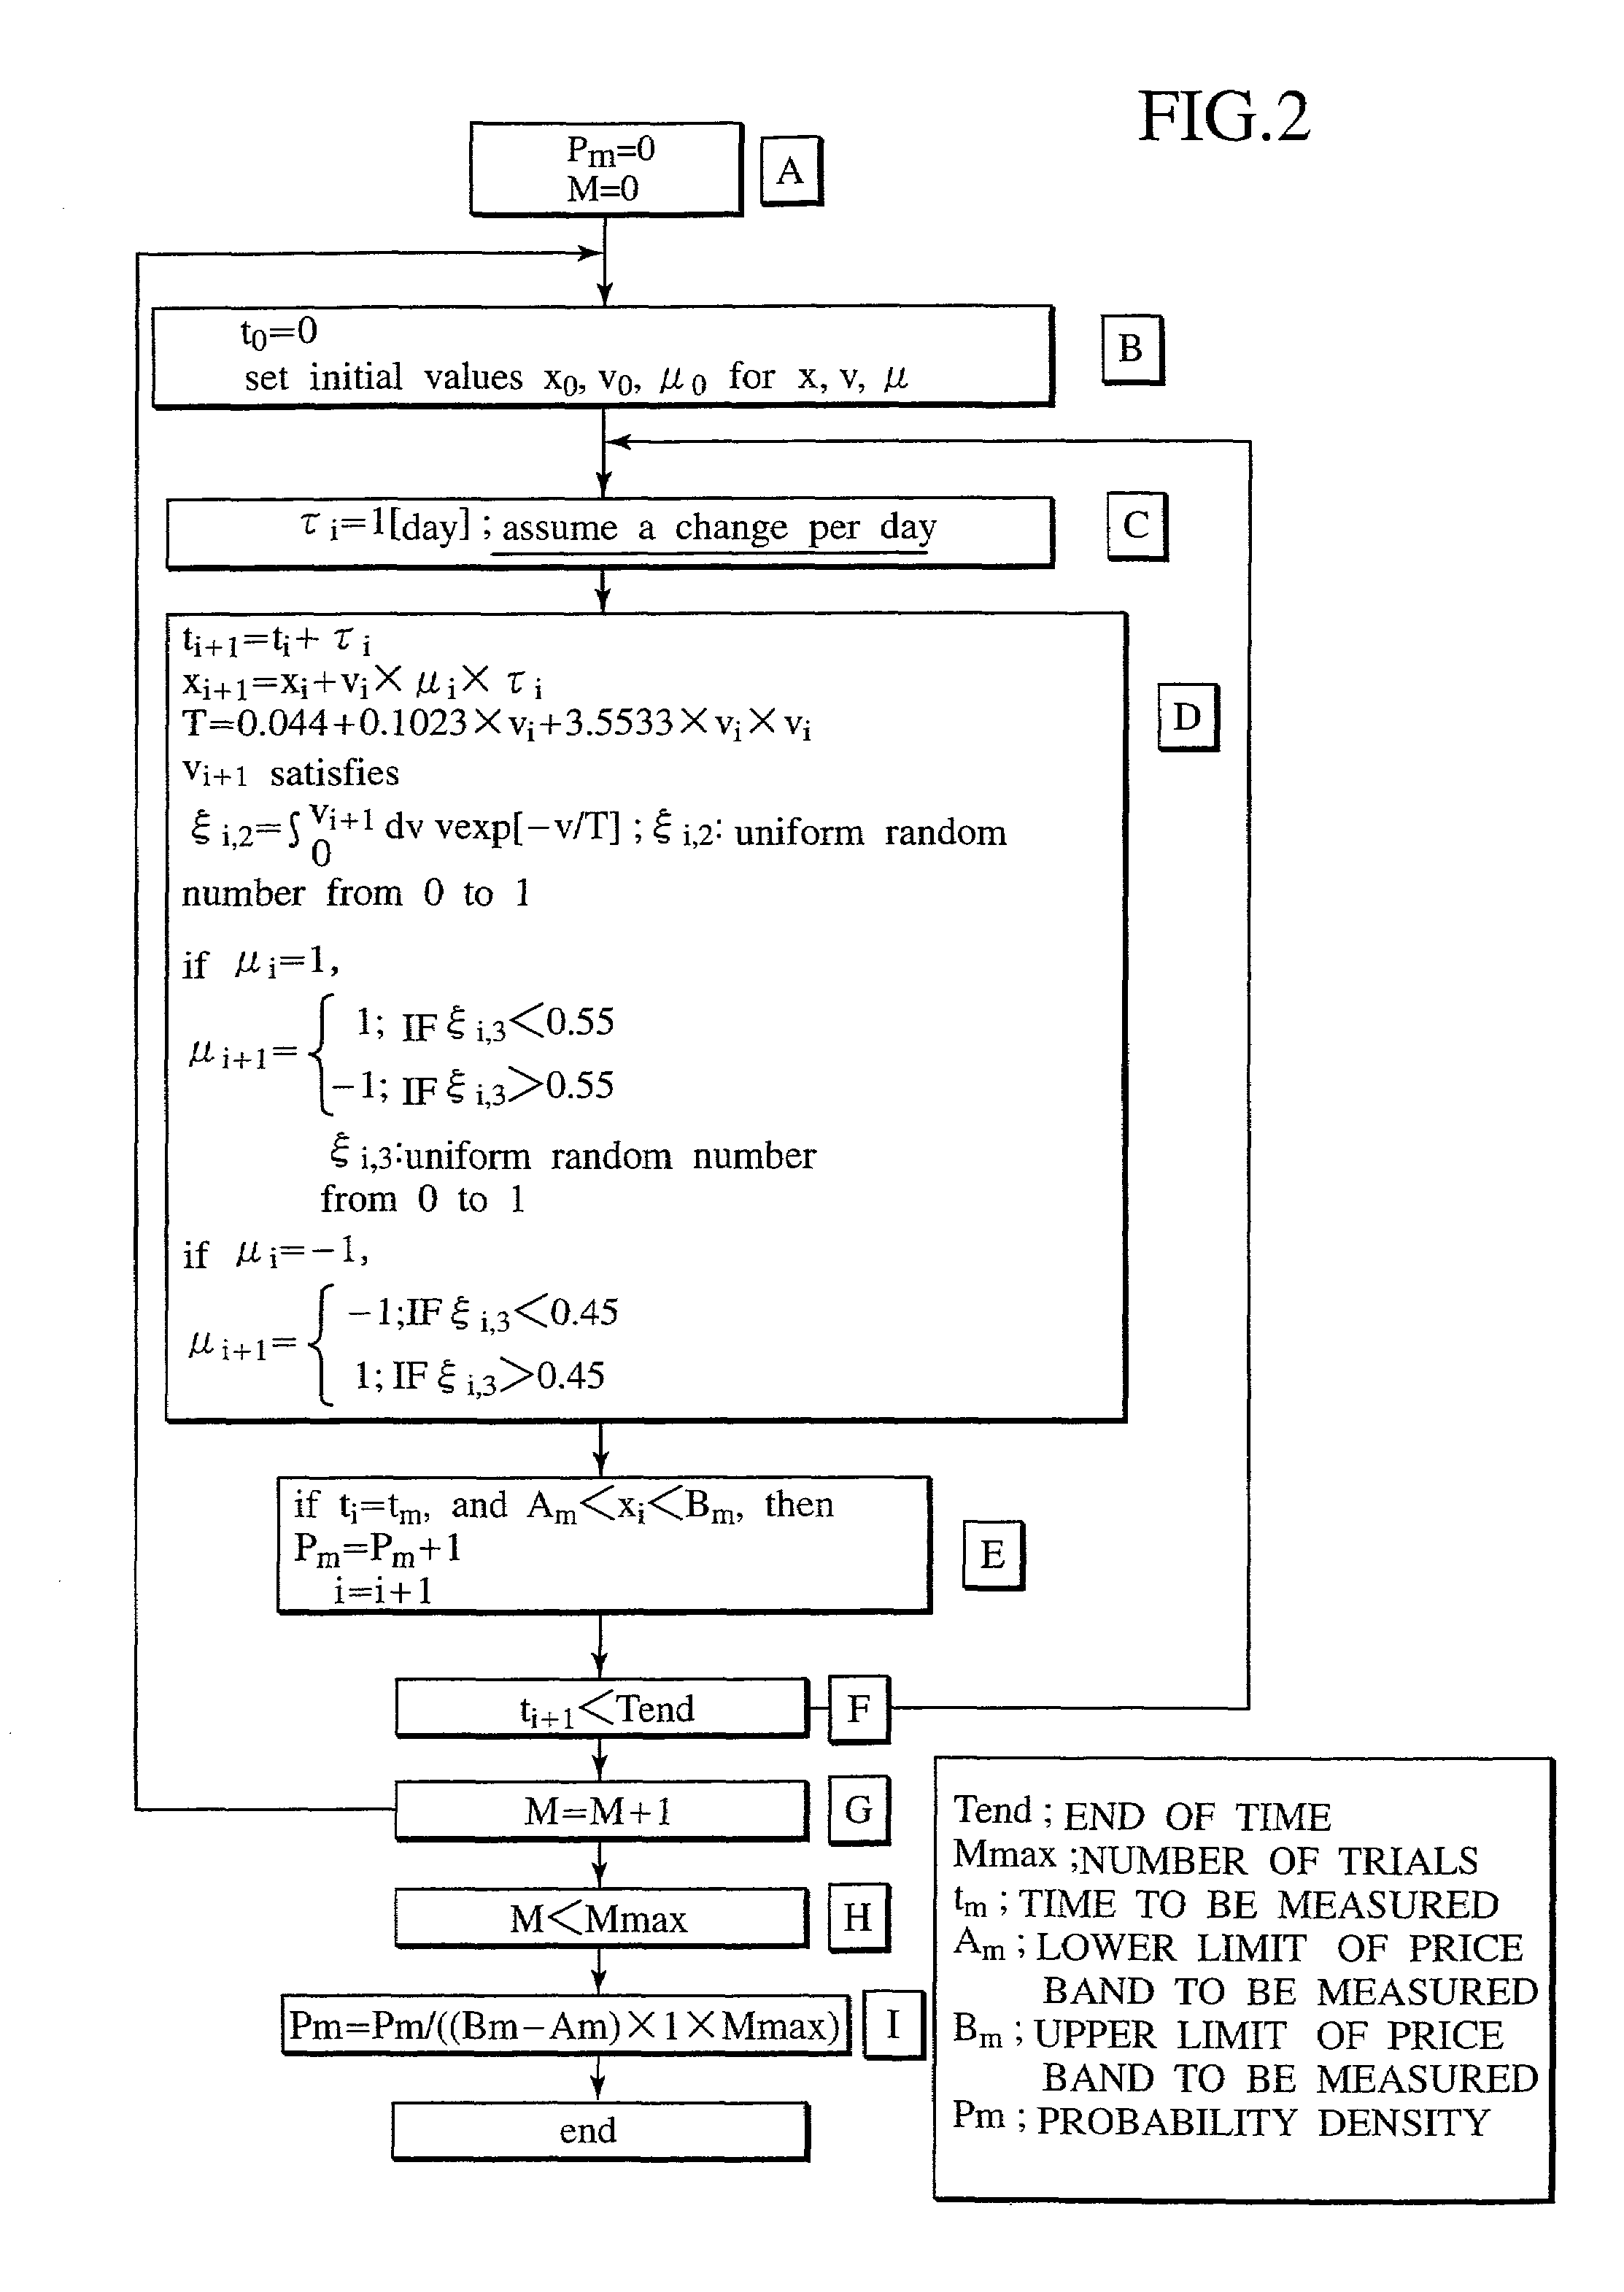
[0275]The lower and upper limits Am and Bm of x (price) shown in the flowchart of FIG. 3 define a price band, which is determined by dividing the range of −3σ≦x≦3σ(δx=0.1σ) by 60. The lower limit Cm and the upper limit Dm of time t define a time band, where Cm equals 0.25 [years] and Dm equals Cm+( 1 / 365) [years]. An evaluation quantity ω1 is 1.

[0276]FIG. 6 shows the evaluation result of example 1 using the solid line 22 in comparison with the theoretical distribution (i.e., the logarithmic normal distribution) indicated by the dashed line 21. As is clear from FIG. 6, the simulation result of the present invention indicated by the solid line 22 is almost coincident with the theoretical distribution 21.

example 2

σ2=0.1, r=0.05 and r=0

[0277]The lower and upper limits Am and Bm of x shown in the flowchart of FIG. 3 are set to Am =−∞ and Bm =+∞. The time band defined by Cm and Dm are from 0 to 365 [day] with δt=1 [day]. The evaluation quantity ωi is x. In FIG. 7, the dashed line 23 indicates the theoretical distribution 23 under a drift, and the long dashed line 24 indicates the theoretical distribution 24 without a drift. The simulation results 25 and 26 obtained in example 2 substantially reproduce the theoretical distributions with and without a drift.

[0278]The velocity distribution and the direction distribution used in the above-explained simulation are the probability distribution same as the standard Gaussian distribution. Consequently, the probability density obtained by the simulation becomes equivalent to that of the diffusion model.

[0279]In order to realize the Boltzmann model, the velocity distribution and the direction distribution must be evaluated.

[0280]An example of how to eval...


PUM


Abstract

A system for correctly evaluating price distribution and risk distribution for a financial product or its derivatives introduces a probability density function generated with a Boltzmann model at a higher accuracy than the Gaussian distribution for a probability density. The system has an initial value setup unit and an evaluation condition setup unit. Initial values include at least one of price, price change rate, and price change direction of a financial product. The evaluation conditions include at least time steps and a number of trials. A Boltzmann model analysis unit receives the initial values and the evaluation conditions, and repeats simulations of price fluctuation, based on the Boltzmann model using a Monte Carlo method. A velocity / direction distribution setup unit supplies probability distributions of the price, price change rate, and price change direction for the financial product to the Boltzmann model analysis unit. A random number generator for a Monte Carlo method is employed in the analysis by the Boltzmann model, and an output unit displays the analysis result. A dealing system applies the financial Boltzmann model to option pricing, and reproduces the characteristics of Leptokurcity and Fat-tail by a linear Boltzmann equation to define risk-neutral and unique probability measures. Consequently, option prices can be evaluated in a risk-neutral and unique manner, taking into account Leptokurcity and Fat-tail of a price change distribution.

Description

FIELD OF THE INVENTION[0001]The present invention relates to a system for assessing a price distribution or a risk distribution for a financial product or its derivatives, which can rigorously evaluate a price distribution or a risk distribution, including a probability of occurrence of a big price change, based on a Boltzmann model. This system is also capable of analyzing price fluctuation events for the financial product or its derivatives that could not be reproduced by the conventional technique.[0002]The present invention also relates to a dealing system used in the financial field.[0003]The present invention further relates to a computer-readable recording medium storing a price and risk assessing program for a financial product or its derivatives, and to a computer-readable recording medium storing a dealing program.TECHNOLOGICAL BACKGROUND[0004]A technique for analyzing past records of price change in a financial product or its derivatives and for stochastically obtaining a...

Claims


Application Information

Patent Timeline
Patent Type & Authority Patents(United States)
IPC IPC(8): G06Q40/00
CPCG06Q40/06G06Q40/08
Inventor UENOHARA, YUJIYOSHIOKA, RITSUOONISHI, MOTOHIKOTATSUMI, TAKAHIROOHASHI, TADAHIROKAWASHIMA, MASATOSHIOKUDA, HIROAKI
Owner KK TOSHIBA
Learn More