Techniques for graphical analysis and manipulation of circuit timing requirements

a technology of circuit timing and graphical analysis, applied in the direction of 2d-image generation, instruments, generating/distributing signals, etc., can solve the problem that TM ii does not allow a user to easily determine if he is a user, and achieves the effect of accurate timing data, easy visualization of relationship between different signals, and easy extraction of relevant timing data

Inactive Publication Date: 2009-08-25
ALTERA CORP
View PDF11 Cites 31 Cited by
  • Summary
  • Abstract
  • Description
  • Claims
  • Application Information

AI Technical Summary

Benefits of technology

[0011]Waveforms of signals propagating through a circuit design can be displayed on the interactive graphical user interface. Time points on the waveforms are marked on the graphical interface with pointers so that users can easily visualize the relationships between different signals.
[0012]Because the user interface of the present invention is interactive, users can easily extract relevant timing data and modify requirement parameters from the EDA tool by manipulating the graphical interactive user interface. For example, a user can move pointers to time points on the waveforms in the graphical user interface to change timing parameters relating to the signals. The present invention allows the user to clarify his requirements based on a better unde

Problems solved by technology

User constraints may include timing constraints.
Quartus™ II also does not allow a user to easily determine if he is analy

Method used


Image

  • Techniques for graphical analysis and manipulation of circuit timing requirements
  • Techniques for graphical analysis and manipulation of circuit timing requirements
  • Techniques for graphical analysis and manipulation of circuit timing requirements

Examples


first embodiment

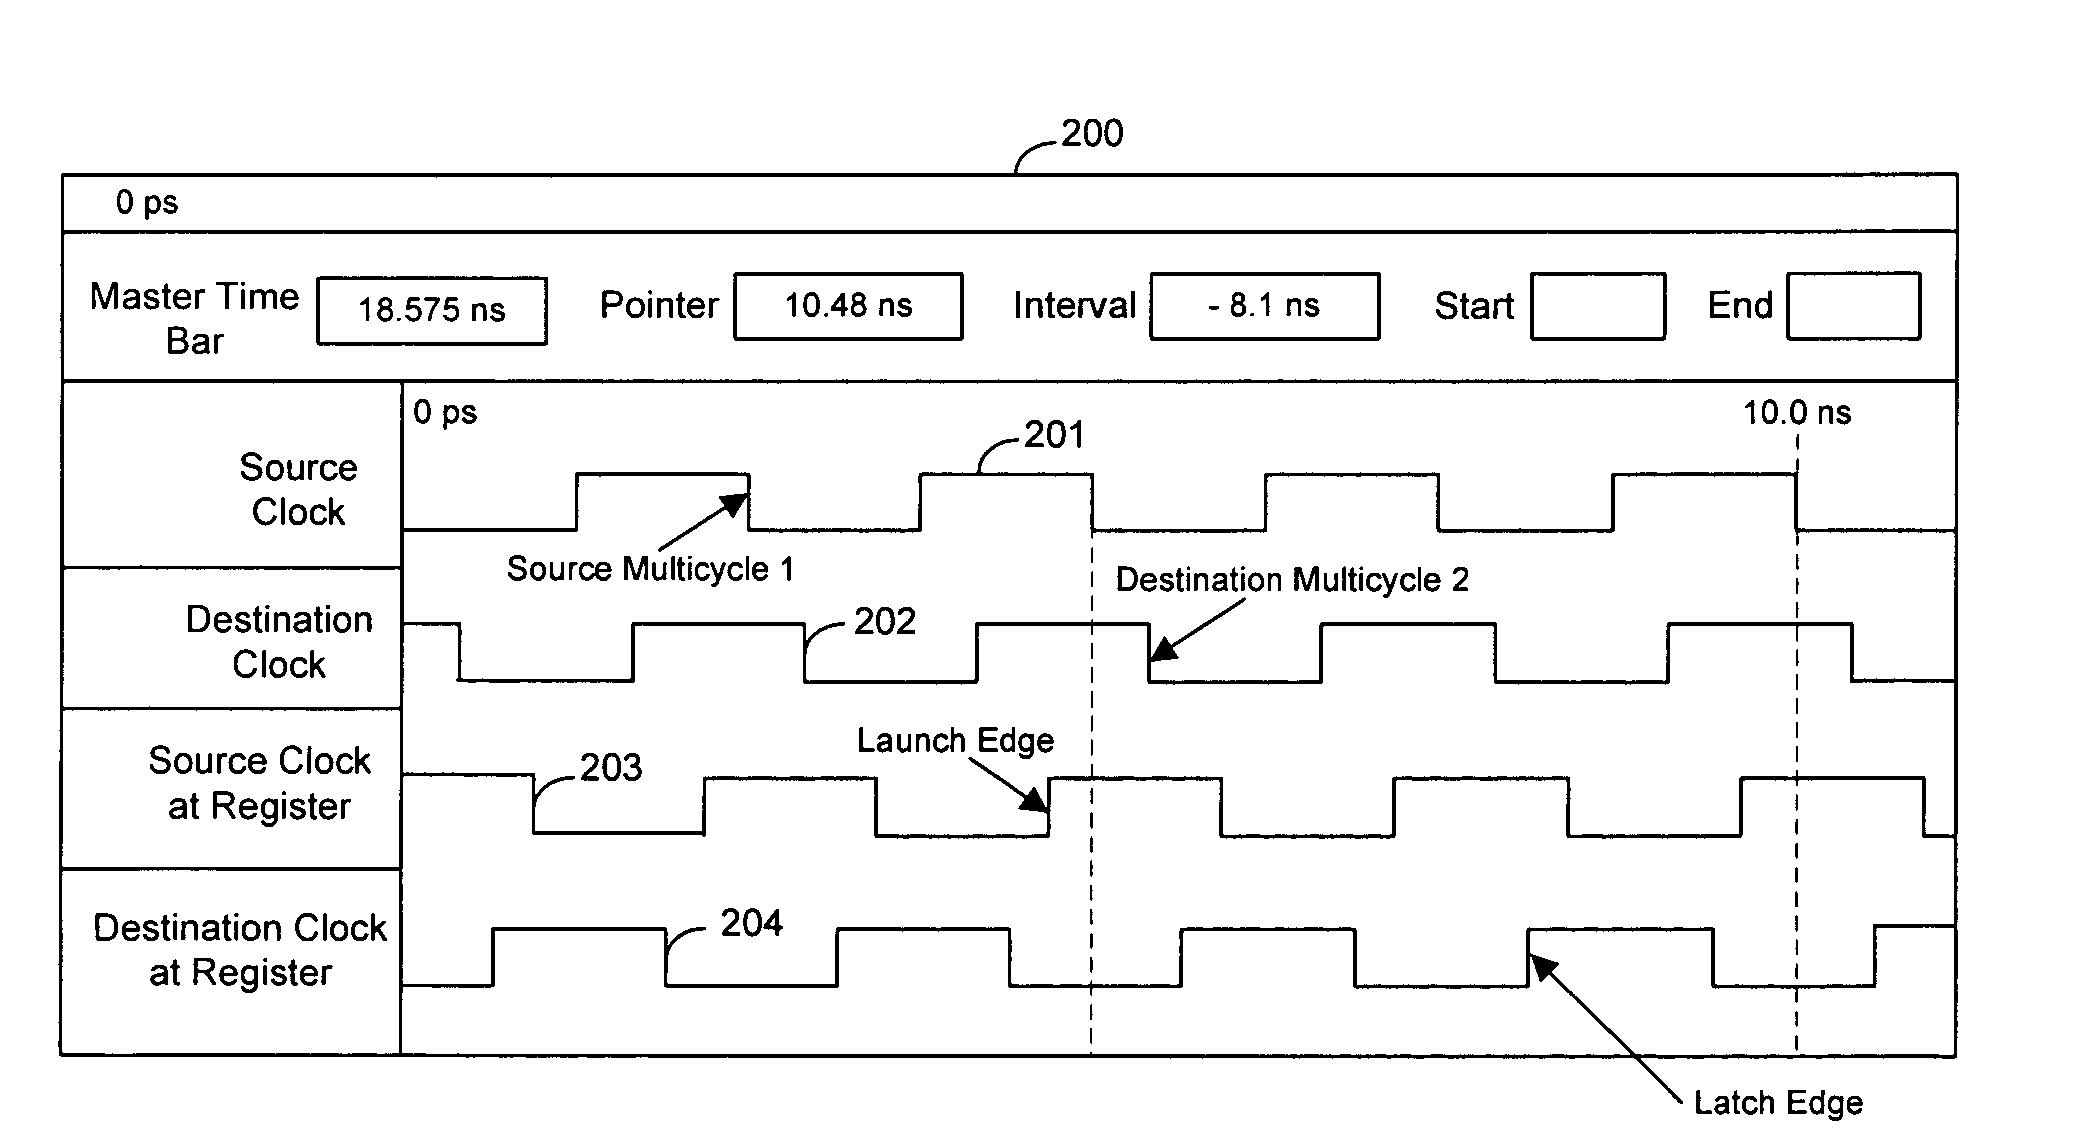
[0062]The present invention can determine the portions of the relevant waveforms to display in the graphical user interface (e.g., interface 200) using a variety of techniques. A first embodiment is now discussed in detail. Each of the waveforms for the relevant signals are displayed across the same time interval. The start time for this time interval is selected by determining the earliest event of interest.

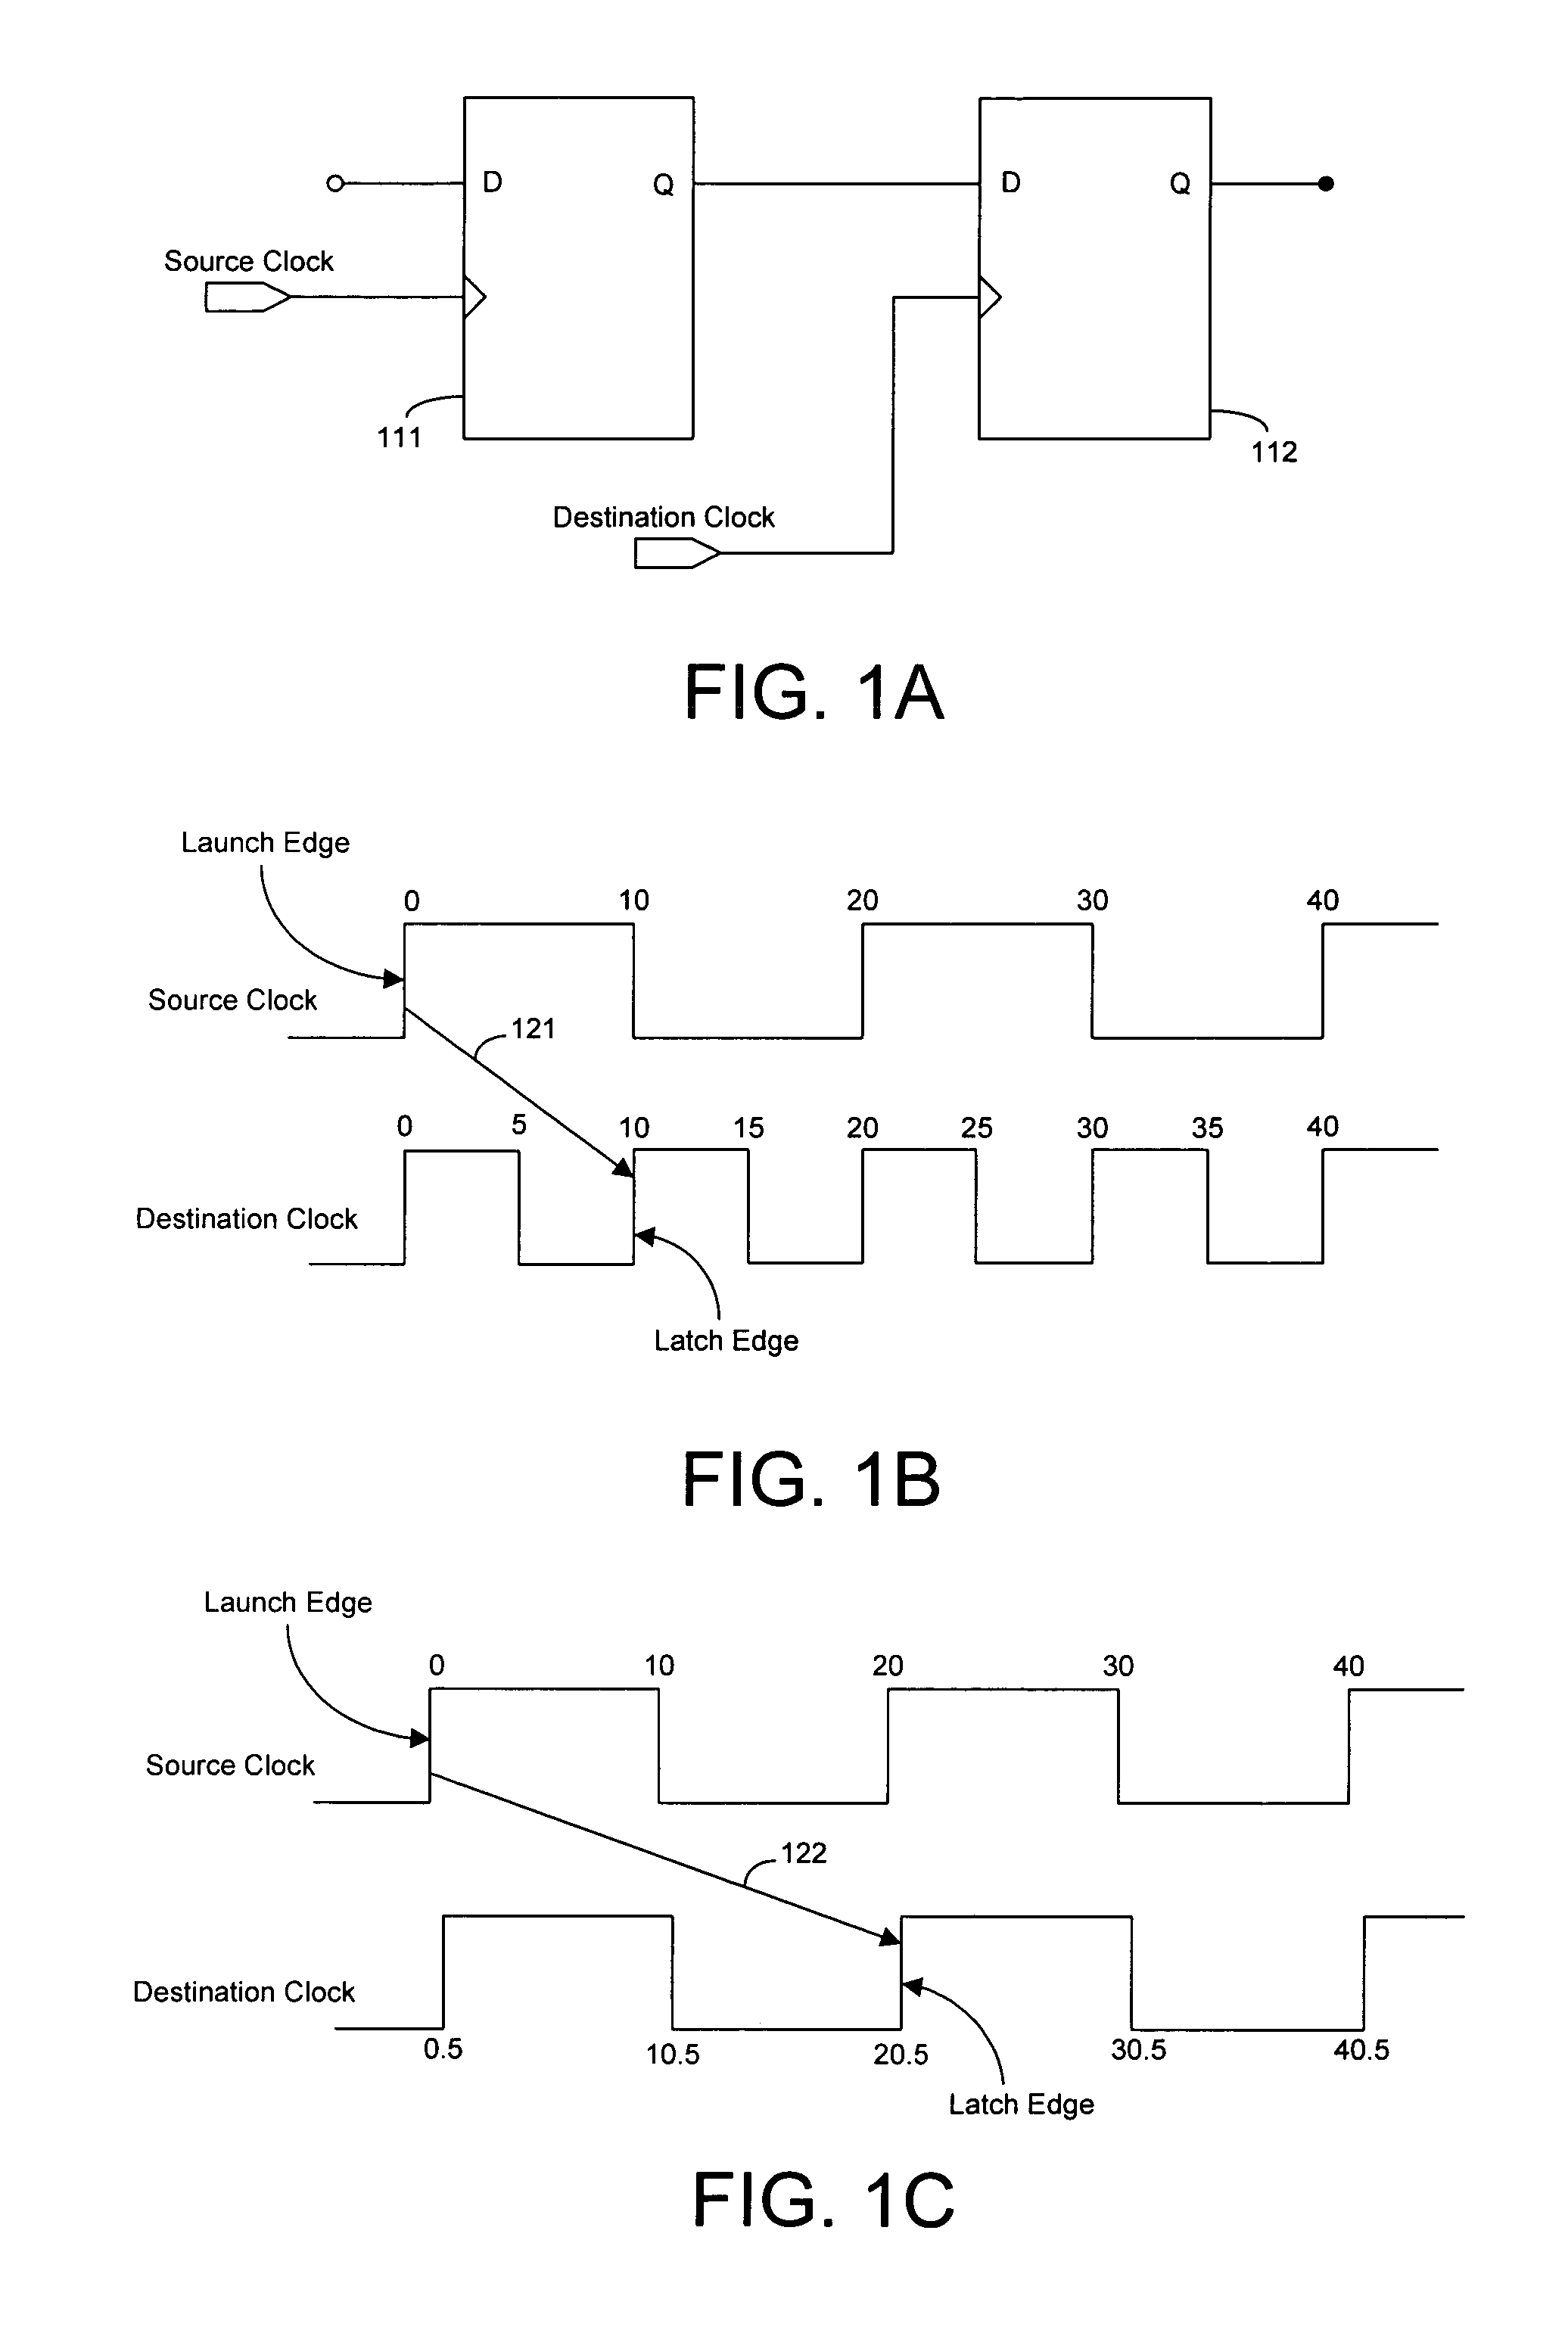
[0063]Using the example discussed with respect to FIG. 1, the earliest event of interest can be selected to be one full Source Clock period before the launch edge or one full Destination Clock period before the launch edge. The earliest event of interest is the earlier of these two points in time.

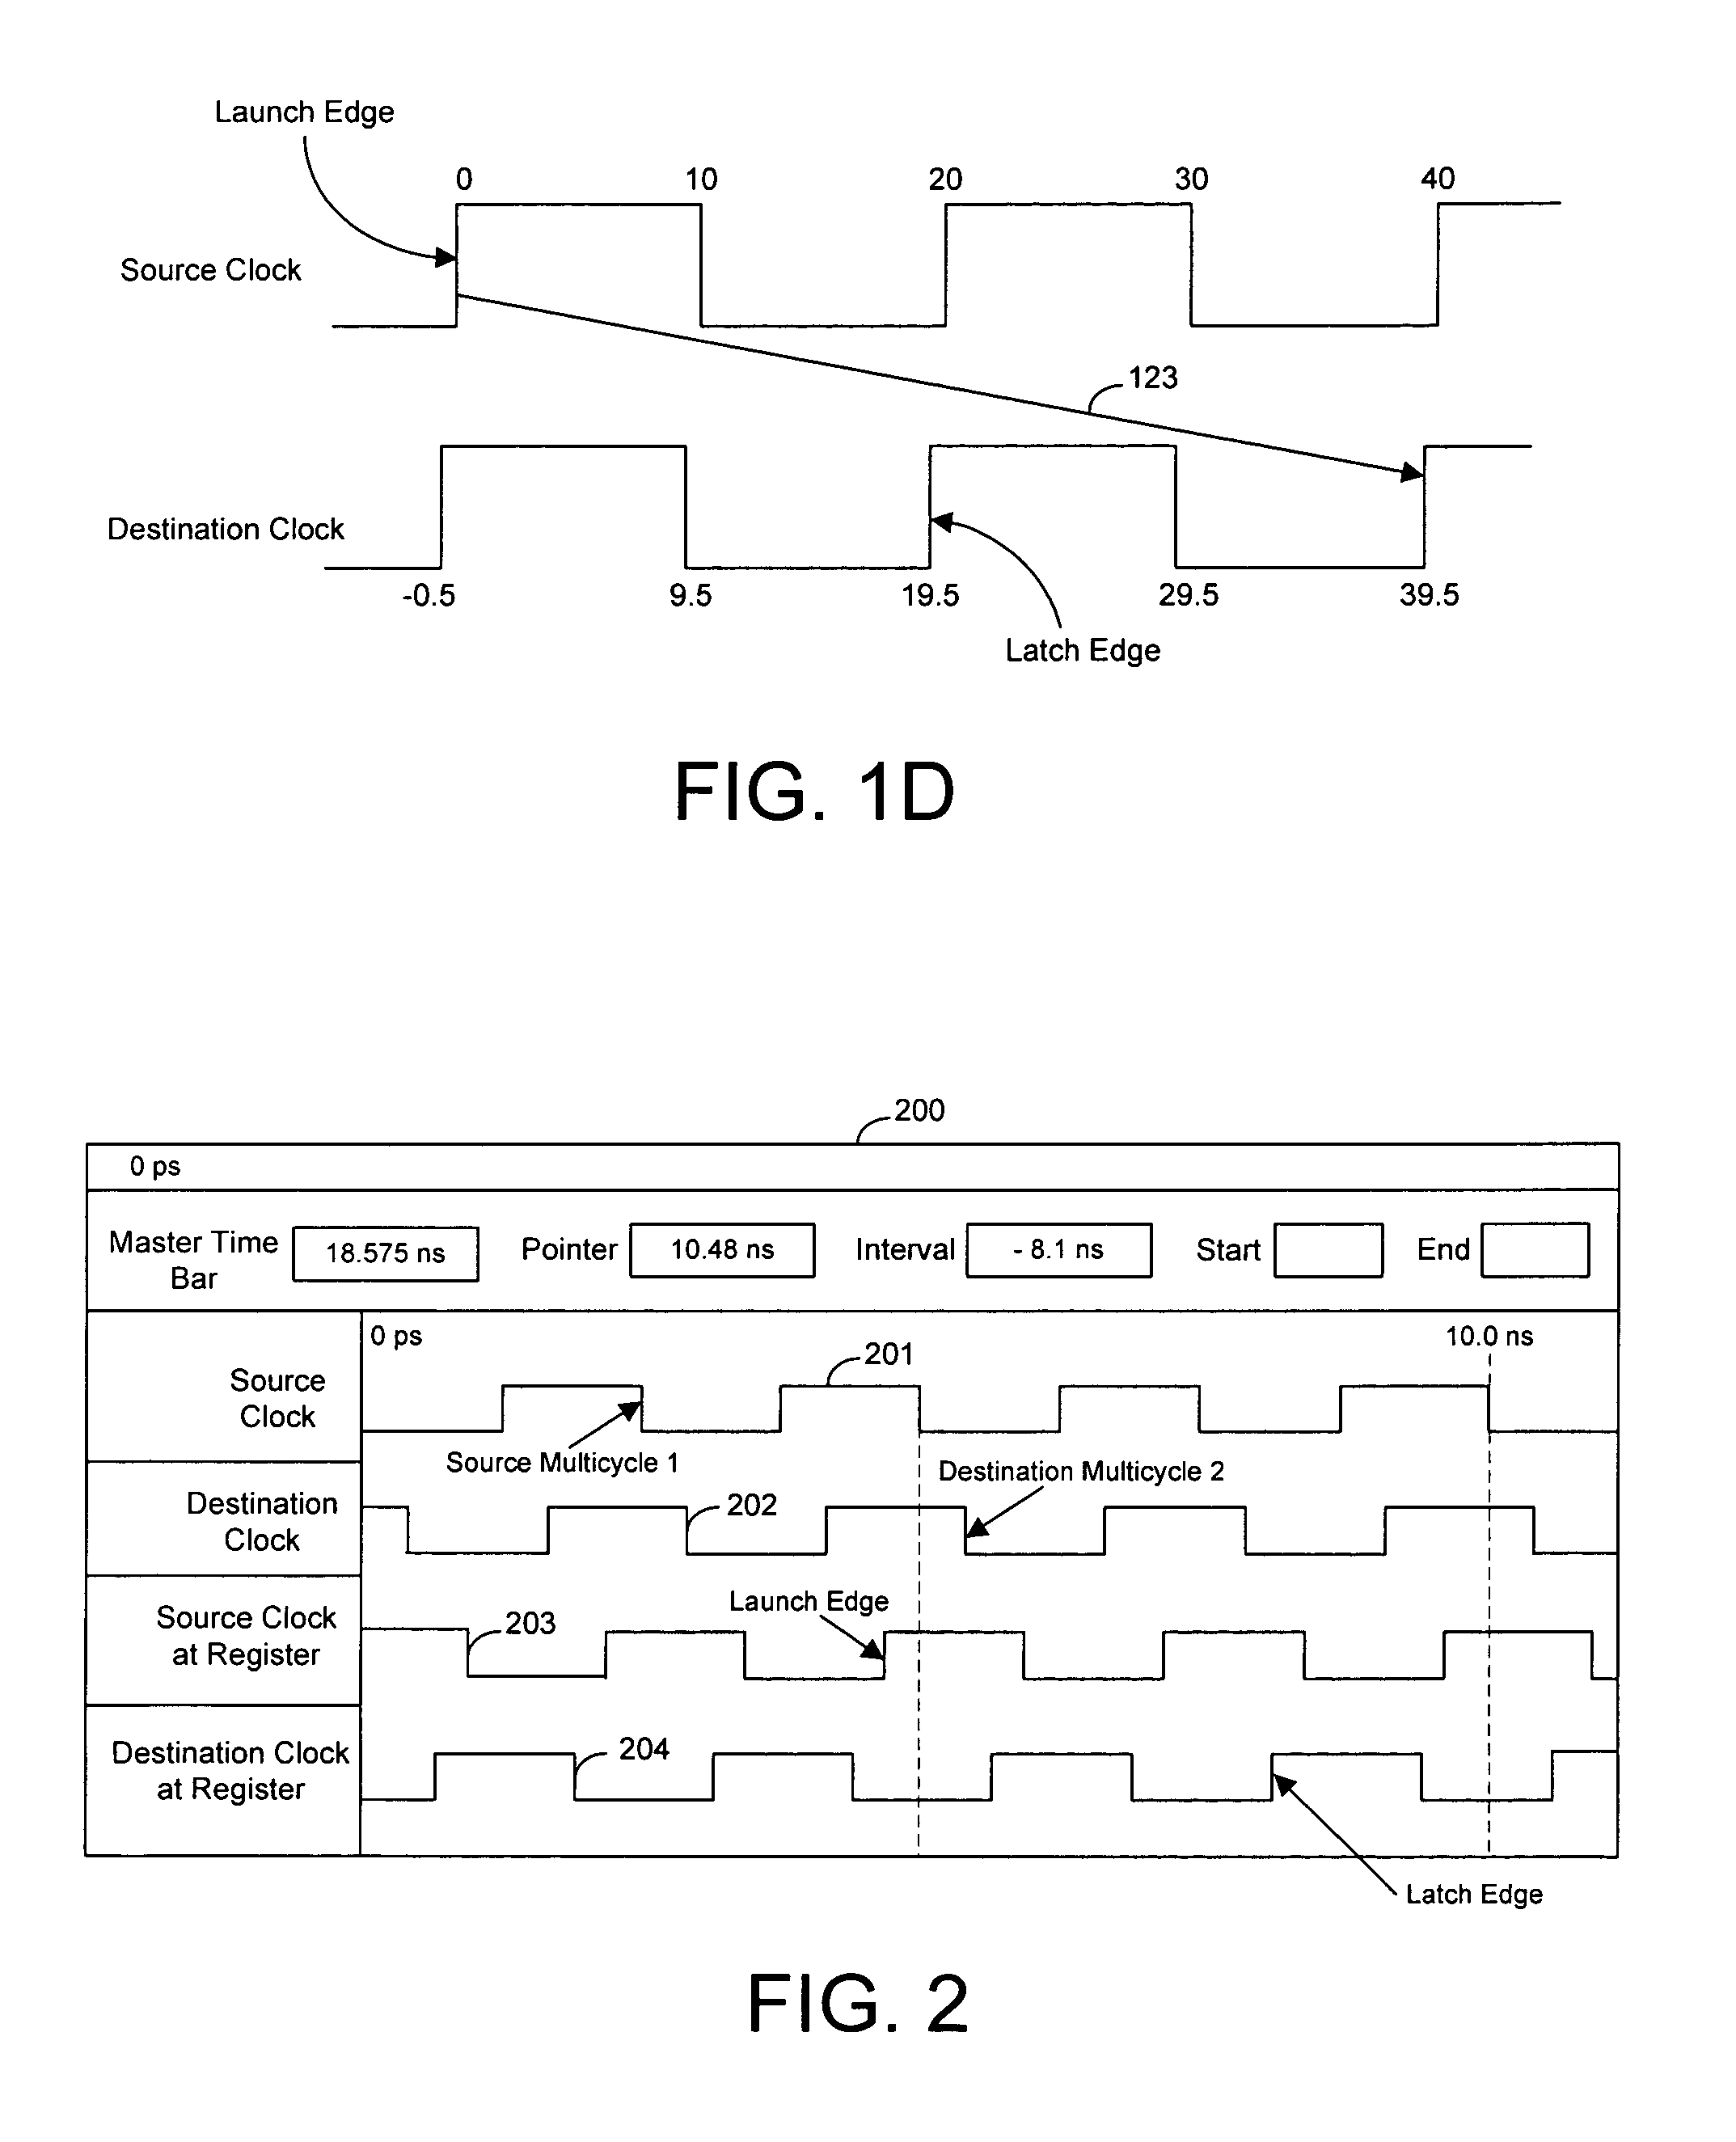
[0064]The end time for the time interval displayed in the graphical user interface is selected by determining the latest event of interest. The latest event of interest is selected to be one full Source Clock period after the launch edge or one full Destination Clock period before the l...

second embodiment

[0085]A user can also add or delete an inversion between a clock signal at its source and the same clock signal at a circuit element. In one embodiment, moving arrow 401 to a falling edge causes the inversion in Destination Clock to be automatically deleted. In another embodiment, moving arrow 401 causes the present invention to automatically move arrow 402 to a correspond clock edge at the clock source. In the second embodiment, moving both arrows 401 and 402 deletes the inversion in Destination Clock.

[0086]According to still further embodiments, an interactive graphical user interface of the present invention can display data signals in addition to control signals. The interface can display arrows that point to relevant points on the data signals (e.g., when the data signals are received or captured by certain circuit elements). The interface also allows the user to move the arrows so that they point to different time points on the waveforms graphs.

[0087]The present invention prov...


PUM


Abstract

Techniques for organizing and displaying timing data derived from an EDA tool are provided that allows users to easily extract, analyze, and manipulate portions of the timing data relevant to particular user requirements. Relevant portions of signal waveforms are displayed on an interactive graphical user interface (GUI). Time points on the waveforms are marked with pointers so that users can easily visualize the relationships between different signals. A user can also extract relevant timing data from the EDA tool by manipulating the GUI. Manipulating and understanding circuit design requirements affects all of the design cycle and the quality of the final result from an EDA tool. A user can visualize all aspects of timing analysis on the GUI, such as clock skew, and the setup/hold relationship. A data entry approach is provided that can be used for natural and intuitive manipulation of various timing relationships.

Description

BACKGROUND OF THE INVENTION[0001]The present invention relates to techniques for the graphical analysis and manipulation of circuit timing requirements, and more particularly, to techniques for graphically displaying waveforms for timing signals in a circuit analysis tool that allows users to more easily verify the proper operation of a circuit.[0002]The proper operation of a circuit design can be verified by simulating the circuit design using an electronic design automation (EDA) tool such as PrimeTime from Synopsis. An EDA tool can test a circuit design to ensure that the circuit operates according to user specified constraints.[0003]User constraints may include timing constraints. Timing constraints, for example, can include time limits for the propagation of signals between circuit elements. The time limits may be selected to ensure that the overall circuit design operates according to user requirements.[0004]An EDA tool can test a circuit design and output data indicating timi...

Claims


Application Information

Patent Timeline
IPC IPC(8): G06T11/20G01R13/02G01R31/28G06F1/12G06F17/50
CPCG06T11/206G06F17/5031G06F30/3312
Inventor IOTOV, MIHAIL
Owner ALTERA CORP
Why Eureka
Try Eureka