
Method for acquiring PET and CT images

a technology of ct and pet, applied in the field of tomograph, can solve the problems of unclear approach to small lesions, inability to study systematically extracranial applications, and difficulty in solving alignment and co-registration in other regions of the human body, so as to improve the correction of pet data and accurate scatter correction

Inactive Publication Date: 2009-10-13
SIEMENS MEDICAL SOLUTIONS USA INC
View PDF4 Cites 77 Cited by
  • Summary
  • Abstract
  • Description
  • Claims
  • Application Information

AI Technical Summary

Benefits of technology

[0035]The tomograph acquires functional and anatomical images which are accurately co-registered, without the use of external markers or internal landmarks. CT data is used to improve the correction of the PET data for attenuation and for contamination from scattered photons. By using the CT image in this manner, low-noise attenuation correction factors for PET are generated, and by integrating the anatomical information from the CT into scatter correction methods, an accurate scatter correction is obtained.

Problems solved by technology

The sensitivity of this approach to small lesions, however, is unclear and may depend on accurate transmission information which is often time-consuming to obtain in whole-body mode.
In the head, this has been demonstrated to be fairly successful, but extracranial applications have not yet been studied systematically.
This is to some extent because PET images of cerebral flow and metabolism already contain a limited amount of low-resolution anatomical information which can be effectively exploited by the alignment procedures.
However, the problems of alignment and co-registration in other regions of the human body are more difficult to solve owing to the absence of even low-resolution morphology in the functional image.
This work has also highlighted the difficulties of aligning organs which are not rigidly attached within the body.
Thus, PET-CT post-hoc alignment may be affected by different internal relationships and deformations within the body, limiting the accuracy of such an approach.
As is well-known, compared to anatomical imaging modalities, SPECT images are photon-limited and generally lack anatomical landmarks, thus making image alignment, and the definition of regions-of-interest, even more of a problem than it is for PET.
In addition, non-uniform photon attenuation introduces distortions and artifacts into the reconstructed images.
However, since it is generally based on patient measurements (a transmission scan), it introduces additional noise into the reconstructed emission scan.
In addition, patient movement between the transmission and emission scan (which may be acquired 40 minutes or so later) can introduce serious artifacts and distortions into the reconstructed image, as disclosed by S. C. Huang et al., “Quantitation in positron emission tomography: 2. Effects of inaccurate attenuation correction,”J Comput Assist Tomogr 3, 804-814 (1979).
In a typical PET transmission scanning procedure, the PET transmission scan is performed pre-injection, while the emission scan is performed 45 minutes post-injection, which is potentially a significant source of error if there is any patient motion during this period.
However, there is also an important systematic component to the noise due to the level of scatter in the transmission scan.
Scatter contamination in the transmission scan results in an underestimate of the linear attenuation coefficients, and a consequent under-correction of the emission scan.
The statistics in the transmission scan is greatly increased due to the high singles / coincidence ratio, and the fact that the rate is limited by the deadtime of the detector close to the source.
However, this study fails to address the problem of scatter in the singles transmission scan for quantitative PET imaging.
There are two difficulties with scaling CT attenuation factors for use with PET data.
While this is a good approximation when the major contribution to μE(x) comes from Compton interactions, it is, however, a poor approximation when photoelectric contributions dominate, as they do at CT energies.
The error is particularly large for higher Z materials, such as bone, which contains a large percentage of calcium.
Additionally, the formation and detection of two CT spectra is technically challenging, requiring either the mechanical switching of foil filters, or the switching of the X-ray tube accelerating voltage, which is limited by the possibility of overheating.
It also generally requires a complex calibration procedure.
The non-negligible scatter contribution in 2D PET comes mainly from in-plane scatter, and is a consequence of the poor energy resolution of the BGO block design.
This effectively distorts and amplifies the effect of scatter, making an effective scatter correction considerably more complex.
While this procedure may be reasonably effective for the brain and at the low levels of scatter encountered in 2D PET, it is not satisfactory for determining scatter in other parts of the body, or in handling the increased amount of scatter in 3D.
Since the scatter background depends on both the tracer distribution and the density distribution of the scattering medium, the convolution approach has only a limited potential to account for such spatially-variant effects.
However, this first step will tend to overcorrect because the measured projection data used in the convolution includes scatter.
Statistical noise may be a problem, however, due to the small number of counts collected in this upper window.
Again, since this method has no information concerning activity outside the field-of-view, the calculated scatter distribution will not in general correct for such an eventuality.
Other approaches, such as the use of multiple energy windows are not possible with this scanner design.
However, with the exception of the brain, the re-alignment of images from different modalities is not straightforward, even when surface markers or reference points are used.

Method used


Image

  • Method for acquiring PET and CT images
  • Method for acquiring PET and CT images
  • Method for acquiring PET and CT images

Examples


Embodiment Construction

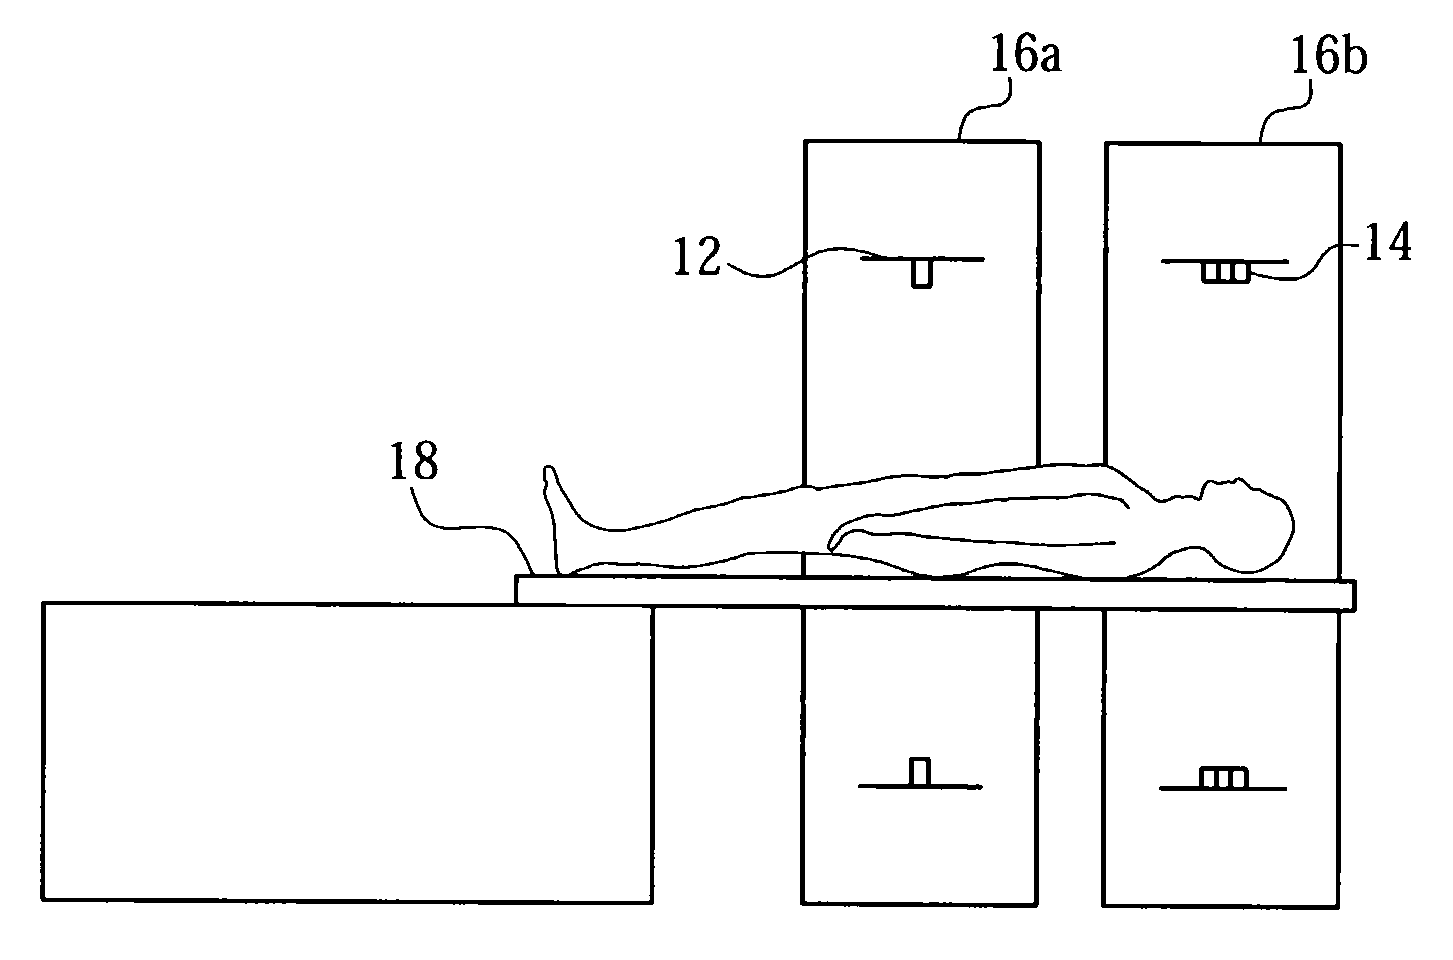
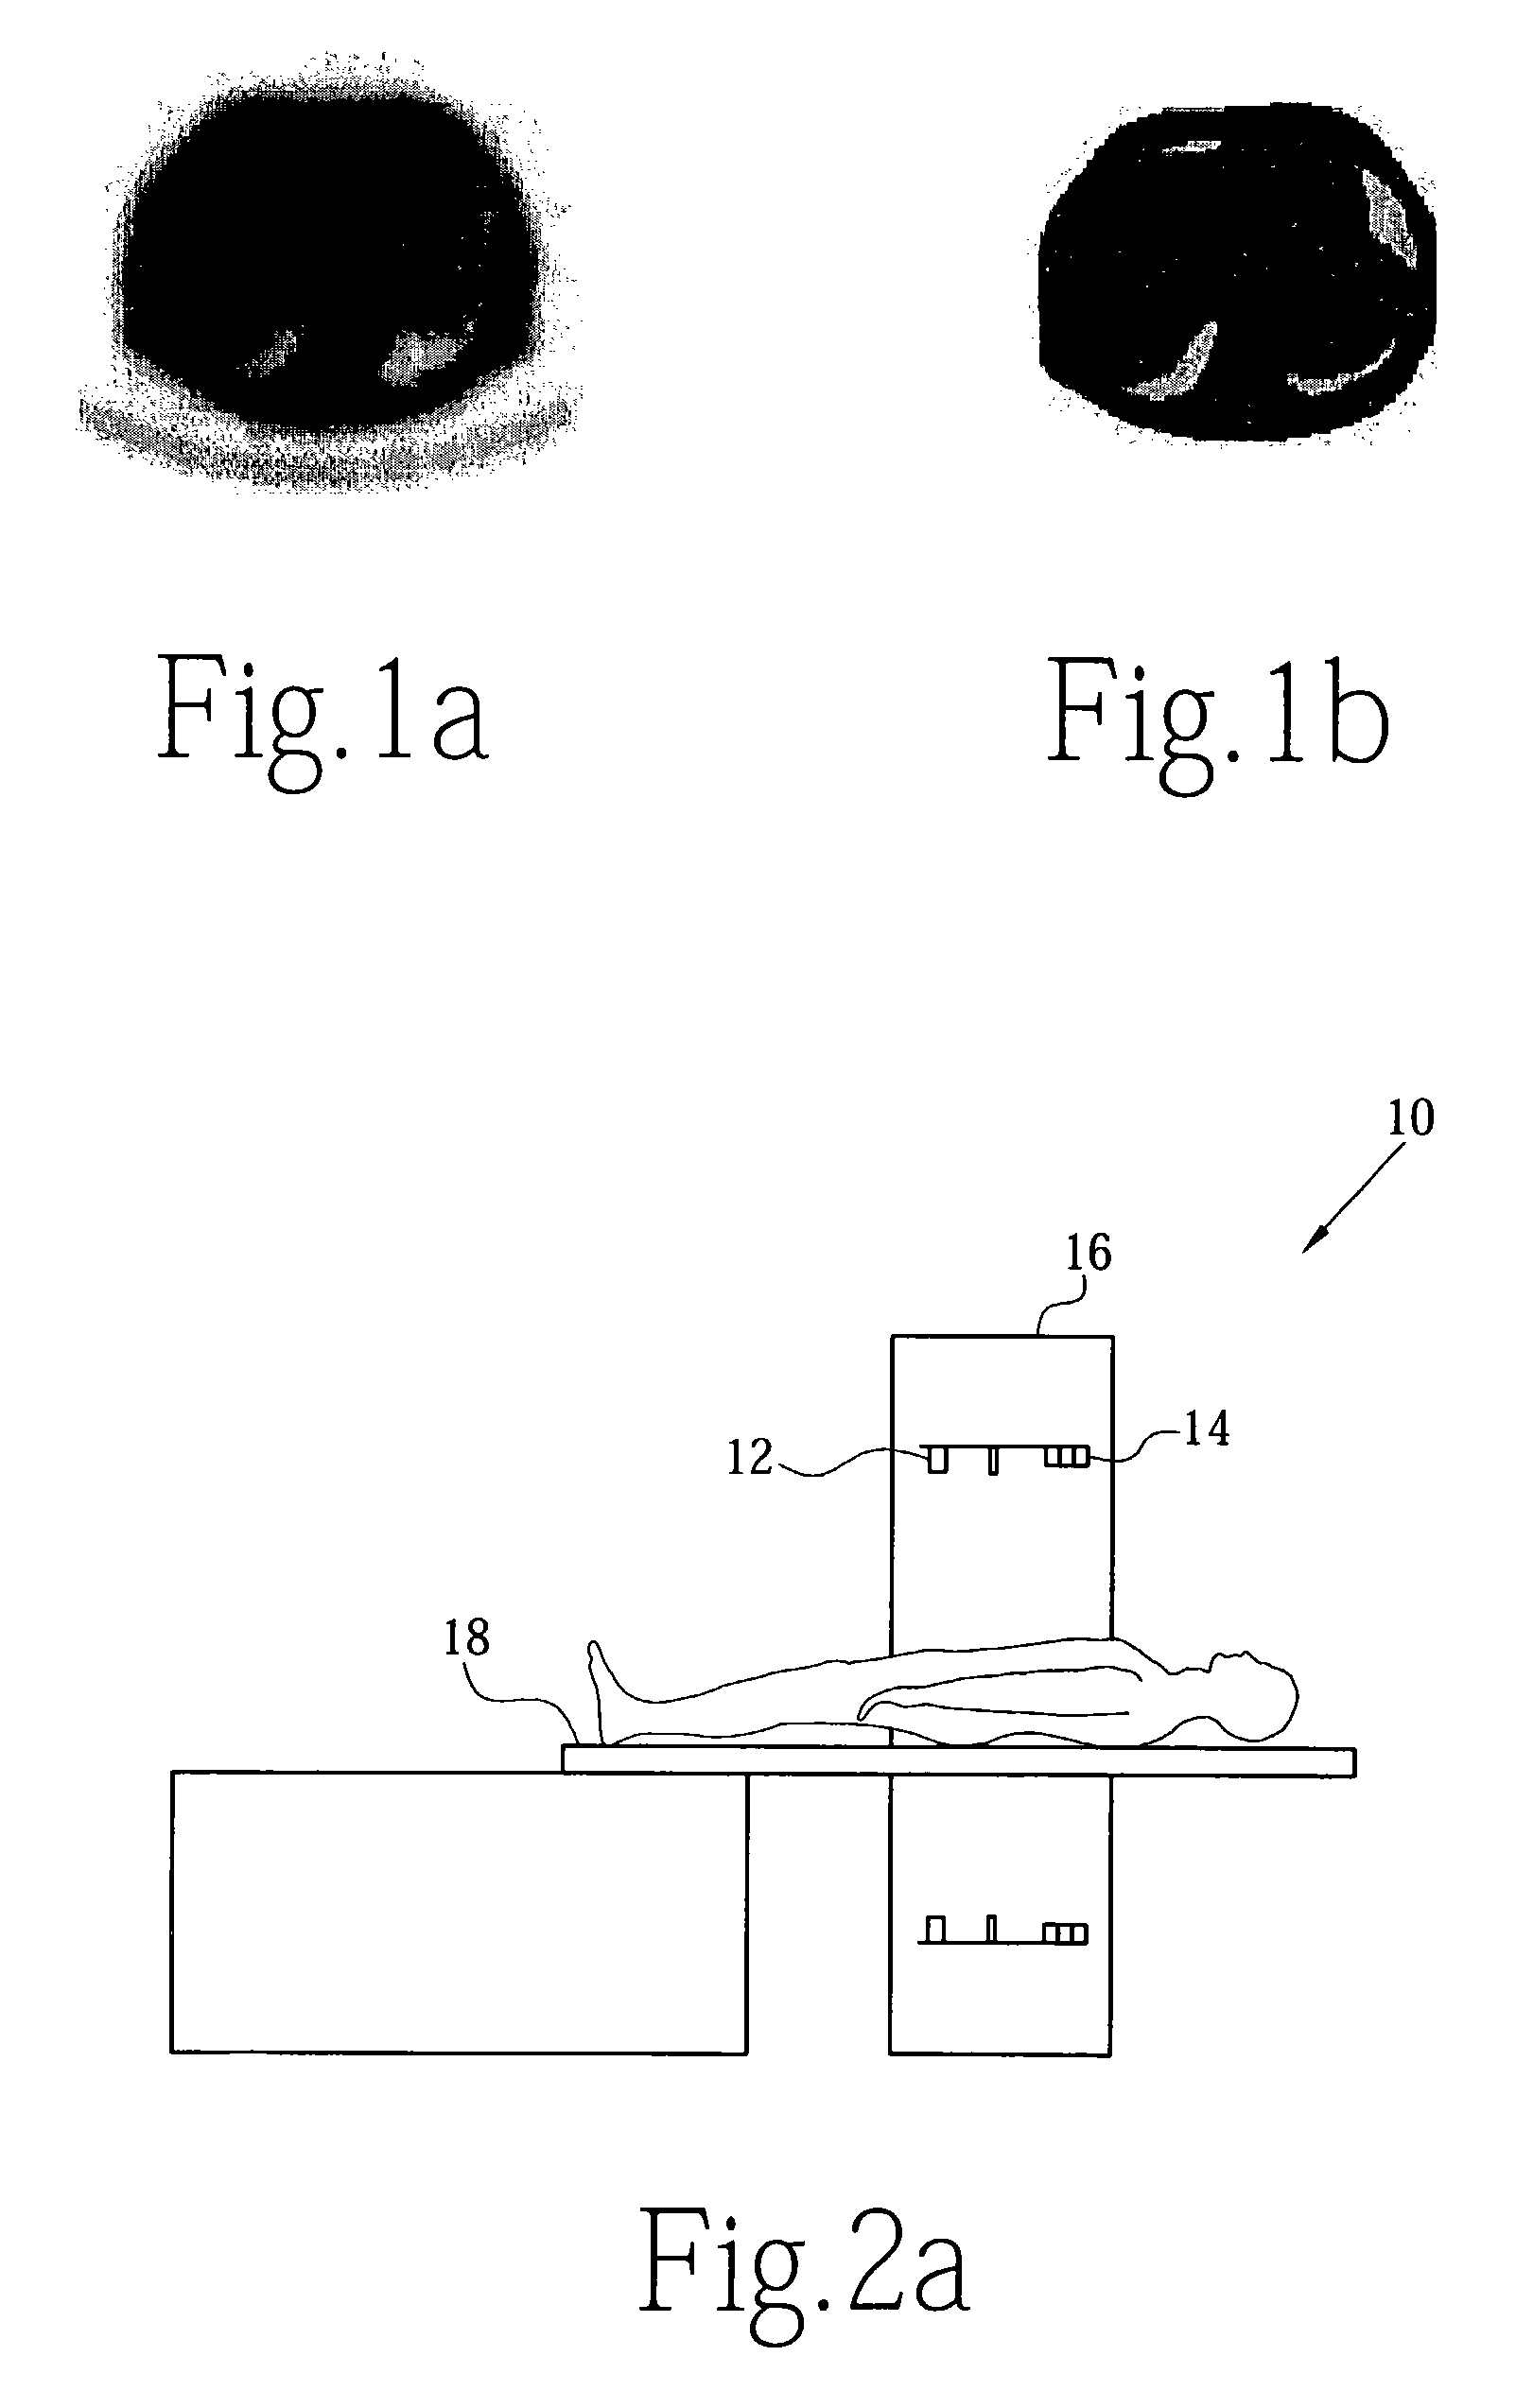
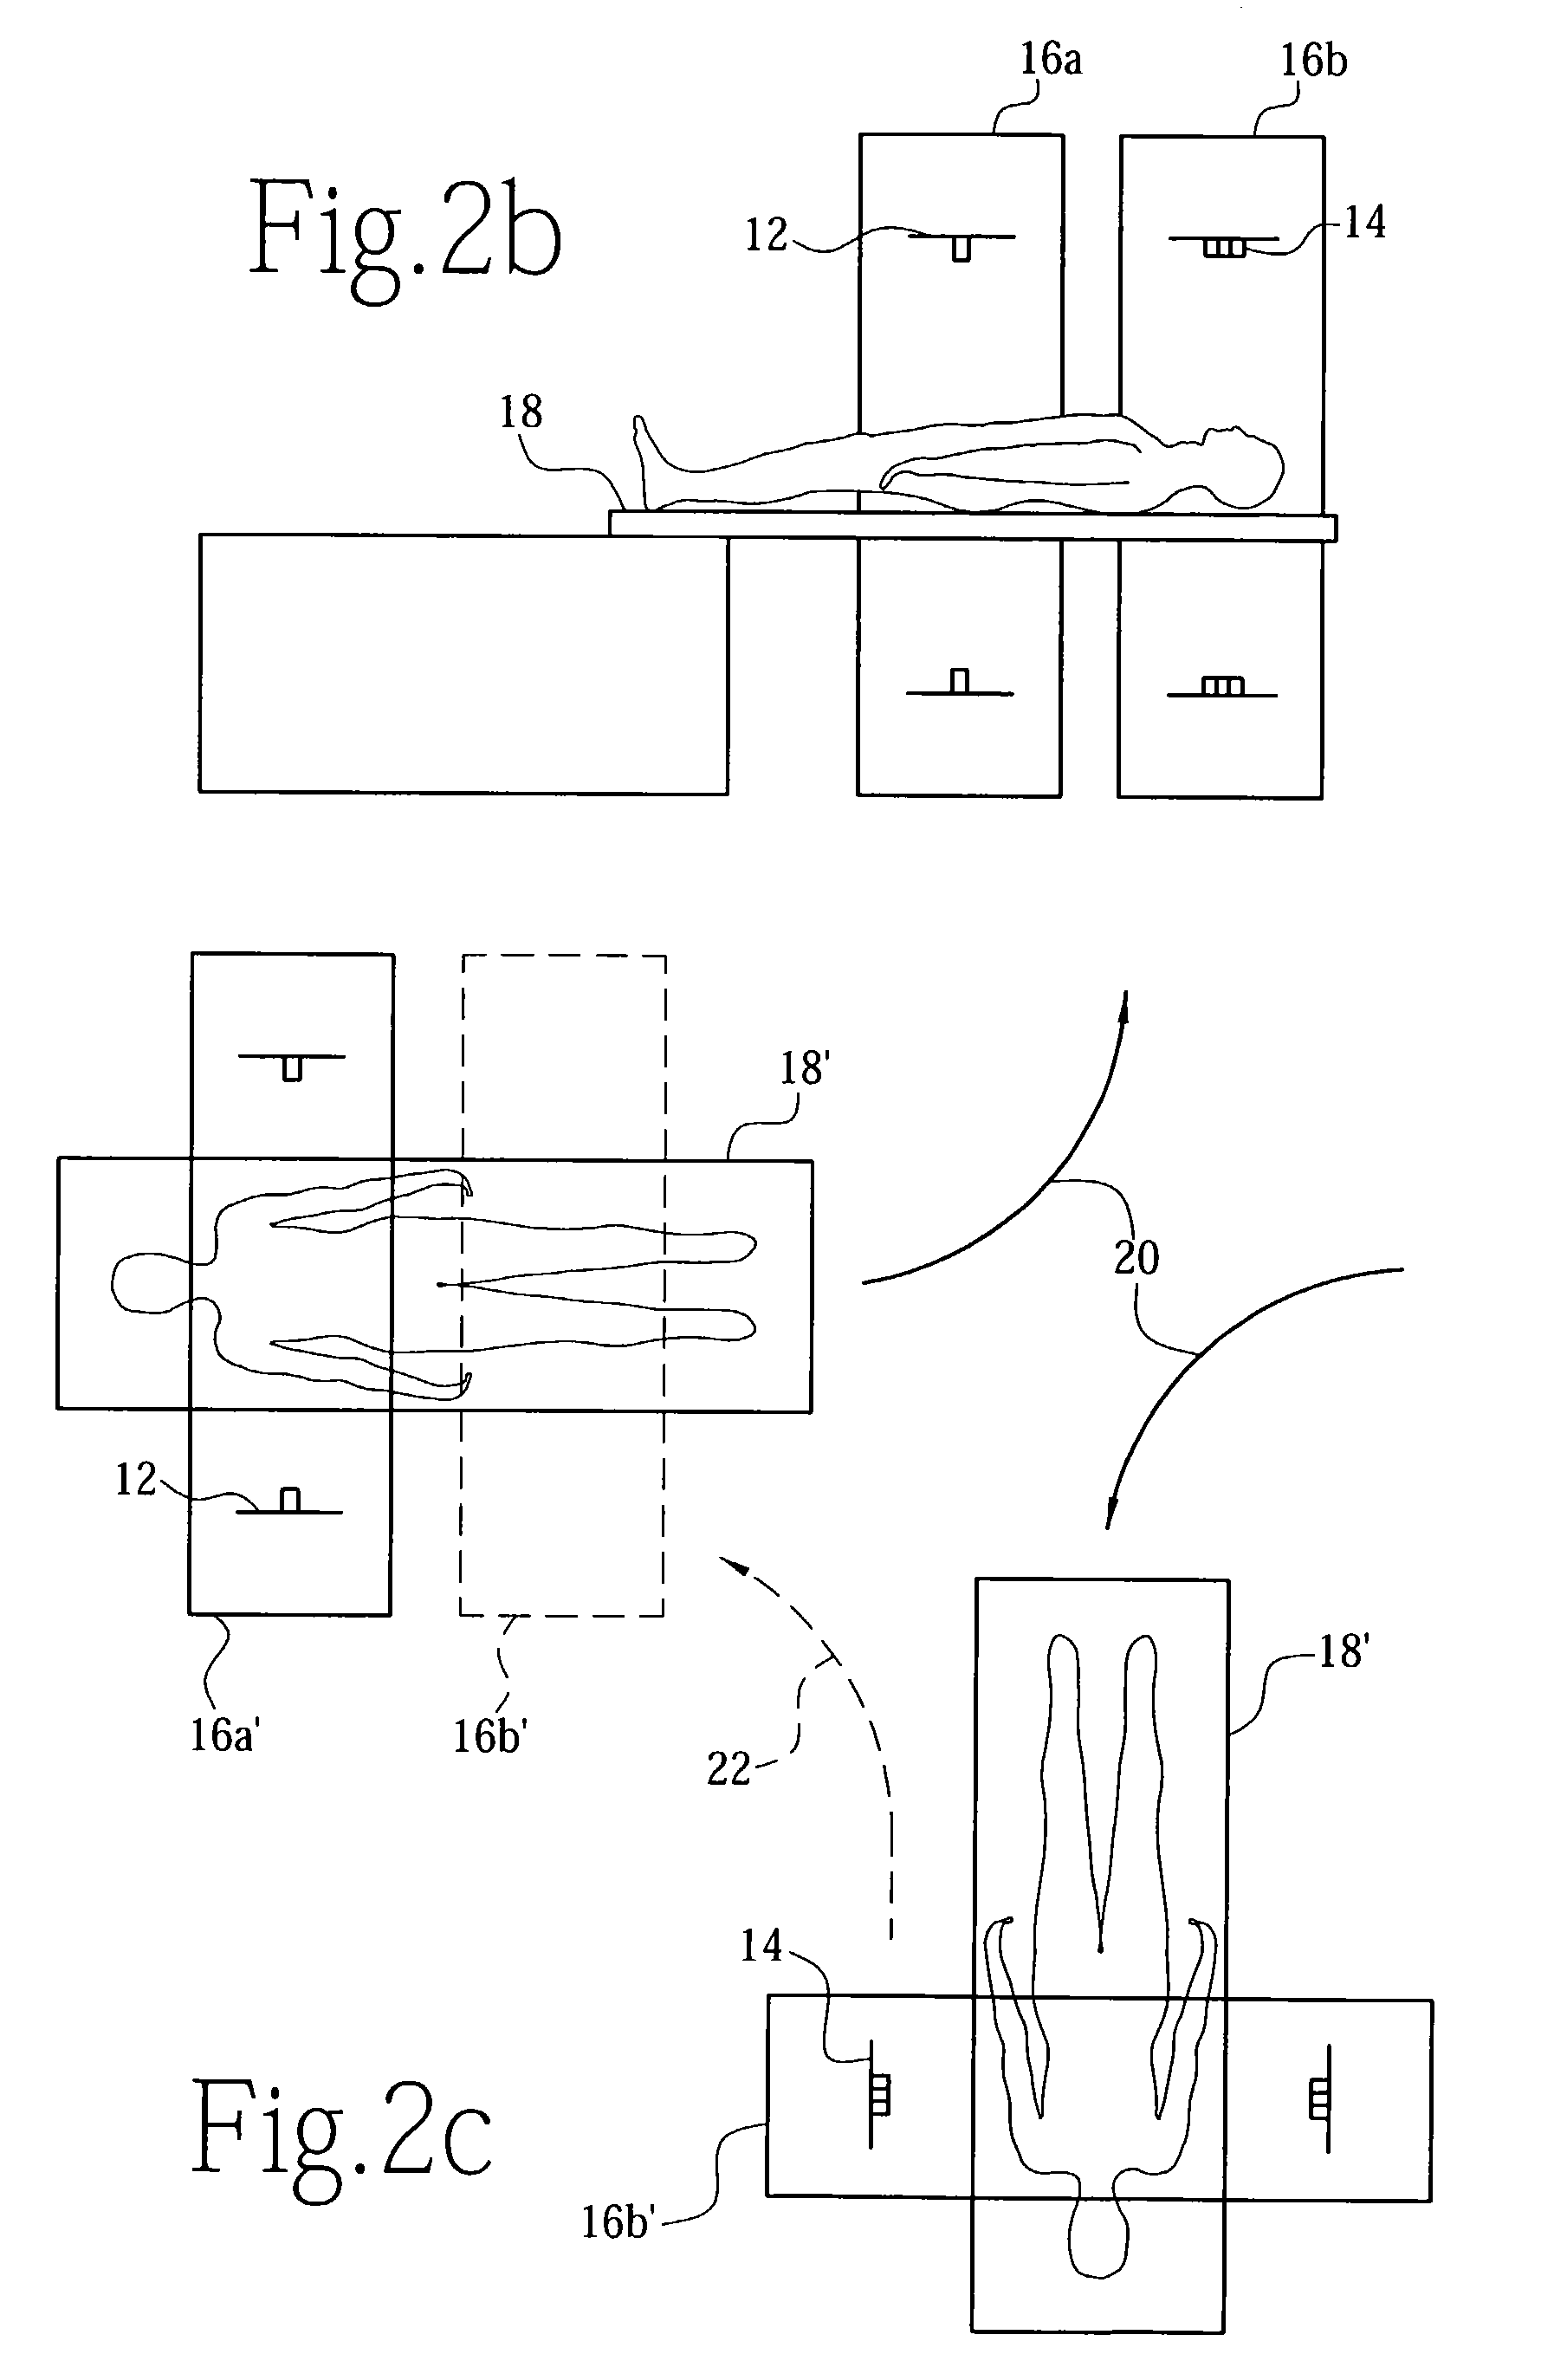
[0069]A combined PET and X-Ray CT tomograph, constructed in accordance with the present invention, is illustrated generally as 10 in the figures. The combined PET and X-Ray CT tomograph, or PET / CT scanner 10 allows registered CT and PET images to be acquired sequentially in a single device, overcoming alignment problems due to internal organ movement, variations in scanner bed profile, and positioning of the patient for the scan. In order to achieve good signal-to-noise (SNR) for imaging any region of the body, an improvement to both the CT-based attenuation correction procedure and the uniformity of the noise structure in the PET emission scan is provided.

[0070]In the described embodiment, the PET / CT scanner 10 combines a Siemens Somatom AR.SP spiral CT scanner 12 with a rotating ECAT ART PET scanner 14. The PET / CT scanner 10 includes a PET scanner 14 and a CT scanner 12, both commercially-available, in a physically known relationship one with the other. Each of the X-ray CT scanne...


PUM


Abstract

A combined PET and X-Ray CT tomograph for acquiring CT and PET images sequentially in a single device, overcoming alignment problems due to internal organ movement, variations in scanner bed profile, and positioning of the patient for the scan. In order to achieve good signal-to-noise (SNR) for imaging any region of the body, an improvement to both the CT-based attenuation correction procedure and the uniformity of the noise structure in the PET emission scan is provided. The PET / CT scanner includes an X-ray CT and two arrays of PET detectors mounted on a single support within the same gantry, and rotate the support to acquire a full projection data set for both imaging modalities. The tomograph acquires functional and anatomical images which are accurately co-registered, without the use of external markers or internal landmarks.

Description

CROSS-REFERENCE TO RELATED APPLICATIONS[0001]This is a division of application Ser. No. 10 / 167,837, filed Jun. 12, 2002, now U.S. Pat. No. 6,631,284, which is a continuation-in-part of our earlier filed application Ser. No. 09 / 685,222, filed Oct. 10, 2000, which issued as U.S. Pat. No. 6,490,476, on Dec. 3, 2002, and which claimed the benefit of U.S. Provisional Application No. 60 / 159,395, filed Oct. 14, 1999.STATEMENT REGARDING FEDERALLY SPONSORED RESEARCH OR DEVELOPMENT[0002]Not ApplicableBACKGROUND OF THE INVENTION[0003]1. Field of Invention[0004]This invention relates to a tomograph which has the capability of operating in either X-Ray computerized tomography (CT) or positron emission tomography (PET) mode. More specifically, it relates to a combined PET and CT scanner which allows co-registered CT and PET images to be acquired sequentially in a single device, overcoming alignment problems due to internal organ movement, variations in scanner bed profile, and positioning of the ...

Claims


Application Information

Patent Timeline
Patent Type & Authority Patents(United States)
IPC IPC(8): A61B6/00A61B6/03G01T1/161G01T1/29
CPCA61B6/032A61B6/037A61B6/482A61B6/5235G01T1/1611G01T1/2985A61B6/463A61B6/405A61B6/4488A61B6/583
Inventor TOWNSEND, DAVID W.NUTT, RONALD
Owner SIEMENS MEDICAL SOLUTIONS USA INC
Learn More