Electrical sensor for monitoring degradation of products from environmental stressors

a technology of environmental stressors and sensors, applied in the direction of measuring objects on conveyors, instruments, testing food, etc., can solve the problems high cost, and high cost, and achieve the effect of reducing the risk of premature degradation of products for customers and health and safety

Inactive Publication Date: 2009-11-03
WATKINS JR KENNETH S +1
View PDF8 Cites 61 Cited by
  • Summary
  • Abstract
  • Description
  • Claims
  • Application Information

AI Technical Summary

Benefits of technology

[0024]By measuring the resistivity-time response of the sensor under controlled environmental conditions and comparing measurements of a selected degradation measurement (such as hardness, elongation, or other mechanical, chemical or sensory degradation measurements) of the product, sensor response and product degradation state may be modeled and equated by graphical, numerical or statistical methods. Data collected at multiple temperatures (or other environmental stress conditions) may be used to predict remaining life by measuring resistivity data through use of Arrhenius methodology. An advantage of this approach is that the sensor can be made simply by adding a conductive filler to the product material. This approach is especially useful when integrating the sensor into the product, such as integrated degradation sensors in wire and cable insulation, composite structures and polymeric building materials such as building siding ...

Problems solved by technology

A great many products used by consumers, businesses and organizations degrade rapidly unless stored in controlled environments.
All polymeric products and many non-polymeric products are subject to aging effects to varying degrees, and often under multiple complex degradation mechanisms.
Prematurely degraded products may pose health and safety risks to customers.
Products properly stored may be disposed of prematurely due to conservative shelf-life dating.
However, expiration date methods assume environmental specification conformance within predetermined ranges and provide no feedback or date correction should the actual environmental conditions be exceeded.
On the other hand, consumption of spoiled food or drugs that have lost their efficacy poses serious health risks and associated costs.
Many materials such as so...

Method used


Image

  • Electrical sensor for monitoring degradation of products from environmental stressors
  • Electrical sensor for monitoring degradation of products from environmental stressors
  • Electrical sensor for monitoring degradation of products from environmental stressors

Examples


example 1

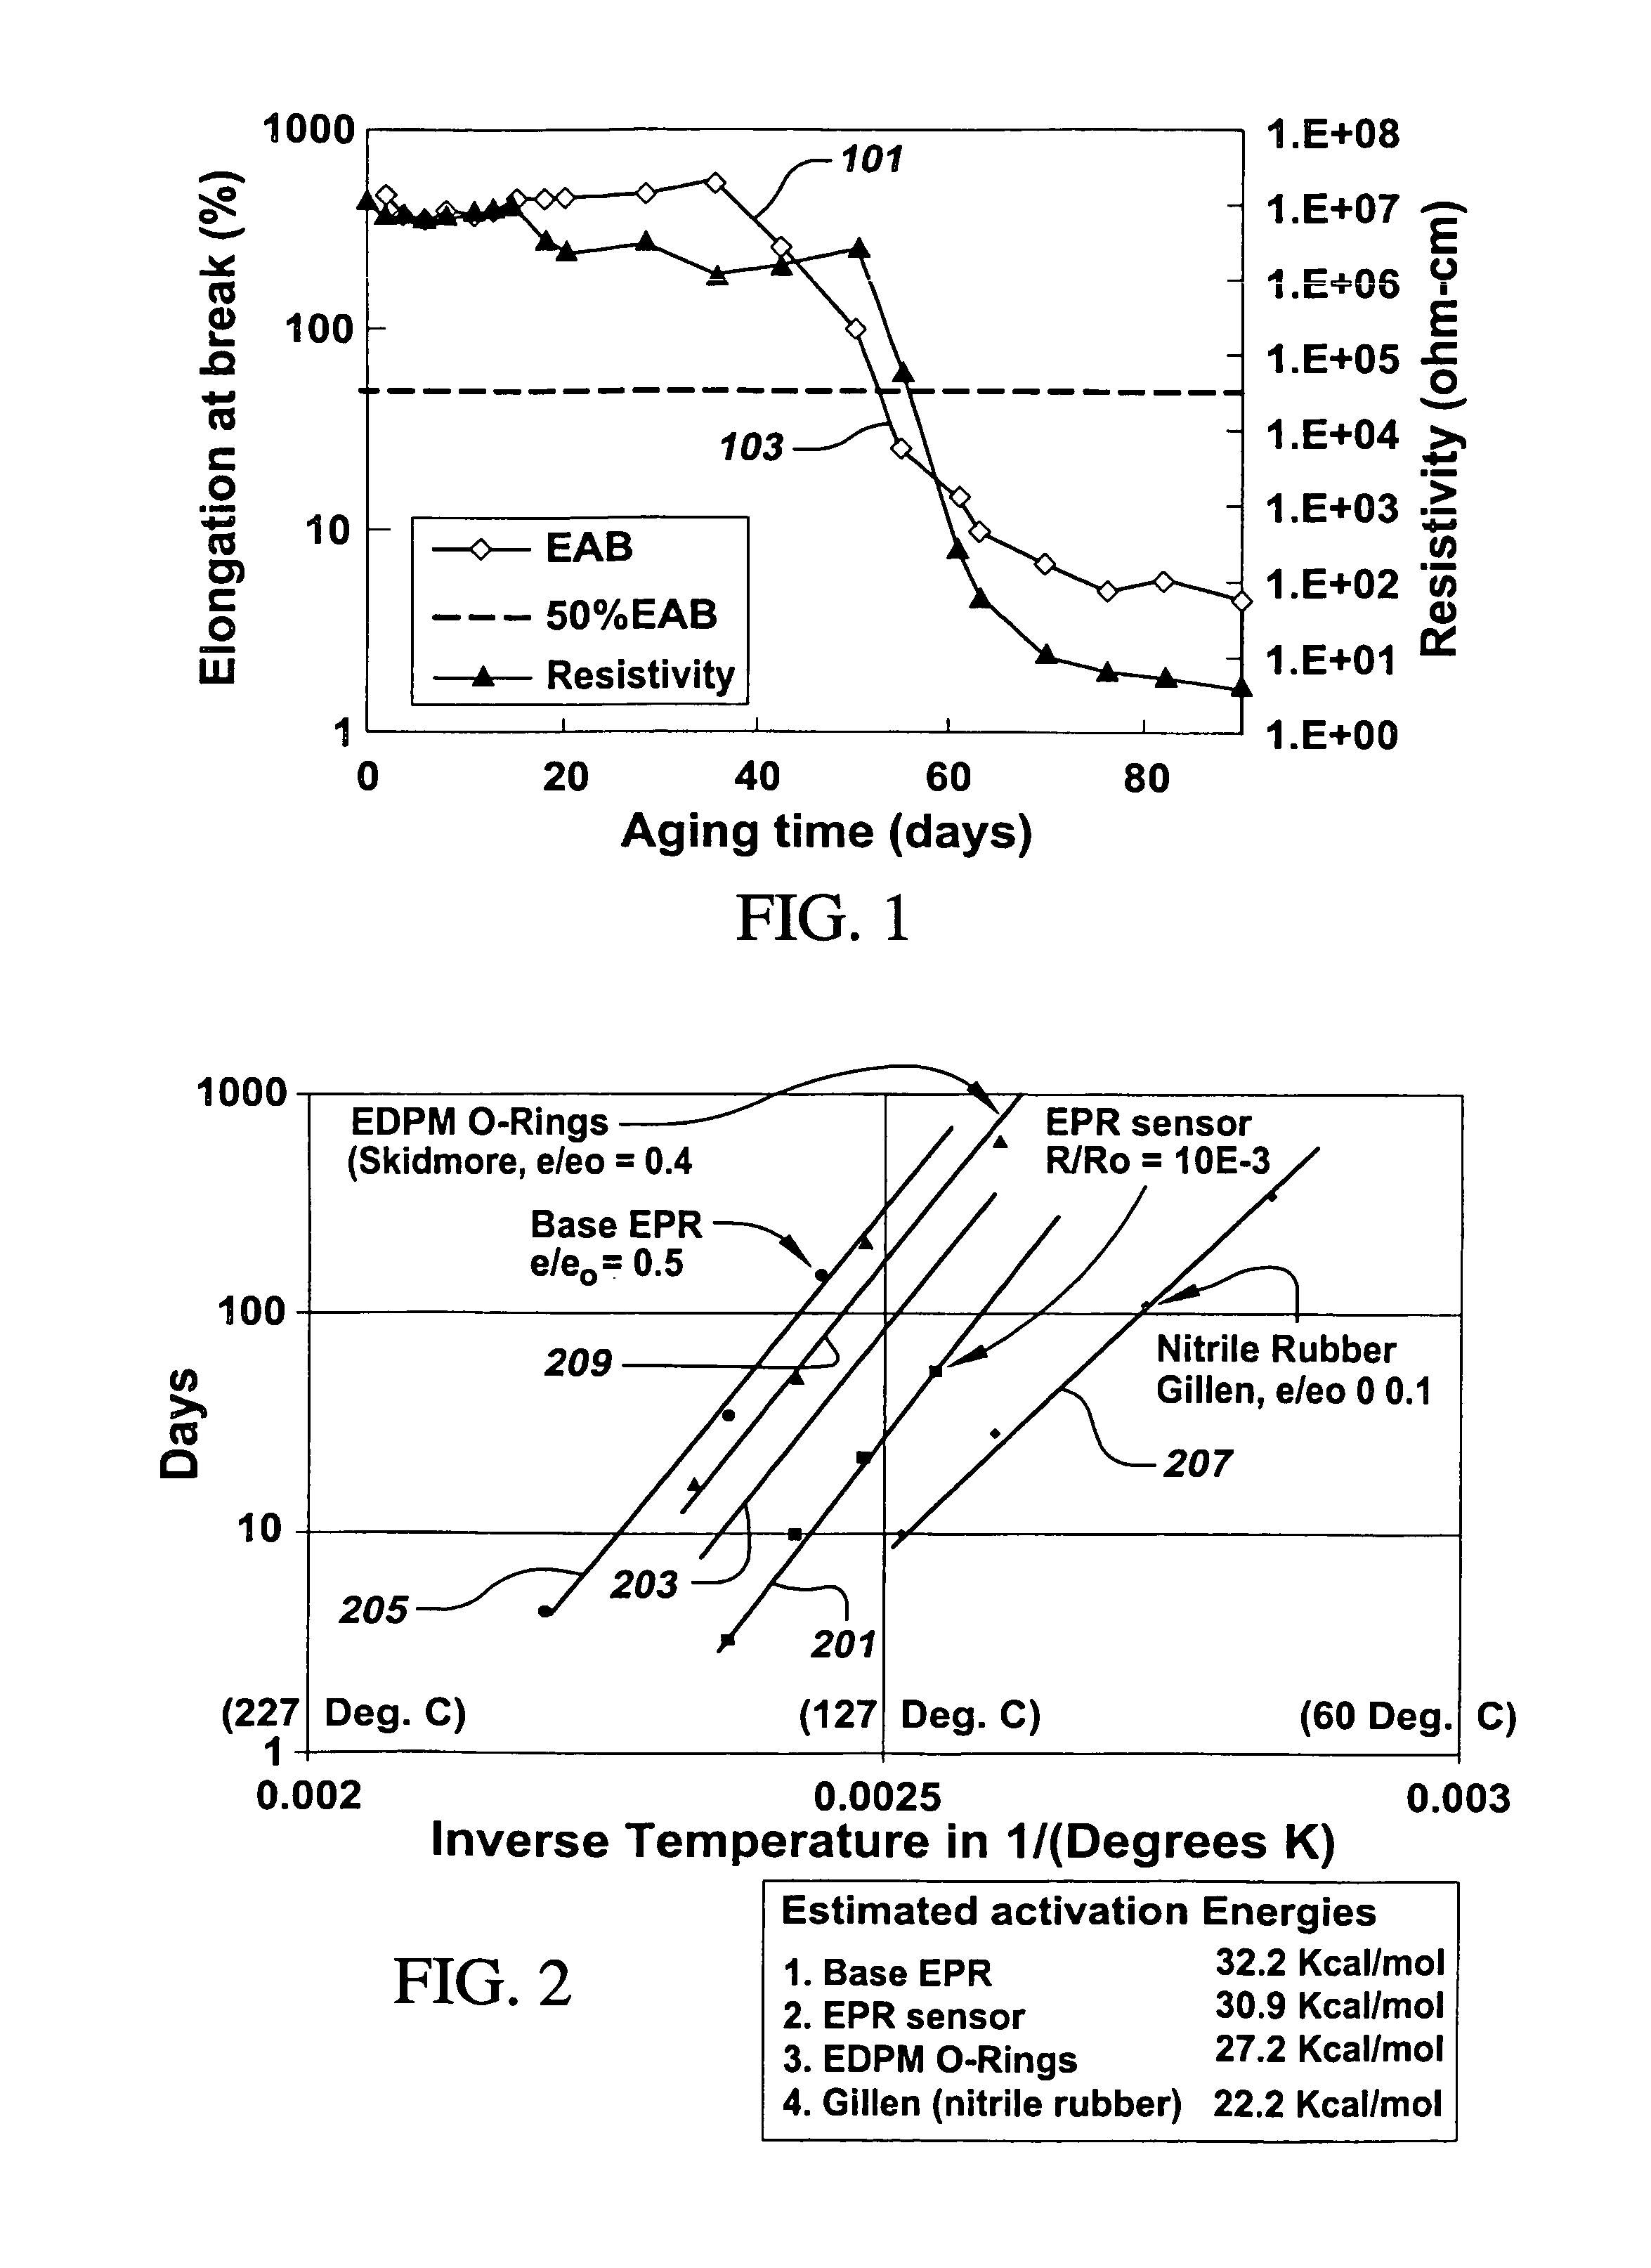
[0071]FIG. 2 is an Arrhenius diagram showing correlation of a conductive composite degradation sensor 201 made by compounding ethylene propylene rubber (EPR) and carbon black. The carbon black loading was adjusted to provide an initial resistivity of approximately 1E+8 ohm-cm. Another sensor 203 was made by adding a commercial anti-oxidant. The samples were aged in a thermo-oxidative environment (convective oven) at several temperatures and plotted on the Arrhenius diagram. The times plotted for the degradation sensors corresponded to a relative decrease in resistivity (3 decade decrease from the initial resistivity). A plot of the same EPR base material 205 as used in the degradation sensor, but plotted conventionally by mechanical degradation (50% drop in elongation), is shown for comparison. Activation energies of the two sensors (with and without anti-oxidant measured by resistivity decrease) and the EPR base polymer (measured by loss of elongation) are similar and shown for com...

example 2

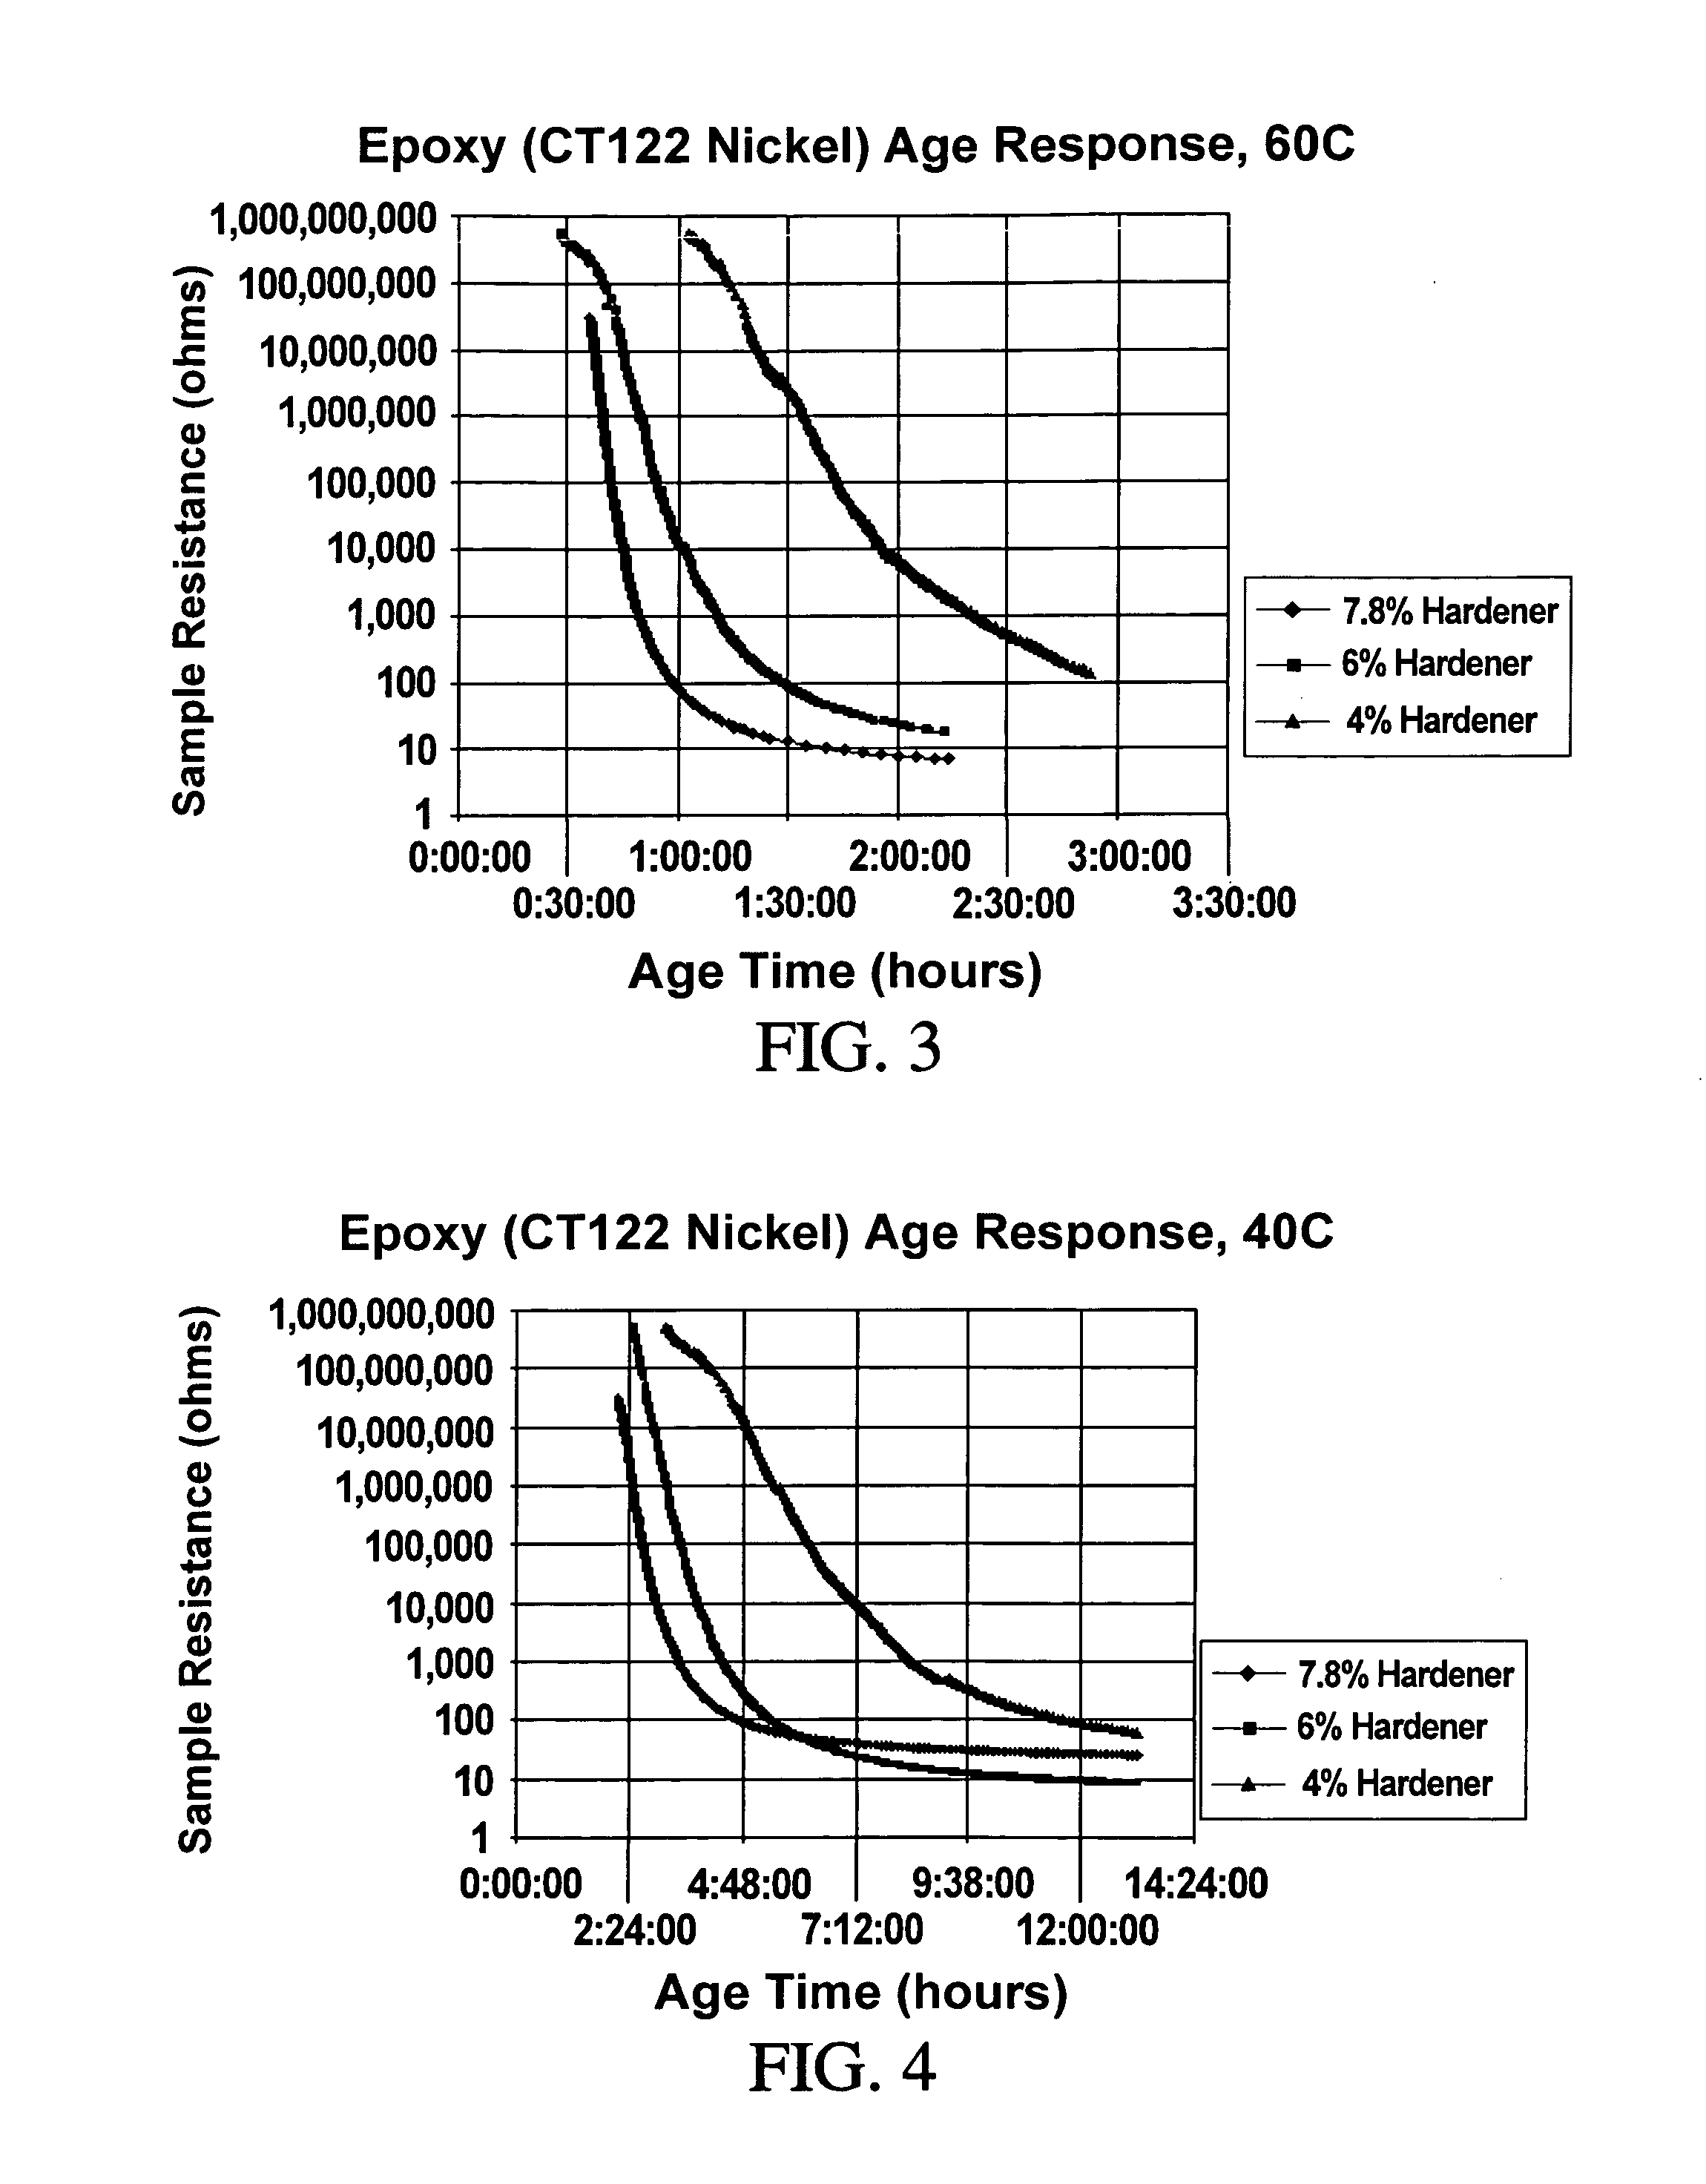
[0073]FIG. 3 is a resistivity vs. time chart for a degradation sensor made of a two-part epoxy (at several hardener / resin mixtures) thermoset material and a nickel conductive filler, aged at 60° C. FIG. 4 is a resistivity vs. time chart for a degradation sensor made of the two-part epoxy thermoset material and a nickel conductive filler, aged at 40° C. As the chemical crosslinking proceeds, volumetric shrinkage of the polymeric matrix increases the volume fraction of the conductive filler, causing the resistivity to decrease. Both trials utilized three specimens with different resin / hardener ratios. As seen from the charts, increasing hardener (control agent) percentage increases the rate of resistivity decrease, corresponding to an increased reaction rate (curing) of the epoxy. Increased temperature (environmental stressor) also increases the reaction rate, increasing the rate of decrease of resistivity and reducing the curing time of the epoxy.

example 3

[0074]FIG. 5 is a resistivity-time chart of a conductive composite sensor made utilizing a volatile polymeric component and silver particles. The composite utilized in this test is a commercially available conductive pen product (Chemtronics CT-CW2200STP). As can be seen from the figure, the reaction rate of resistivity decrease increases with temperature (environmental stressor).

[0075]Selecting the matrix polymer for a degradation sensor can be used to determine the overall activation energy of the sensor reaction. Selection of a rate-affecting component such as the type and amount of an anti-oxidant in an elastomer or thermoplastic, can be used to adjust the time constant (Y intercept of the Arrhenius curve) of the reaction. Or, the resin and hardeners types may be selected in thermoset polymer matrixes to provide a desired activation energy and the resin / hardener ratios selected to control the time constant of the reaction.

[0076]Still another method of “designing” a degradation s...


PUM


Abstract

An environmental degradation sensor for environmentally sensitive products such as food, pharmaceuticals or cosmetic products provides the degraded state and estimated remaining life of the product. The sensor is made of a polymeric matrix and conductive filler. A control agent, selected to adjust a reaction rate of the sensor to environmental conditions, allows correlation of an electrical property of the sensor to a degraded state of the product. The sensor may be integrated with a passive RFID to provide product identification and degradation status wirelessly via reader. The sensor improves product safety, reduces cost of premature product disposal and, combined with RFIDs, improves the security of products through combined product degradation monitoring and tracking.

Description

CROSS REFERENCE TO RELATED APPLICATIONS[0001]This application claims the benefits of PCT Application No. PCT / US2006 / 006187 filed 22 Feb. 2006 claiming benefit of U.S. Provisional Application No. 60 / 655,379 filed Feb. 23, 2005.FIELD OF THE INVENTION[0002]The present invention relates to environmental degradation sensors and, more particularly, to degradation sensors for environmentally sensitive products. The present invention also relates to apparatus and methods for sensor construction, sensor applications, remaining life prediction, and methods of product degradation tracking and networking.BACKGROUND OF THE INVENTION[0003]A great many products used by consumers, businesses and organizations degrade rapidly unless stored in controlled environments. These products include food, pharmaceutical and chemical products. All polymeric products and many non-polymeric products are subject to aging effects to varying degrees, and often under multiple complex degradation mechanisms. Prematur...

Claims


Application Information

Patent Timeline
IPC IPC(8): H01J40/14G06M7/00
CPCG01N27/12G06K19/077G06K19/0717G01N33/02
Inventor WATKINS, JR., KENNETH S.MORRIS, SHELBY J.
Owner WATKINS JR KENNETH S
Why Eureka
Try Eureka