

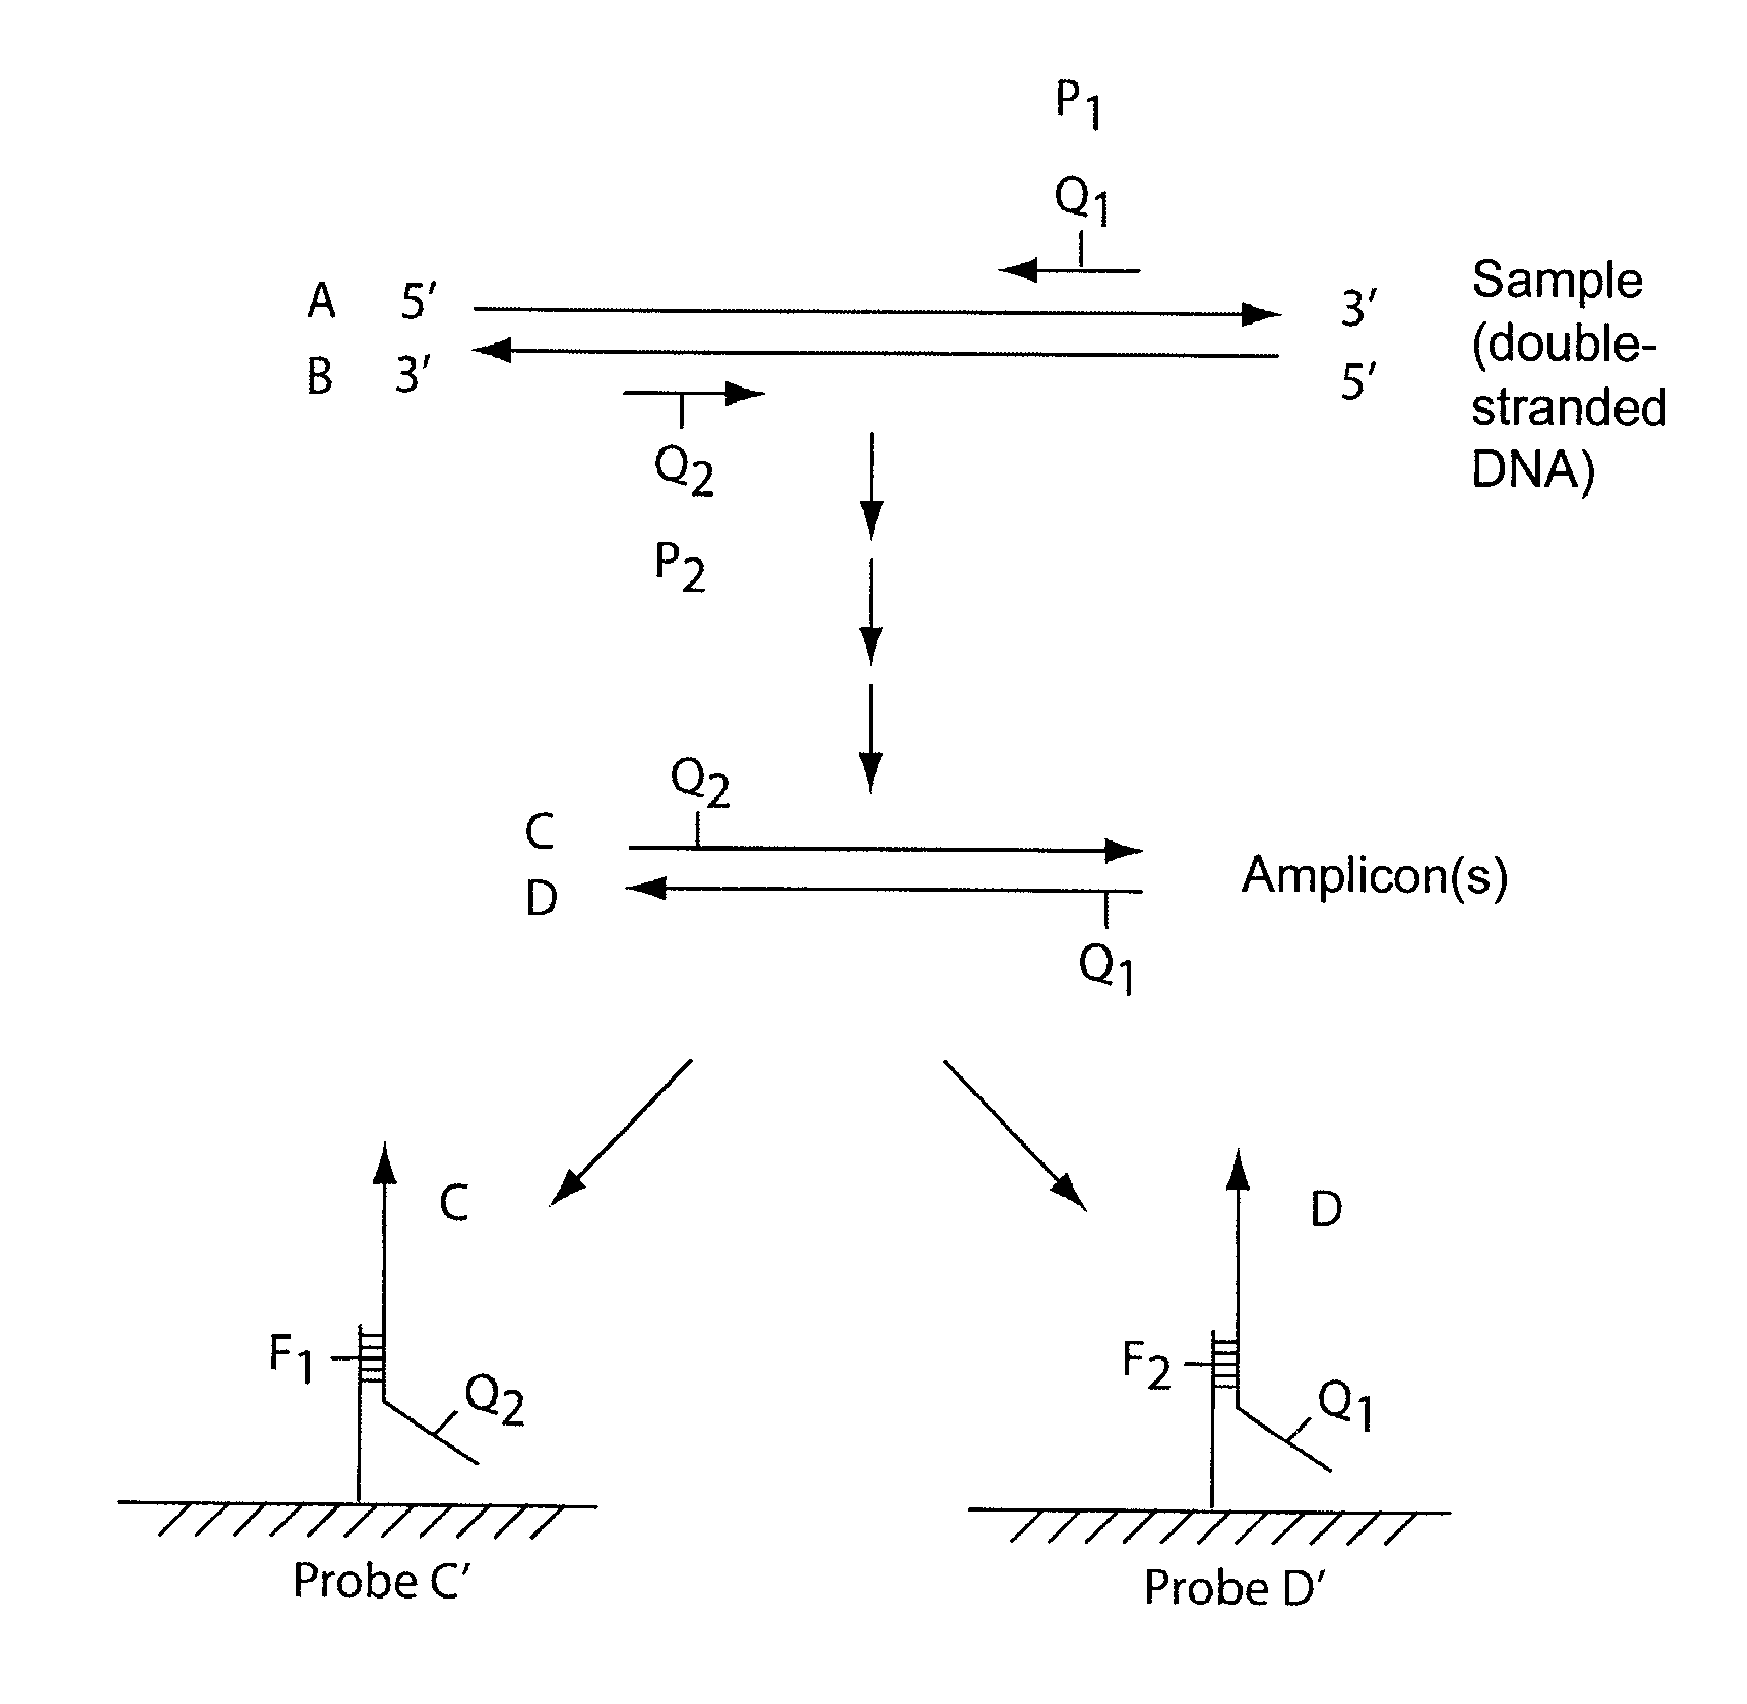
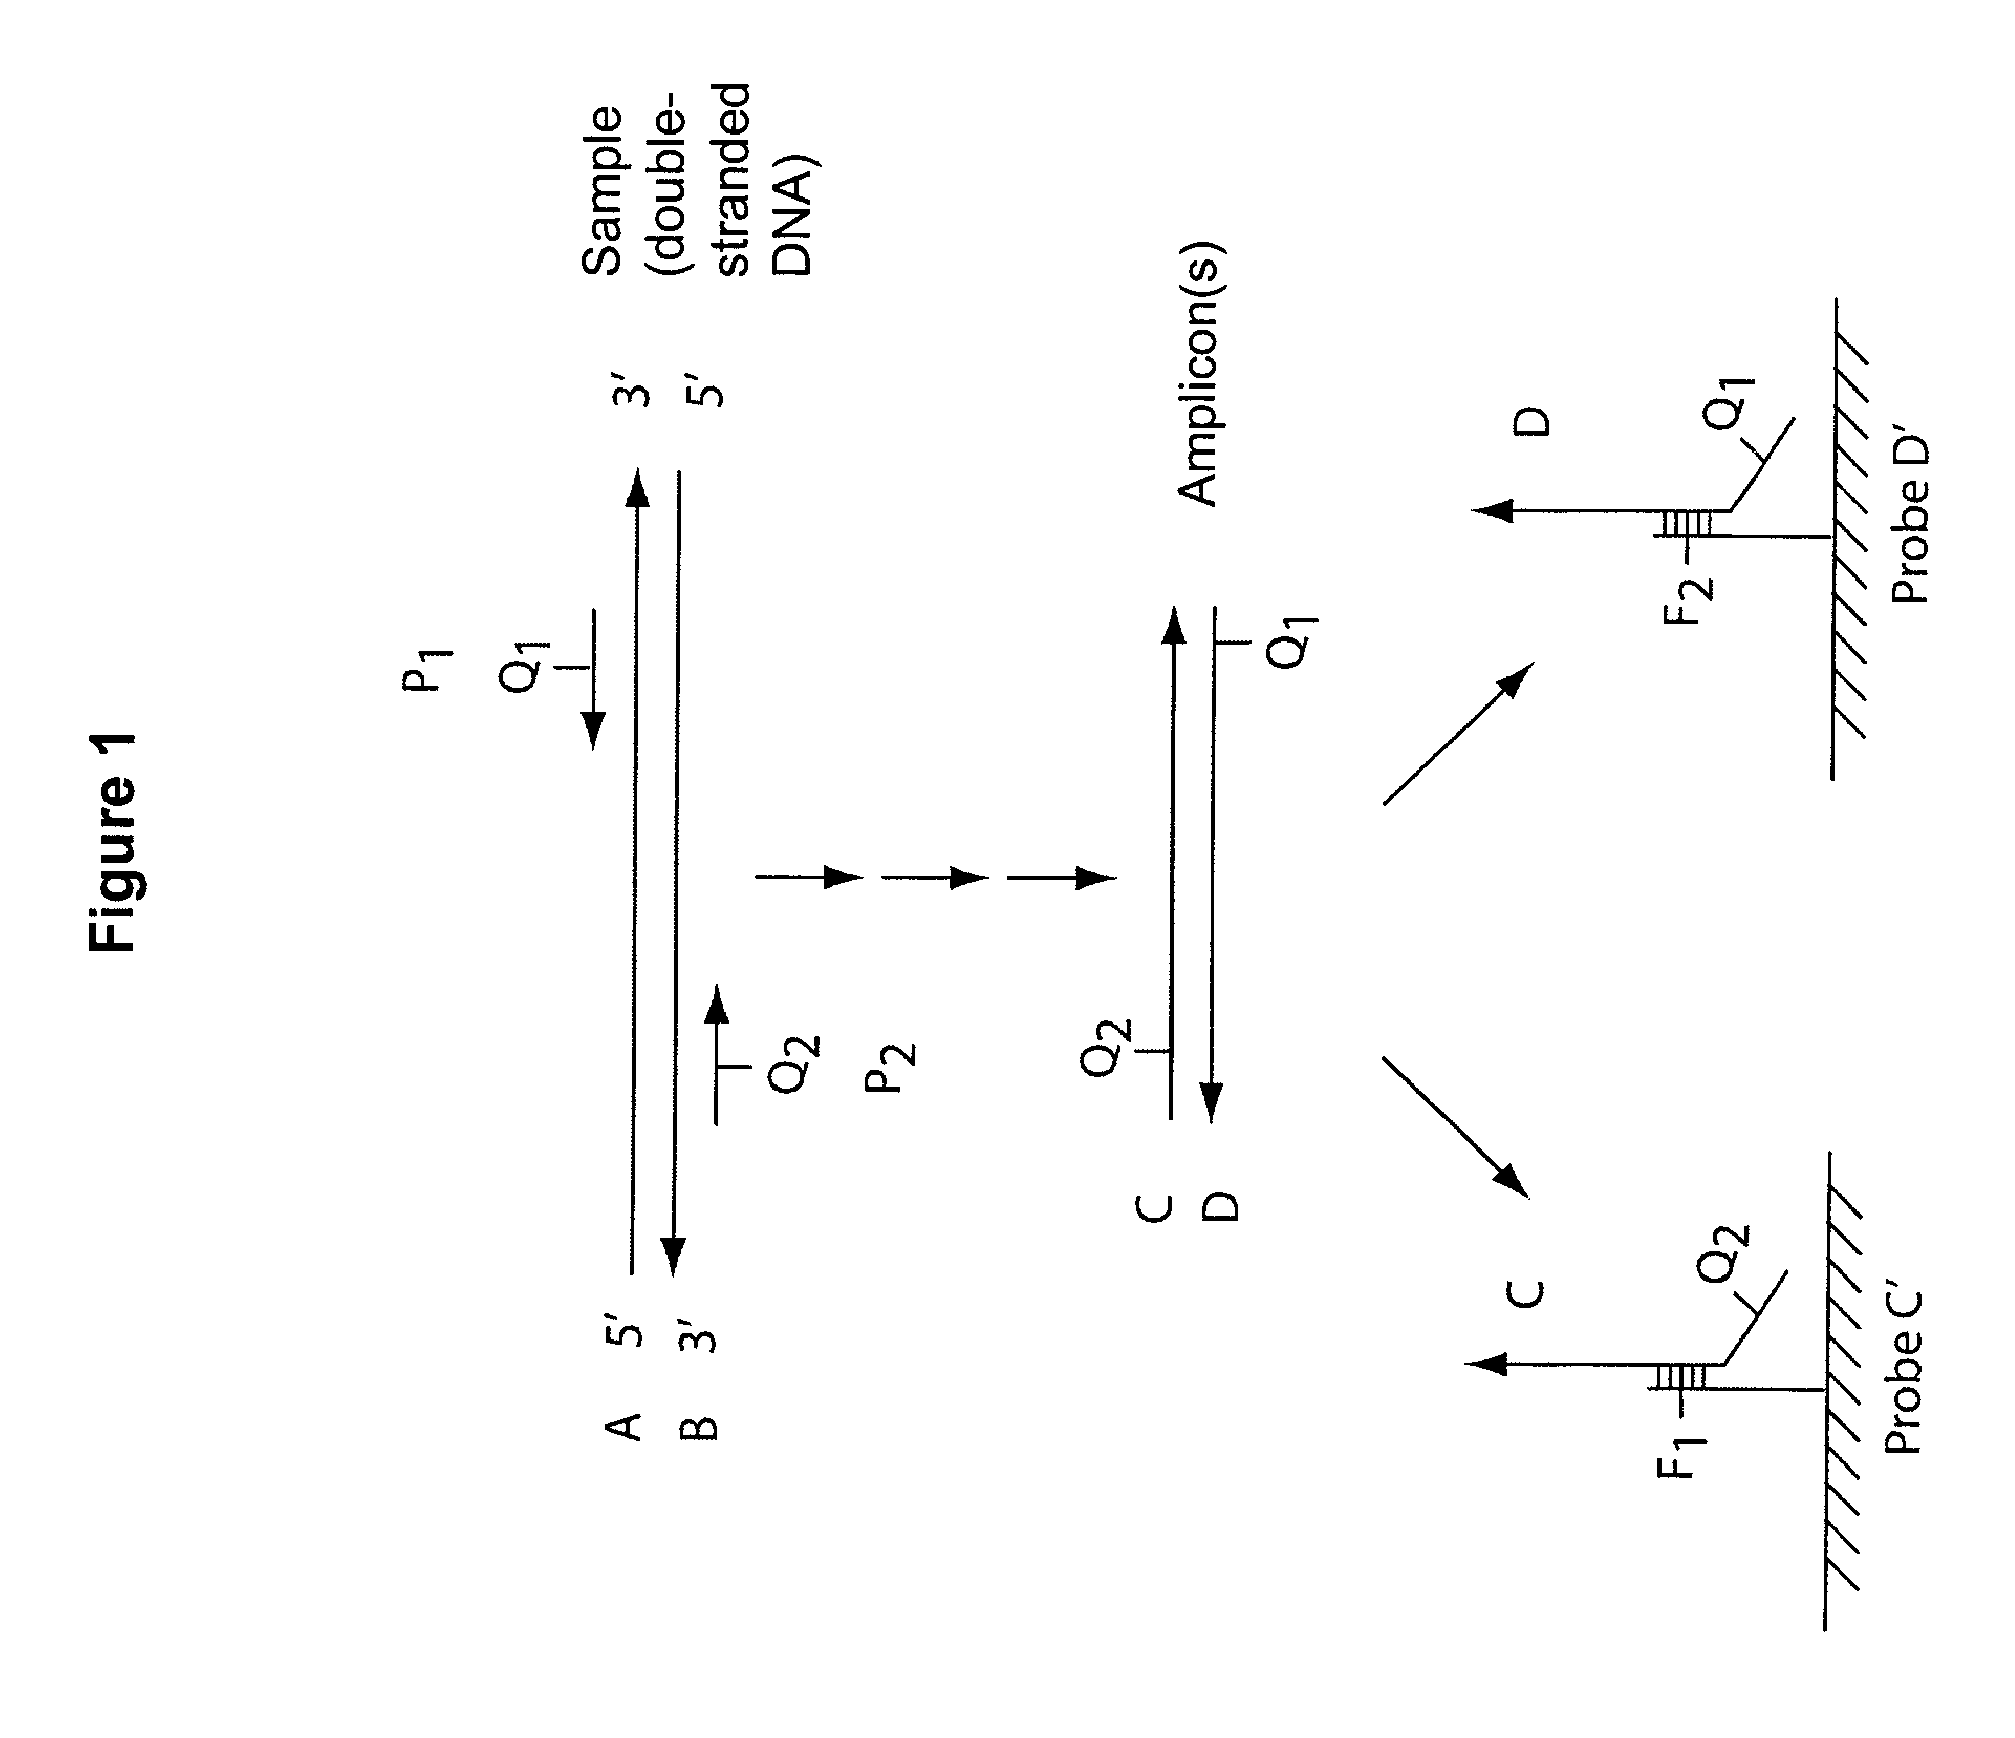
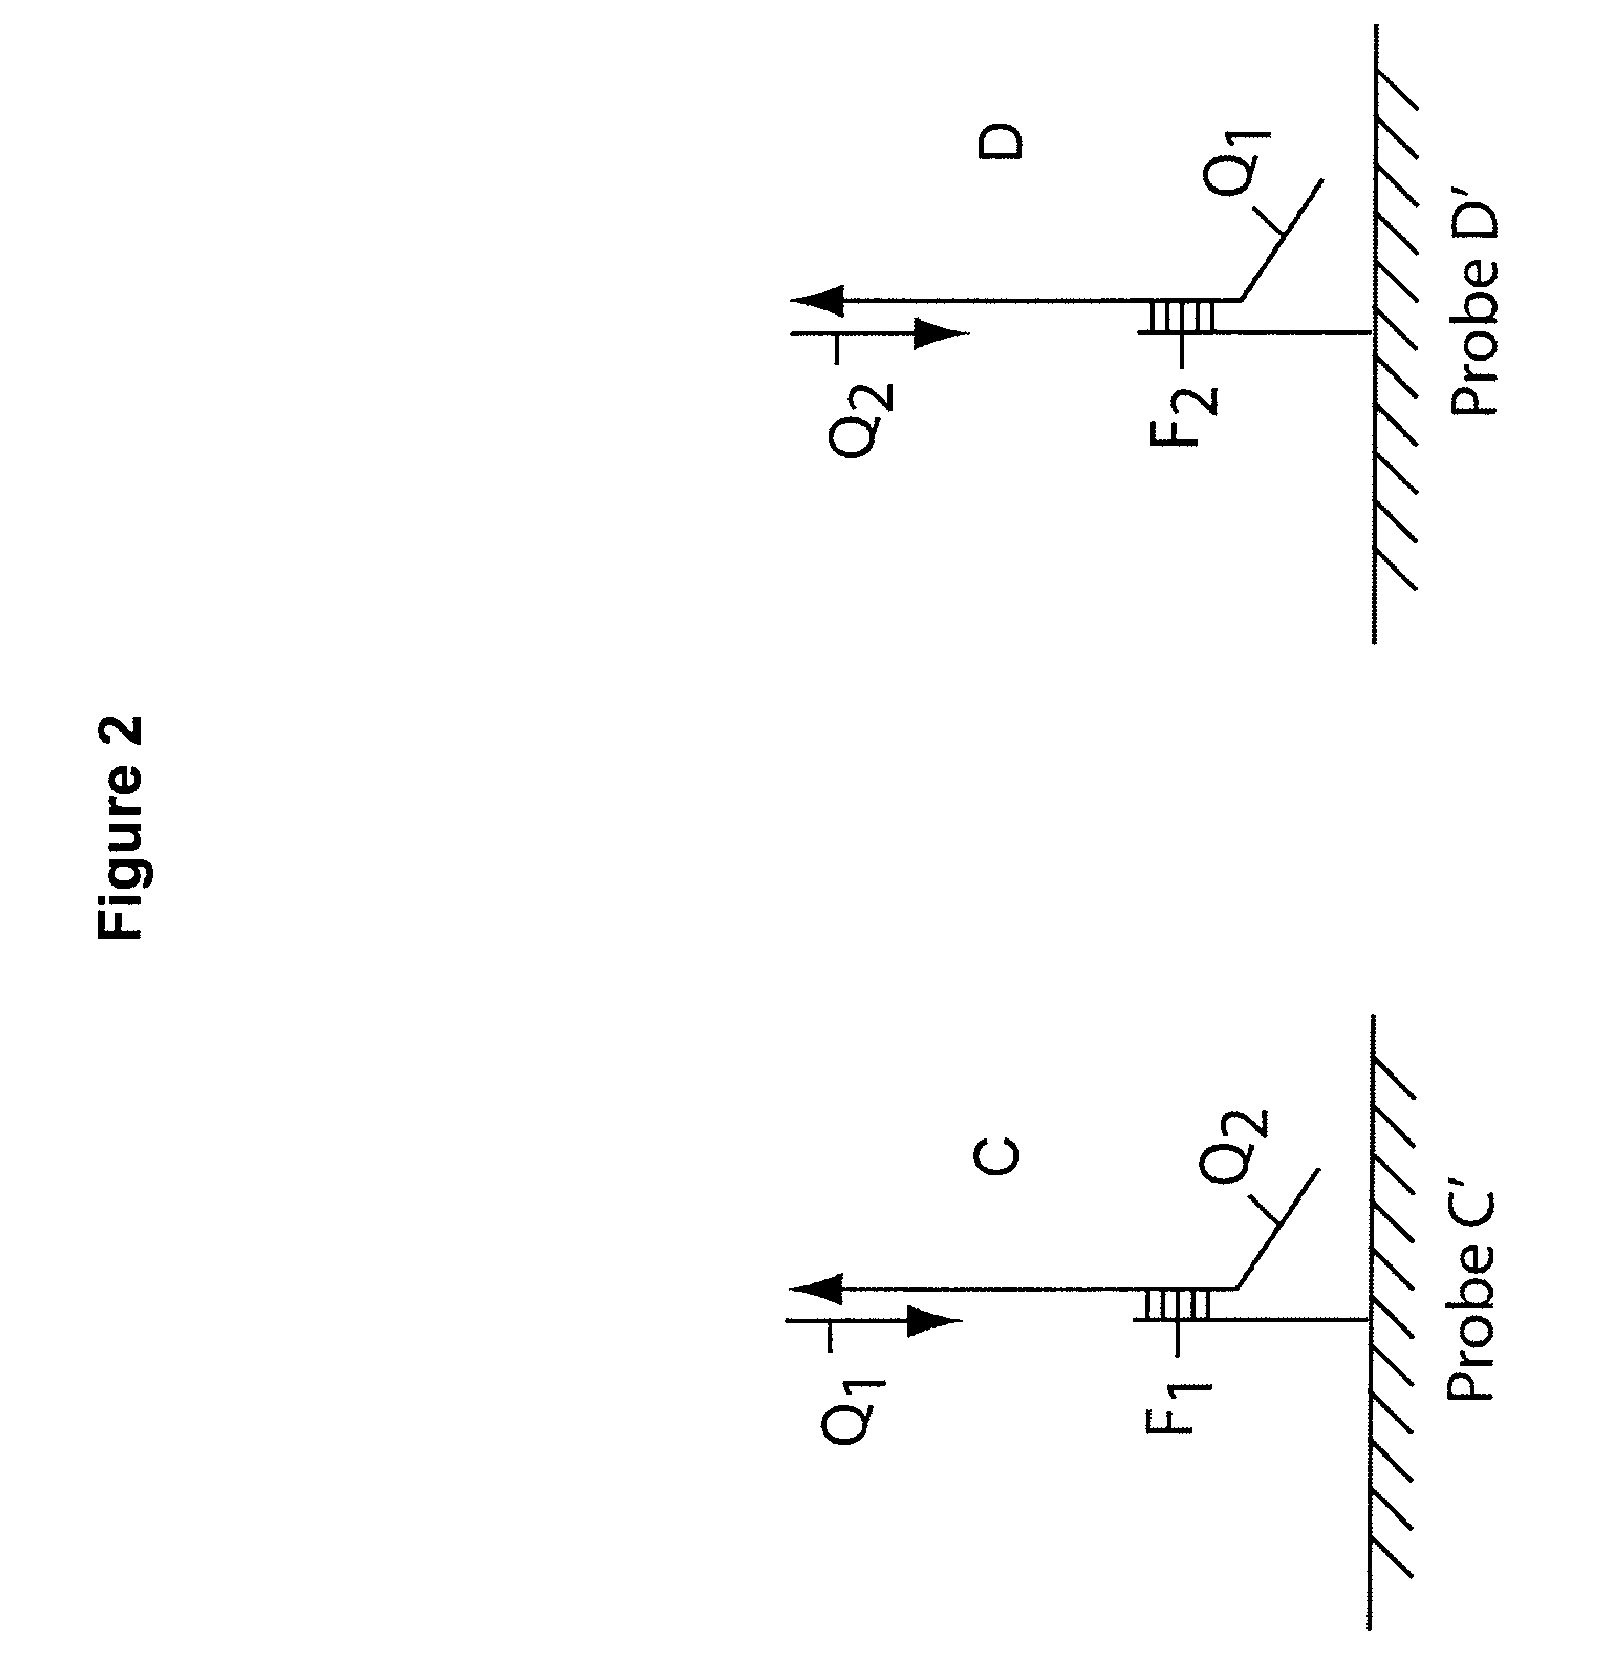
Multiplex Q-PCR arrays
a q-pcr array and array technology, applied in the field of multi-dimensional q-pcr arrays, can solve the problems of affecting the replication process, and the number of different nucleic acid sequences that can be simultaneously amplified and detected is very limited, and achieves the obstacle of real-time multiplexing of q-pcr
- Summary
- Abstract
- Description
- Claims
- Application Information
AI Technical Summary
Benefits of technology
Problems solved by technology
Method used
Image

Examples
example 1
[0252]This example demonstrates the use of a real-time microarray to measure the binding of multiple analytes to multiple probes.
[0253]FIG. 15 shows the layout of a 6×6 DNA microarray. Three different DNA probes (1, 2, and Control) with three different concentrations (2 μM, 10 μM, and 20 μM) are spotted and immobilized on the surface as illustrated. The probes contain a single Cy3 fluorescent molecule at the 5′ end. The DNA targets in this experiment contain a quencher molecule. The analyte binding in this system results in quenching of fluorescent molecules in certain spots. FIG. 16 shows a few samples of the real-time measurements of the microarray experiment wherein the control targets are added to the system. As illustrated in FIG. 16, the spots are quenched due to analyte binding.
[0254]FIGS. 17-20 each show data for 4 different spots with similar oligonucleotide capturing probes. The target DNA analyte is introduced in the system at time zero and quenching (reduction of signal)...
example 2
[0256]This example provides a derivation of an algorithm, and the use of the algorithm to determine analyte concentration, such as amplicon concentration, from a real-time binding data. The derivation proceeds as follows:
[0257]Assume that the hybridization process starts at t=0, and consider discrete time intervals of the length Δt. Consider the change in the number of bound target molecules during the time interval (iΔt, (i+1)Δt). We can write
nb(i+1)−nb(i)=[nt−nb(i)]pb(i)Δt−nb(i)pr(i)Δt,
where nt denotes the total number of target molecules, nb(i) and nb(i+1) are the numbers of bound target molecules at t=iΔt and t=(i+1)Δt, respectively, and where pb(i) and pr(i) denote the probabilities of a target molecule binding to and releasing from a capturing probe during the ith time interval, respectively. Hence,
[0258]nb(i+1)-nb(i)Δt=[nt-nb(i)]pb(i)-nb(i)pr(i).(1)
[0259]It is reasonable to assume that the probability of the target release does not change between time intervals, i....
PUM
| Property | Measurement | Unit |
|---|---|---|
| temperature | aaaaa | aaaaa |
| roughness | aaaaa | aaaaa |
| roughness | aaaaa | aaaaa |
Abstract
Description
Claims
Application Information