Portable raman diagnostic system

a diagnostic system and portable technology, applied in the field of portable raman diagnostic systems, can solve the problems of affecting the accuracy of raman diagnostics, so as to reduce the size and weight

Active Publication Date: 2017-05-30
MASSACHUSETTS INST OF TECH
View PDF93 Cites 18 Cited by
  • Summary
  • Abstract
  • Description
  • Claims
  • Application Information

AI Technical Summary

Benefits of technology

[0005]The present invention relates to an integrated approach utilizing a process of eliminating the uninformative or spurious spectral regions which simultaneously removes the necessity for a full spectrograph-CCD system. This approach enables the use of a portable Raman diagnostic system, having significantly reduced size and weight (less than 20 lbs and preferably less than 10 lbs) while retaining the required sensitivity.
[0008]An important consideration then is how many and which of the spectral bands (also known as wavelength intervals) facilitate accurate prediction. In other words, as large portions of the full spectrum contains spurious information detrimental to the analysis, it is important to select the appropriate wavelength intervals. Addition of uninformative zones also gives rise to more loading vectors / principal components, which tend to incorporate irrelevant sources of variance and noise thereby reducing the efficacy of the system.
[0009]A preferred embodiment of the present invention uses wavelength interval selection based on non-linear representation, such as support vector regression. The wavelength selection protocol is based on the minimization of cross-validation error in the training data. This outperforms wavelength selection in typical linear methods such as partial least squares and principal component regression. The present method computes the spectral window(s) or regions of the Raman spectrum where the effects of potential interference with respect to the analyte of interest are minimized. This method also optimizes the selection of spectral bands as opposed to selecting individual (and often isolated) spectral points (pixels). Any vibrational and rotational spectra give Voigt profiles that typically have a full width at half maximum (FWHM) of at least 4-8 cm−l. The existence of such intrinsic spectral intervals leads to the selection of minimum spectral band size. The application of the preferred method leads to a significant reduction in number of wavelengths that need to be sampled (upward of three-fold as compared to full spectrum analysis) for the development of an accurate calibration system. This reduction can be partly attributed to the chemical specificity of Raman spectroscopy, which allows the detection of molecules by sampling a limited number of wavelengths. In addition, it has been found that the prediction accuracy and robustness are enhanced as a result of the wavelength selection procedure.
[0013]A preferred embodiment can include a plurality of excitation sources and a single detector channel. The excitation can be performed by a sweeping source (e.g. polygon mirror scanner sweeping source, Fabry-Perot tunable filter sweeping source, AOTF-based sweeping source) while the detection can be through a single bandpass filter and photodetector. The sweeping source can cycle through a set of pre-assigned excitation frequencies to provide the different wavenumber bands at the defined wavelength range of the bandpass filter. The advantage of using tunable excitation instead of tunable detection is that most of the tunable filters are polarization sensitive and it is easier to ensure proper polarization of the laser rather than correcting for the polarized signal obtained after sample scattering. Depending on the application, coupling multiple monochromatic sources such as diode lasers onto the excitation fiber can also provide another embodiment for implementing. It is essential to understand that incorporation of wavelength selection allows the signal acquisition time to be shortened considerably because the instrument has to cycle through (serially) fewer number of spectral channels. Conversely, use of the same signal acquisition time facilitates better signal-to-noise ratio.
[0015]Finally, to accurately analyze a biological sample using a handheld unit, it is critical to collect a large number of backscattered (or transmitted) photons. A preferred embodiment utilizes a reflection geometry, however a transmission Raman system can also be used. To improve the collection efficiency, a compound parabolic concentrator (CPC) lens can be used in conjunction with the fiber-optic probe for delivery and collection of light to and from the sample, respectively. The CPC acts as a reverse angle transformer by collecting light from all angles and converting them to the limited NA (numerical aperture) of the collection fibers. The use of a CPC can enhance collection efficiency between 7-11 times in comparison to using only commercially available fibers. Alternately, hollow core fibers and photonic crystal fibers, which have significantly larger NA than conventional ones, can also be employed. The increase in collection efficiency provides for the application of a handheld instrument for in vivo diagnostics as well as ex vivo histo-pathological analysis. A further embodiment utilizes a compound hyperbolic concentrator that is matched with a lens for light collection from a tissue sample.

Problems solved by technology

It has been found, however, that spurious correlations on the multivariate calibration procedures, especially for implicit schemes (e.g. partial least squares (PLS) and principal component regression (PCR)).
Evidently, the presence of such spurious correlations, which may be caused by temporal (system) drifts or by covariations among sample constituents, which impede calibration transfer by introducing non-analyte specific variances.
Addition of uninformative zones also gives rise to more loading vectors / principal components, which tend to incorporate irrelevant sources of variance and noise thereby reducing the efficacy of the system.

Method used


Image

  • Portable raman diagnostic system
  • Portable raman diagnostic system
  • Portable raman diagnostic system

Examples


Embodiment Construction

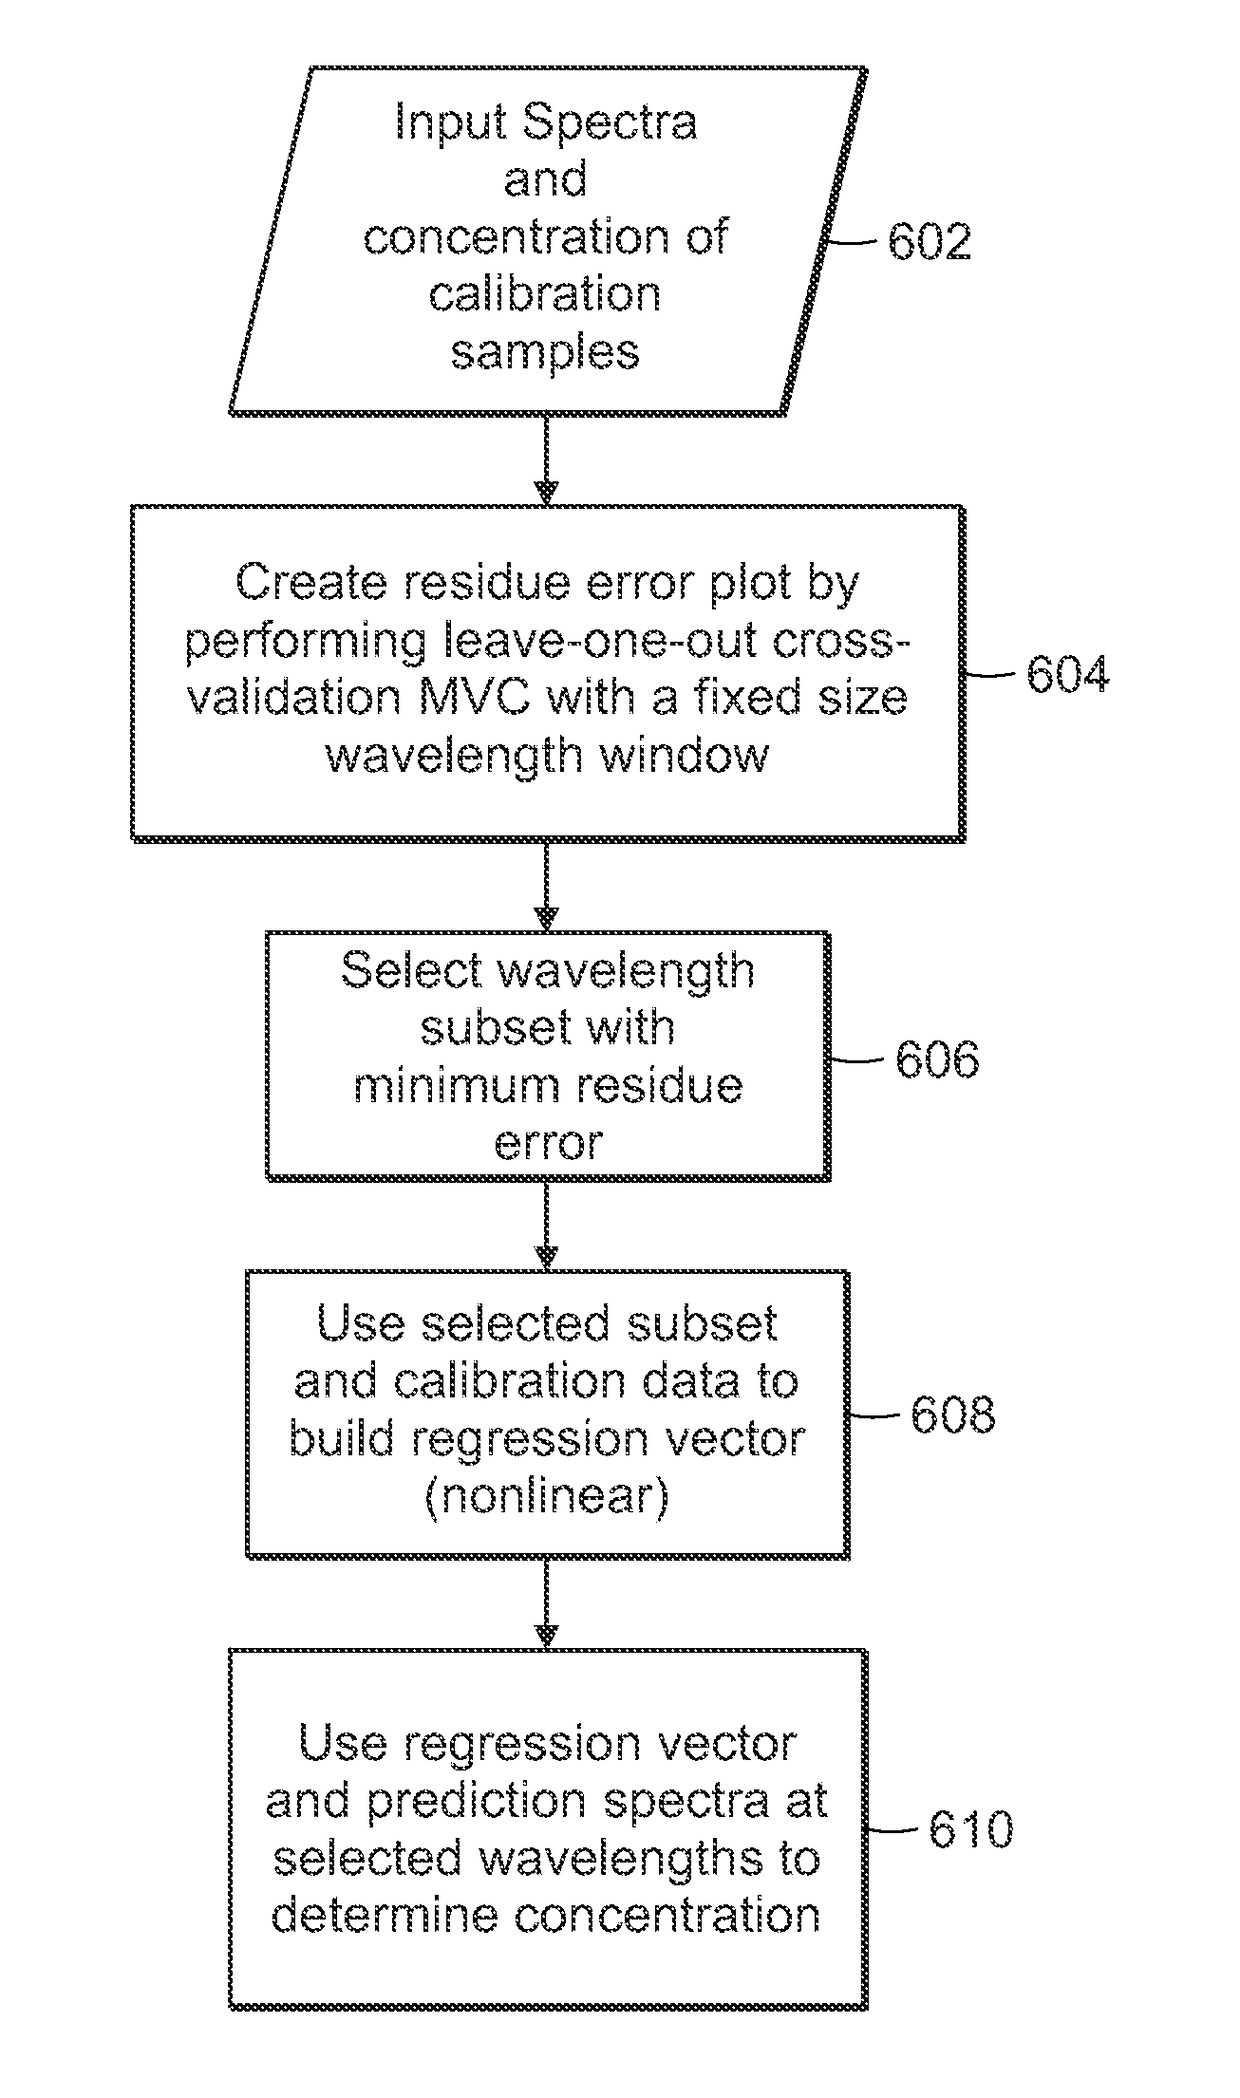
[0050]The present invention relates to portable Raman diagnostic systems utilizing wavelength selection which significantly refine the performance of the multivariate calibration techniques. However, the addition of uninformative spectral regions give rise to more loading vectors / principal components, which tend to incorporate irrelevant sources of variance and noise. An important consideration then is how many and which of the spectral bands (also known as wavelength intervals) facilitate accurate measurement. In other words, as only small portions of the full spectrum contain useful Raman features, it is important to select the appropriate wavelength intervals. Clearly, such selection is also dependent on the rest of the constituents in the sample being measured, because of the resultant spectral overlap which may be observed in certain regions.

[0051]Although existing wavelength selection methods can work in conjunction with any calibration method, such as ordinary least squares (...


PUM

PropertyMeasurementUnit
weightaaaaaaaaaa
weightaaaaaaaaaa
weightaaaaaaaaaa

Abstract

The present invention further relates to the selection of the specific filter combinations, which can provide sufficient information for multivariate calibration to extract accurate analyte concentrations in complex biological systems. The present invention also describes wavelength interval selection methods that give rise to the miniaturized designs. Finally, this invention presents a plurality of wavelength selection methods and miniaturized spectroscopic apparatus designs and the necessary tools to map from one domain (wavelength selection) to the other (design parameters). Such selection of informative spectral bands has a broad scope in miniaturizing any clinical diagnostic instruments which employ Raman spectroscopy in particular and other spectroscopic techniques in general.

Description

CROSS-REFERENCE TO RELATED APPLICATION[0001]This application claims the benefit of U.S. Provisional Application No. 61 / 370,870 filed Aug. 5, 2010 and U.S. Provisional Application No. 61 / 430,733 filed Jan. 7, 2011, the entire contents of which are incorporated herein by reference.STATEMENT REGARDING FEDERALLY SPONSORED RESEARCH OR DEVELOPMENT[0002]This invention was supported, in whole or in part, by NIH Contract No. P4102594. The Government has certain rights in the invention.BACKGROUND OF THE INVENTION[0003]The wealth of information available in Raman spectra has led to accurate quantification of molecular and morphological components embedded in complex biological samples. The great interest in Raman spectroscopy lies in its potential for accurate and real time clinical diagnosis for a wide variety of diseases such as malignant tumors (cancers) and vulnerable arterial plaques (atherosclerosis). In addition, near-infrared (NIR) Raman spectroscopy can be employed for non-invasive ap...

Claims


Application Information

Patent Timeline
Patent Type & Authority Patents(United States)
IPC IPC(8): A61B5/1455A61B5/145G01J3/02G01J3/44G01N21/65A61B5/00
CPCA61B5/14532A61B5/1455G01J3/0208G01J3/0216G01J3/0218G01J3/0272G01J3/44G01N21/65A61B5/4312A61B5/444A61B2560/0223G01N2201/129Y02A90/10
Inventor BARMAN, ISHANDINGARI, NARAHARA CHARIDASARI, RAMACHANDRAFELD, MICHAELKONG, CHAE-RYONKANG, JEON WOONG
Owner MASSACHUSETTS INST OF TECH
Why Eureka
Try Eureka