
Noise analysis to reveal jitter and crosstalk's effect on signal integrity

a noise analysis and crosstalk technology, applied in the field of signal integrity analysis, can solve problems such as underexploitation of the area, data channel malfunction, and increased nois

Active Publication Date: 2017-12-12
TELEDYNE LECROY
View PDF15 Cites 0 Cited by
  • Summary
  • Abstract
  • Description
  • Claims
  • Application Information

AI Technical Summary

Benefits of technology

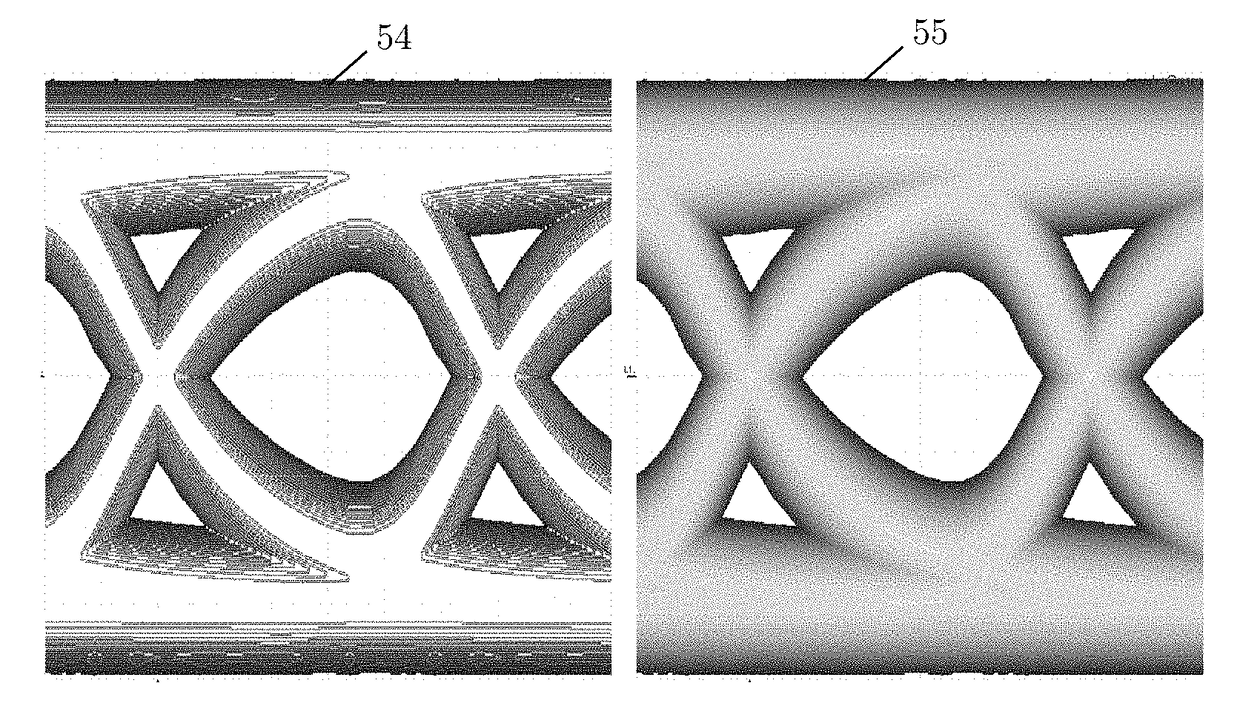
This patent describes a method for analyzing signals by breaking them down into smaller units and capturing the changes in vertical variations over time. This analysis is done by categorizing the signals and capturing the distribution of vertical values in each category. Once significant statistical distributions are captured, a convergent probability distribution function (PDF) map is created, which is a superior eye diagram that compensates for the instrument's noise. Similarly, a probability map is created from the parametrized distributions, which can be used to create the probabilities of the signal under test to impact every coordinate on the eye diagram's space, even extending outside the central region of the eye. An apparatus for implementing this method is also described.

Problems solved by technology

These two dimensions, in which the electronic data channel or clock manifests are equally important and excessive jitter or noise can lead to data channel malfunction.
The two phenomena are actually intertwined as increased noise generally leads to increased jitter, and jitter can result in increased noise.
Some attention has been paid to similar decomposing the noise of the same circuits, but this area has so far been underexploited.
Furthermore as more and more serial data channels are packed into close proximity the issue of “crosstalk” or unwanted interference between circuits has become a recognized problem to be addressed.
There are a number of ways that this unwanted interference can affect and impair the performance, depending on the physics of the interference.
Some “crosstalk” from other signals is understood to be included in the “noise” which can degrade and impair a data channel, and as such is undesirable.
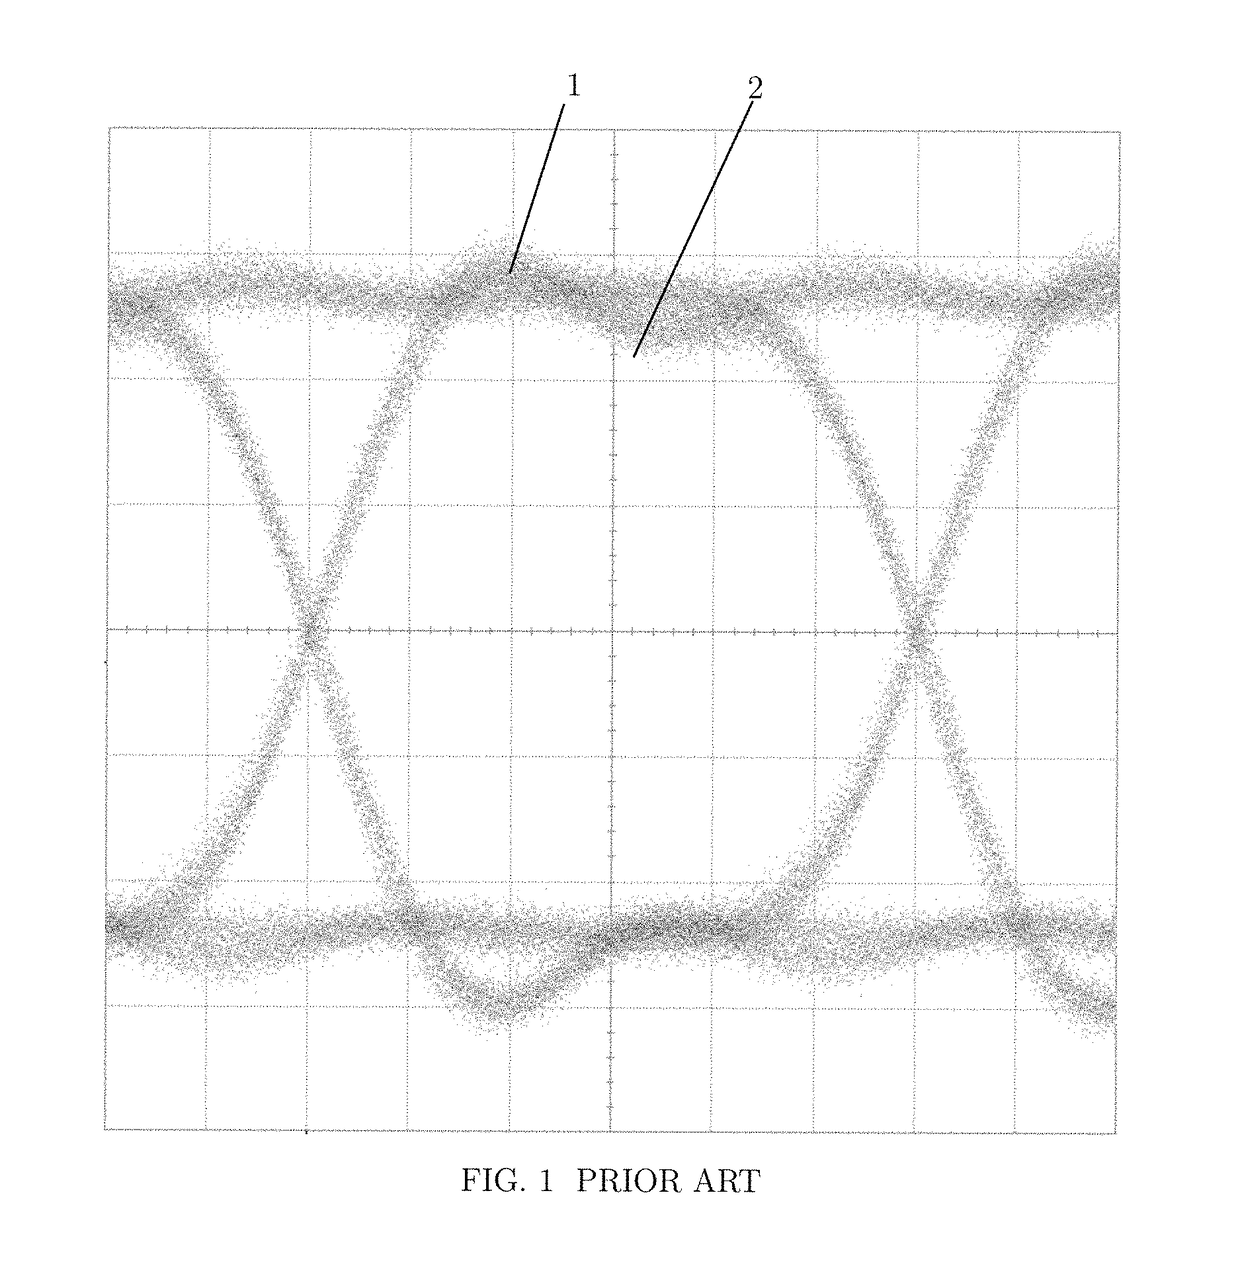
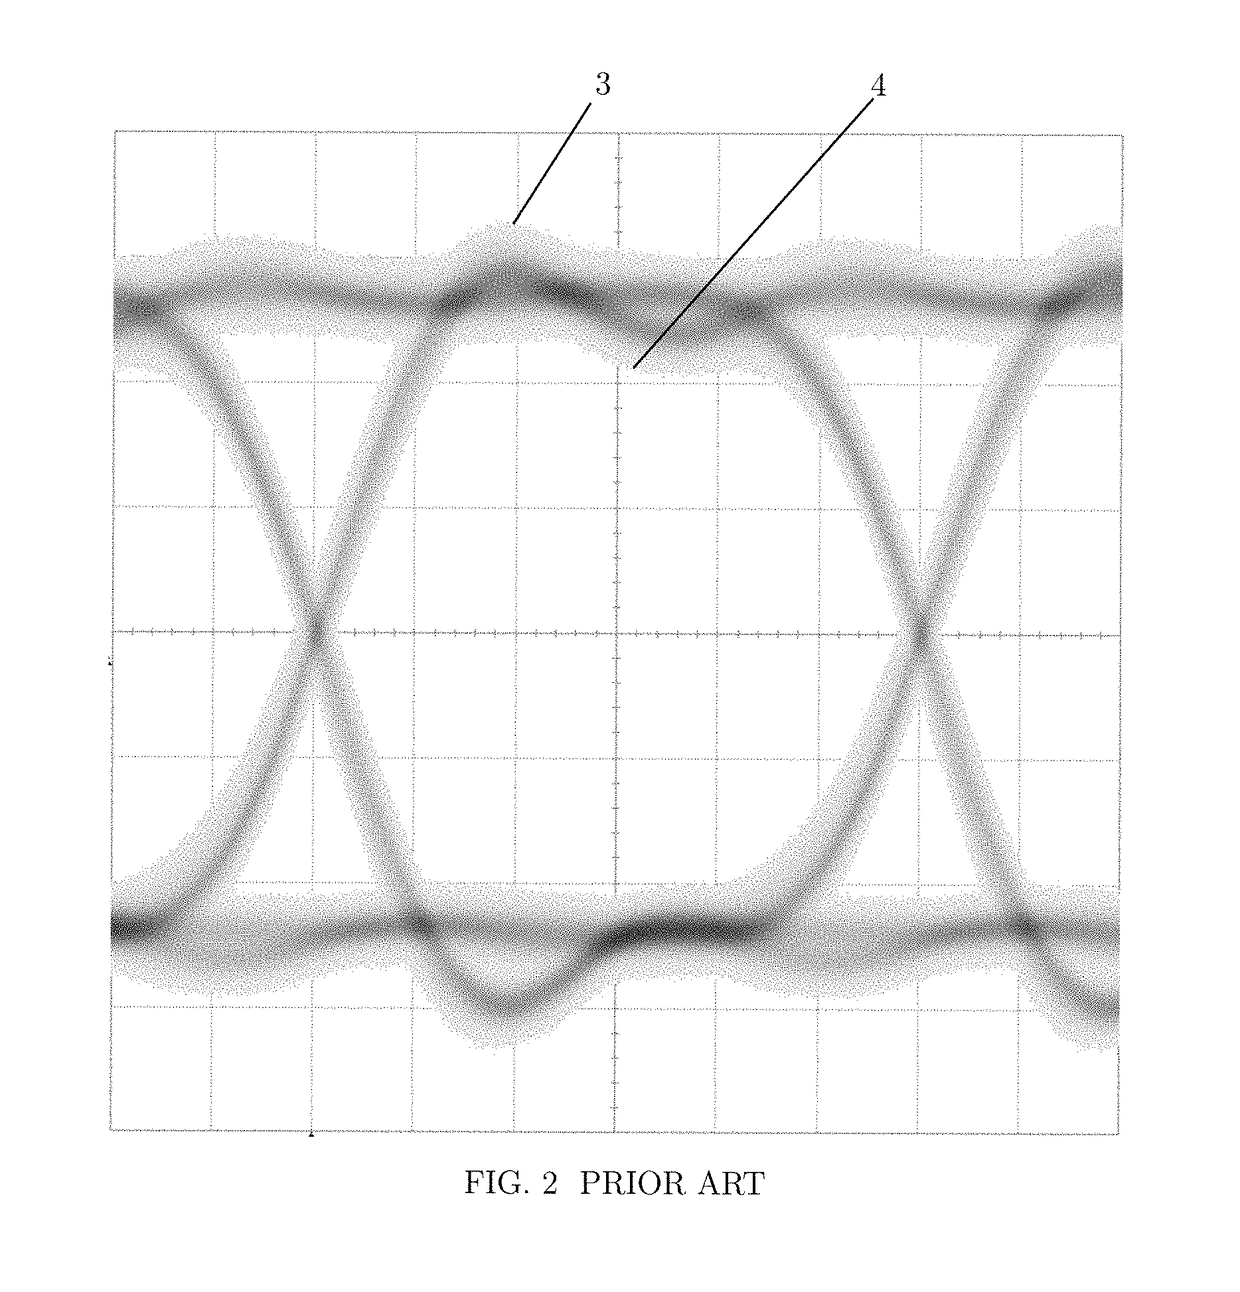
One problem is that they continue to change as more and more data contributes to the eye diagram, and there is no easy way to know when you have “enough” data.
The problem of course, is how much data is needed for a valid mask test, because the probability of a mask violation depends on how many chances the signal under test is given to violate the mask.
For oscilloscopes these methods suffer from ambiguity in calculating probabilities from an already formed eye.
In particular in the region of the contributions from rising edges and falling edges contributions to the eye diagram make it impossible to know if the trajectory of the signal under test that produced that point was earlier or later.
Furthermore in an already formed eye diagram, the separation of vertical (noise) contributions from horizontal (jitter) is not possible.
For example, if one wanted to compensate the eye diagram for the contribution of the measuring instrument's inherent noise, one cannot.
This same shortcoming applies, in that the noise and jitter inherent in the instrument cannot be effectively removed from such a contour plot.
In general, in current SI analysis, there is no way to independently analyze the spectrum on time-domain of “only” the non-deterministic part of the noise, without the spectrum of the signal itself present in the spectrum.
However these methods only supply the shape or trajectory of the signal under test, either as a function of position within a repeating sequence of test data, or as defined by the surrounding local sequence of data states.

Method used


Image

  • Noise analysis to reveal jitter and crosstalk's effect on signal integrity
  • Noise analysis to reveal jitter and crosstalk's effect on signal integrity
  • Noise analysis to reveal jitter and crosstalk's effect on signal integrity

Examples


Embodiment Construction

[0048]For the purposes of this application, the procedures for acquiring digital waveforms, subtracting them if they are differential (i.e. much as the implicit electronic “receiver” would effectively subtract the differential analog counterparts), the detection of transitions for either clock or data, clock data recovery (CDR), digital resampling and are all understood as procedures well known in the prior state of the art. As such these methods do not require further detailed descriptions.

[0049]The three basic steps of a particular embodiment of the preferred embodiments are shown in FIG. 3. Here we see a first step [5] consisting of the acquisition and analysis of waveforms to produce a database of histograms followed by a second step [6] consisting of the analysis of the database of histograms to produce a 2D PDF object [33], a 2D CDF object [34] and a set of mean values followed by a final step [7] consisting of the generation of displays from the 2D CDF object [34], 2D PDF obj...


PUM


Abstract

A method and apparatus for generating a probability density function eye are provided. The method preferably includes the steps of acquiring an input waveform, performing a clock data recovery in accordance with the input waveform to determine one or more expected transition times and defining a plurality of unit intervals of the input waveform in accordance with the one or more expected transition times. One or more values of one or more data points may then be determined in accordance with the input waveform in accordance with the one or more expected transition times, and a category for each unit interval in accordance with its state and its position within the input waveform may also be determined. One or more histograms may then be generated for the determined one or more values for each category of unit intervals.

Description

CROSS REFERENCE TO RELATED APPLICATIONS[0001]The present application is a continuation of U.S. patent application Ser. No. 13 / 739,106, filed Jan. 11, 2013 by Miller, entitled NOISE ANALYSIS TO REVEAL JITTER AND CROSSTALK'S EFFECT ON SIGNAL INTEGRITY, currently allowed, which in turn claims the benefit of i) U.S. Provisional Patent Application 61 / 586,341, filed Jan. 13, 2012 titled “Noise Analysis to reveal Crosstalk's effect on overall “Signal Integrity”” to Miller; and ii) U.S. Provisional Patent Application 61 / 586,348, filed Jan. 13, 2012 titled “Noise Analysis to reveal Crosstalk's effect on overall “Signal Integrity”” to Miller, the contents of these applications being incorporated herein by reference.FIELD OF THE INVENTION[0002]The invention concerns the analysis of Signal Integrity in the field of digital data communication and digital electronics in general. Specifically within this field, the invention concerns jitter, noise and crosstalk analysis and is related to a method ...

Claims


Application Information

Patent Timeline
Patent Type & Authority Patents(United States)
IPC IPC(8): H04B17/23H04L7/033H04B17/21H04L7/00H04B3/487
CPCH04B17/23H04L7/0331H04B17/21H04L7/0029H04B3/487H04L1/205
Inventor MILLER, MARTIN T.
Owner TELEDYNE LECROY
Learn More