Control method of mass spectrometer and spectrometer
A control method and mass spectrometer technology, which is applied in the control of mass spectrometers and in the field of mass spectrometers, can solve the problems of shortened filament life and increased power consumption, and achieve the effects of reducing power consumption and suppressing life shortening
- Summary
- Abstract
- Description
- Claims
- Application Information
AI Technical Summary
Problems solved by technology
Method used
Image
Examples
Embodiment 1
[0128] Figure 9 It represents the mass spectrometer 1 in this embodiment and the existing mass spectrometer (refer to Figure 8 ) is a graph of the power consumption when performing the specified operation. The vertical axis of the graph represents the magnitude of power consumption (W).
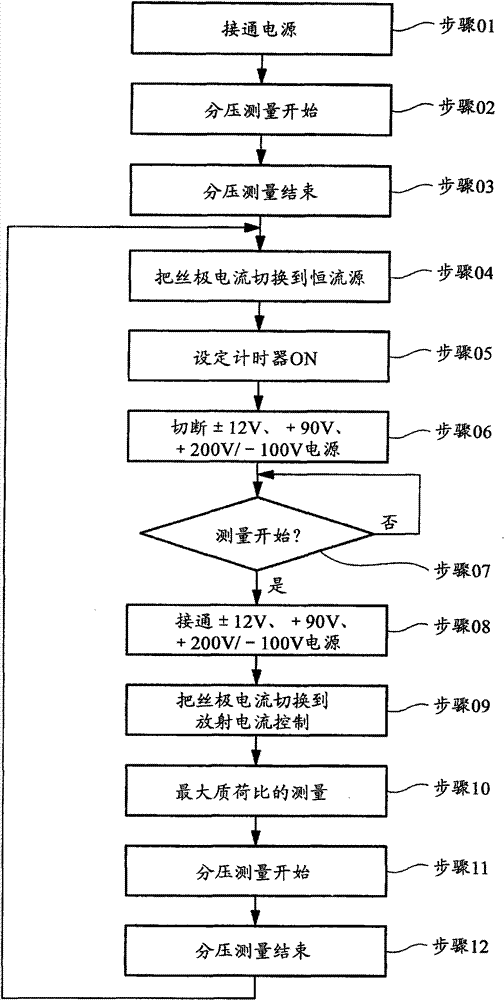
[0129] Figure 9 (1) shows the magnitude of power consumption in a state where partial pressure measurement is performed in the mass spectrometer 1 of the present embodiment and a conventional mass spectrometer. All the power supplies in the power supply circuit part 36 are +12V power supply 36a, ±12V power supply 36b, +5V power supply 36c, +200V / -100V power supply 36d and +90V power supply 36e (in the existing mass spectrometer, these power supplies are respectively The corresponding power supplies) are all in the on state. The power consumption at this time is about 25W. The mass spectrometer 1 of the present embodiment has no difference in power consumption when performing partial p...
Embodiment 2
[0134] Next, a comparative example of the above-mentioned embodiment will be described.
[0135] In this embodiment, instead of performing step 10 (the action of continuously measuring the maximum mass-to-charge ratio) of the above-mentioned embodiment, the mass-to-charge ratio is incremented by 1 each time from 1 to 100 to perform continuous measurement. Each measurement time is about 18 seconds, and the number of measurements is 100 times. At this time, it takes about 30 minutes for the temperature around the detection circuit to rise to about 37°C.
[0136] Compared with the case where the mass-to-charge ratio is set to the maximum mass-to-charge ratio, it takes about 25 minutes longer for the temperature around the detection circuit to rise to the same level as that in the above-mentioned embodiment. It can be seen that the mass-to-charge ratio in step 08 is preferably as large as possible, most preferably set to the maximum mass-to-charge ratio for measurement.
Embodiment 3
[0138] Next, a comparative example of the above-mentioned embodiment will be described.
[0139] Figure 10 and Figure 11 It is a graph showing the time change of the ion current value (A) when the partial pressure measurement is performed by the mass spectrometer having the configuration of the above-mentioned embodiment.
[0140] Figure 10 is a graph when the current is not supplied to the filament 41 during the measurement of the divided voltage is not performed. Figure 11 is a graph when a constant current of 1 A is supplied to the filament 41 during the measurement of the divided voltage is not performed. exist Figure 10 and Figure 11 , the vertical axis is the ion current value (A), and the horizontal axis is the time (minutes) after the start of partial pressure measurement. Ion current values for various ions are shown in the figure. Such as Figure 10 and Figure 11 As shown, as a result of the partial pressure measurement, H 2 (thick solid line), H ...
PUM
 Abstract
Description
Claims
Application Information
 - R&D
- Intellectual Property
- Life Sciences
- Materials
- Tech Scout
- Unparalleled Data Quality
- Higher Quality Content
- 60% Fewer Hallucinations
Browse by: Latest US Patents, China's latest patents, Technical Efficacy Thesaurus, Application Domain, Technology Topic, Popular Technical Reports.
© 2025 PatSnap. All rights reserved.Legal|Privacy policy|Modern Slavery Act Transparency Statement|Sitemap|About US| Contact US: help@patsnap.com


