

Monitoring and orientation system of pollution sources of electrical energy quality
A power quality and directional system technology, applied in the direction of measurement using digital measurement technology, spectrum analysis/Fourier analysis, etc., can solve the problem of not being able to guide and determine the optimal control location of power quality, affecting the normal operation of other loads, and hindering normal operation To achieve the effect of improving the power supply quality of the power grid, good online application capabilities, and avoiding large-scale transmission
Active Publication Date: 2010-06-30
FUJIAN ELECTRIC POWER TEST & RES INST +1
View PDF0 Cites 17 Cited by
- Summary
- Abstract
- Description
- Claims
- Application Information
AI Technical Summary
Problems solved by technology
However, the simple monitoring of power quality indicators only gives the sum of the impact of multiple compliances on the power grid, and cannot point out the source of power quality pollution, nor can it guide the determination of the optimal location for power quality control
[0004] An important indicator of power quality - flicker, which means that voltage fluctuations hinder the normal operation of other electrical equipment connected to the common connection point, that is, when the parameters of large-capacity loads change periodically, it will cause node voltage fluctuations or flicker, and spread in the power supply system, affecting the normal operation of other loads
Since the public connection point is often connected to multiple power loads, simply monitoring the voltage of a single node can only assess the severity of voltage fluctuations or flicker, and cannot determine the source of flicker interference
The flicker model used in the current research work basically follows the relevant standards of the IEC. It is believed that the flicker is caused by the modulation of the voltage amplitude. In the disturbed operating environment, the current of the constant load also fluctuates, and flicker caused by sub-harmonics and inter-harmonics, and flicker caused by harmonic voltage modulation also exist. Therefore, the positioning characteristics are simply extracted from the voltage amplitude modulation model. Calculating flicker intensity is not enough
[0005] The traditional monitoring of power quality is mainly aimed at the monitoring of harmonic pollution sources, mainly using the critical impedance method and power flow method. The critical impedance method is based on theoretical assumptions, it is difficult to obtain actual parameters, it is not convenient for online application, and has no practical value
Now the power flow method is often used, which is based on the assumption that "the pollution source is to transmit energy outward". In fact, in a complex multi-harmonic source power supply network, the linear load simply consumes without injecting harmonic power, but Harmonic sources may absorb harmonic power, which is prone to "missing judgment", so "whether to inject harmonic power into the network" cannot be used as the basis for judging harmonic sources
Method used
View moreImage
Smart ImageViewing Examples

Examples
specific example
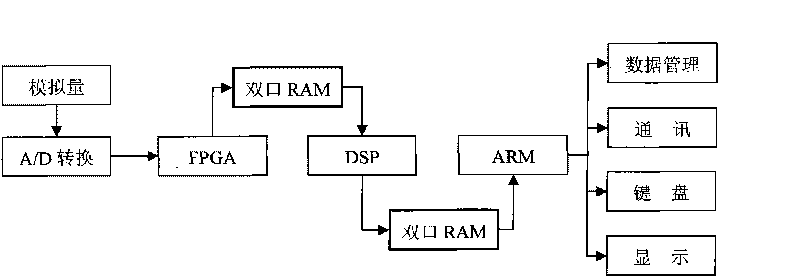
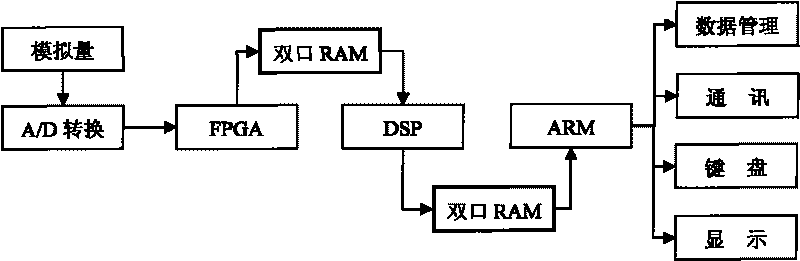
[0091] Collect voltage and current waveform signals;
[0092] Perform FFT calculation on the voltage signal of a fundamental frequency cycle to obtain the amplitude Un and phase of each harmonic; perform FFT calculation on the current signal of a fundamental frequency cycle to obtain the amplitude In and phase of each harmonic;
[0093] Calculate the power factor pf;
[0094] Calculate the harmonic current limit of the load according to the system parameters and the load agreement capacity, and calculate the harmonic impedance Zn for the harmonics whose current exceeds the limit;
[0095] Define and calculate the nonlinearity NLR of the load in the frequency domain;
Login to View More PUM
 Abstract
The invention relates to a monitoring device, in particular to a monitoring and orientation system of pollution sources of electrical energy quality. The system provides monitoring and orientation of flickering pollution sources of an electrical network, realizes conjoint analysis of voltage signals and current signals for the first time, identifies the sources of flickering pollution components contained in load voltage or load current to achieve the technical purpose of flickering pollution orientation, and further provides monitoring and orientation of harmonic pollution sources and monitoring and orientation of sudden rise and sudden drop of voltage. The system realizes the on-line orientation function of the pollution sources of the electrical energy quality for the first time, provides effective centralized processing for a power supply system, avoids large-scale propagation of pollution signals, improves the power supply quality of the electrical network, provides unified standards and a theoretical basis for the solution of the pollution sources of the electrical energy, and has significance for technical development of monitoring and orientation of the pollution sources of the electrical network.
Description
technical field [0001] The invention relates to a monitoring device, in particular to a monitoring and orientation system for power quality pollution sources. Background technique [0002] With the application of a large number of nonlinear power electronic components and the emergence of nonlinear loads, more and more waveform disturbances such as voltage discontinuity, short-term impact, flicker and notch are fed into the system from the user end, which has a negative impact on the power system. interfere with normal operation. In addition, flashover or discharge of insulators caused by lightning strikes, and various faults and oscillations caused by power system equipment may induce power system accidents, cause temporary interruption of power supply, and reduce power supply reliability. [0003] There are many cases of poor power quality, and the sensitivity of users to power quality is also different. With the change of the sensitivity of various electrical equipment t...
Claims
Login to View More Application Information
Patent Timeline
 Patent Type & AuthorityApplications(China)
IPC IPC(8): G01R19/25G01R23/16
Inventor邵振国林焱吴丹岳杨明星陈金祥张榕林黄智敏
OwnerFUJIAN ELECTRIC POWER TEST & RES INST