Analysis method of high resolution nuclear magnetic resonance FID signal

A signal analysis method and nuclear magnetic resonance technology, which are applied in the analysis, magnetic resonance measurement, and measurement using nuclear magnetic resonance spectrum by nuclear magnetic resonance, etc. Problems such as inaccurate width estimation

Inactive Publication Date: 2011-04-20
吴雪梅
View PDF2 Cites 5 Cited by
  • Summary
  • Abstract
  • Description
  • Claims
  • Application Information

AI Technical Summary

Problems solved by technology
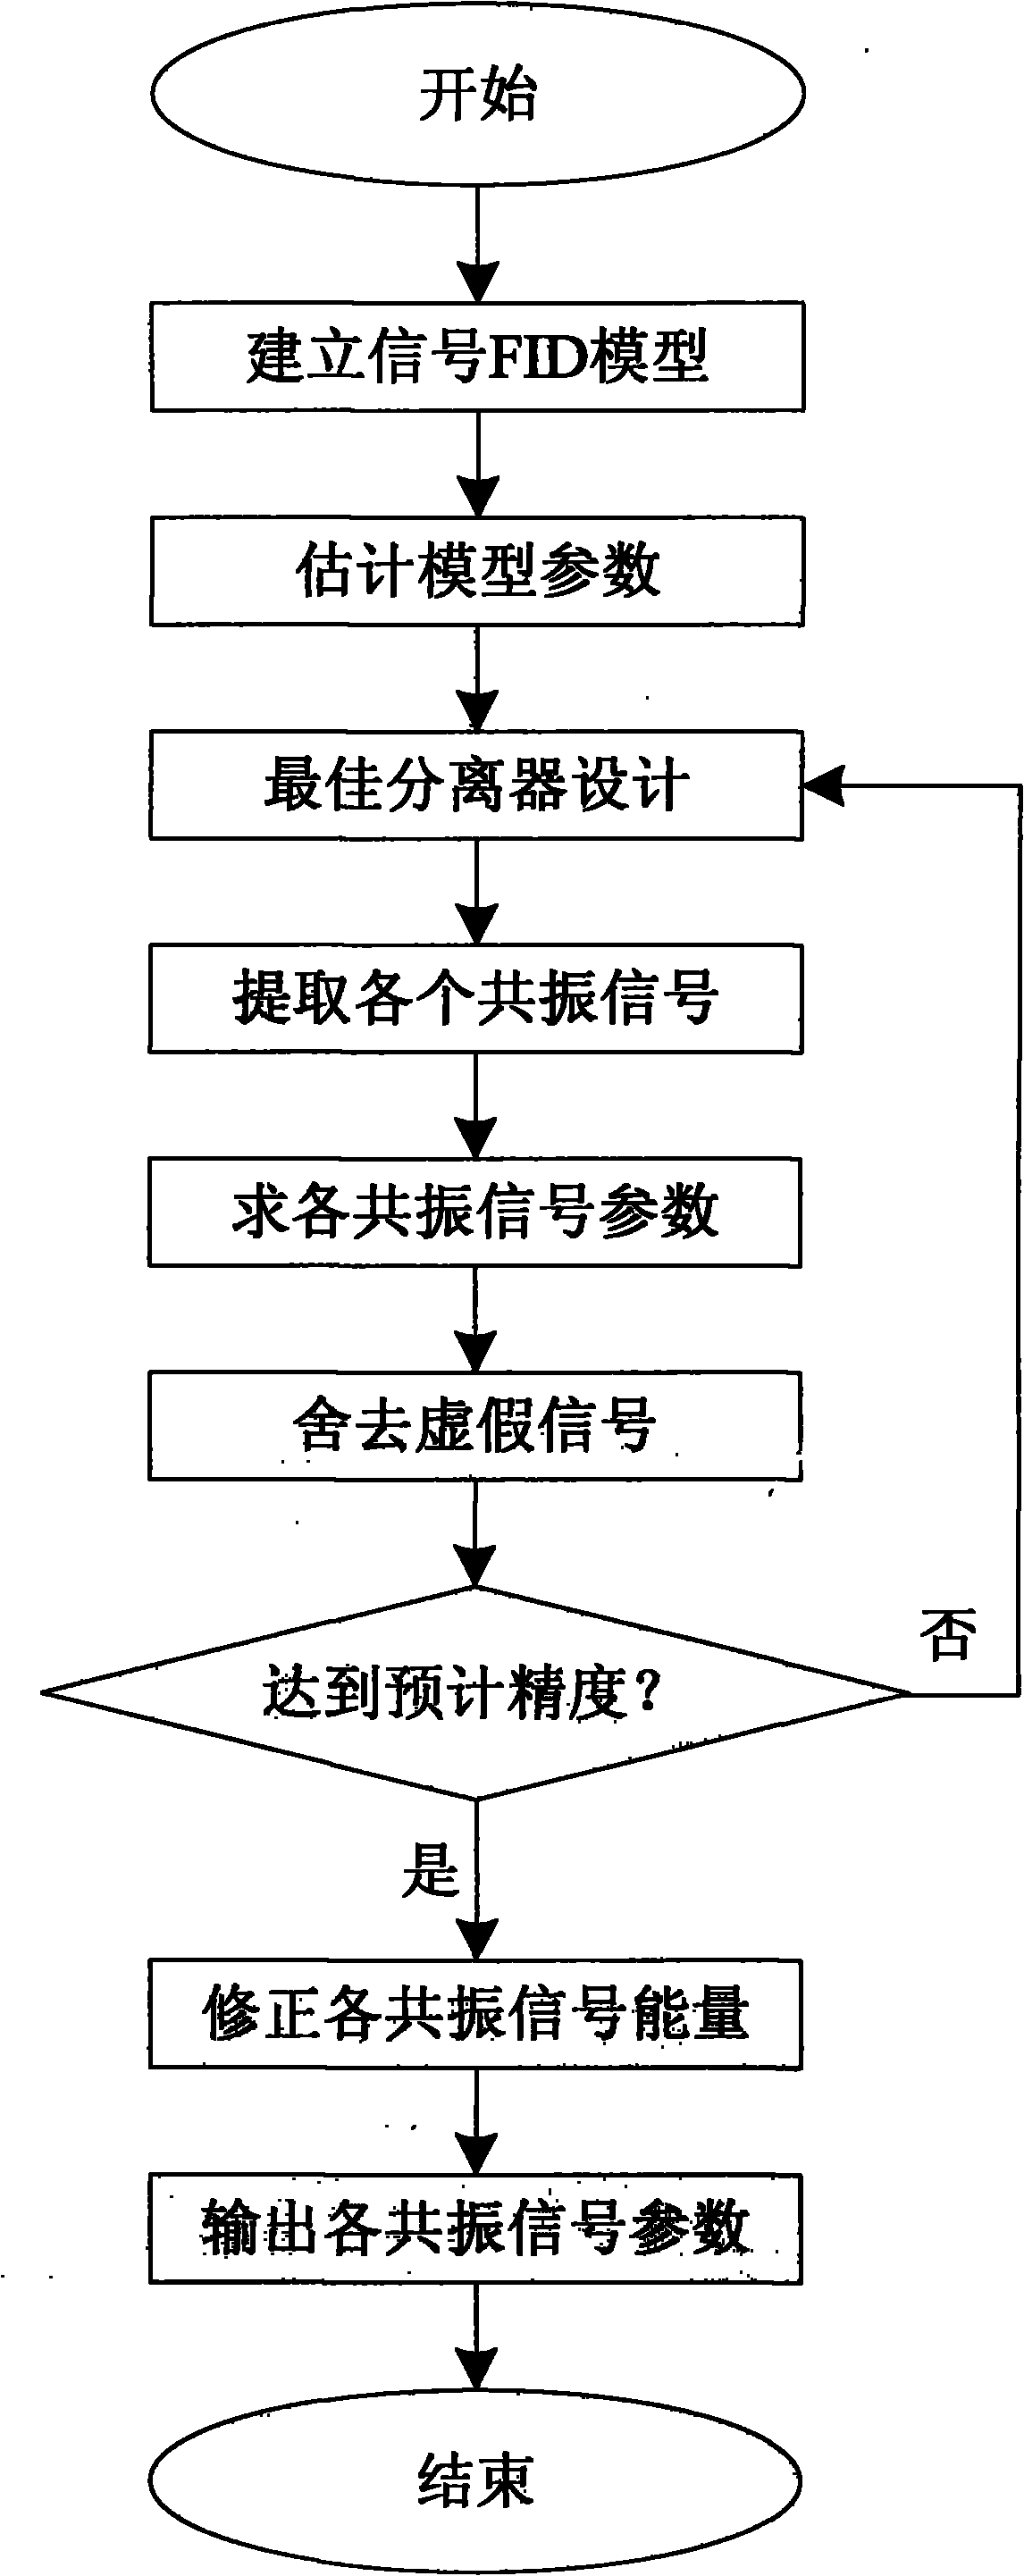
[0010] (1) Due to the existence of relaxation, in the case of multiple resonance peaks, it is difficult to determine the start and end positions of the peaks (theoretically, the spectrum of an exponentially decaying signal occupies the entire frequency domain, but most of the energy is concentrated on the peaks), which cannot be correct Estimated peak area
[0011] (2) Also due to the existence of relaxation, the small peak next to the large peak may not be detected (as shown in the attached Figure 4 shown)
[0012] (3) Due to the existence of multiple peaks, the spectrum overlaps with each other, which may lead to a deviation between the estimated resonance frequency and the true frequency
[0013] (4) Due to the existence of noise, there may be deviations in the estimation of resonance frequency and peak width
[0014] (5) Also due to the presence of noise, small resonance peaks may be overwhelmed (as attached Figure 10 shown)
[0015] (6) Since the sampling time of the resonance signal is not long enough, it may cause an error in the calculation of the resonance peak area
[0016] (7) Although the peak width and T 2 There is a close relationship, but due to the inaccurate estimation of the peak width, it is still not possible to compare T 2

Method used


Image

  • Analysis method of high resolution nuclear magnetic resonance FID signal
  • Analysis method of high resolution nuclear magnetic resonance FID signal
  • Analysis method of high resolution nuclear magnetic resonance FID signal

Examples


Embodiment 1

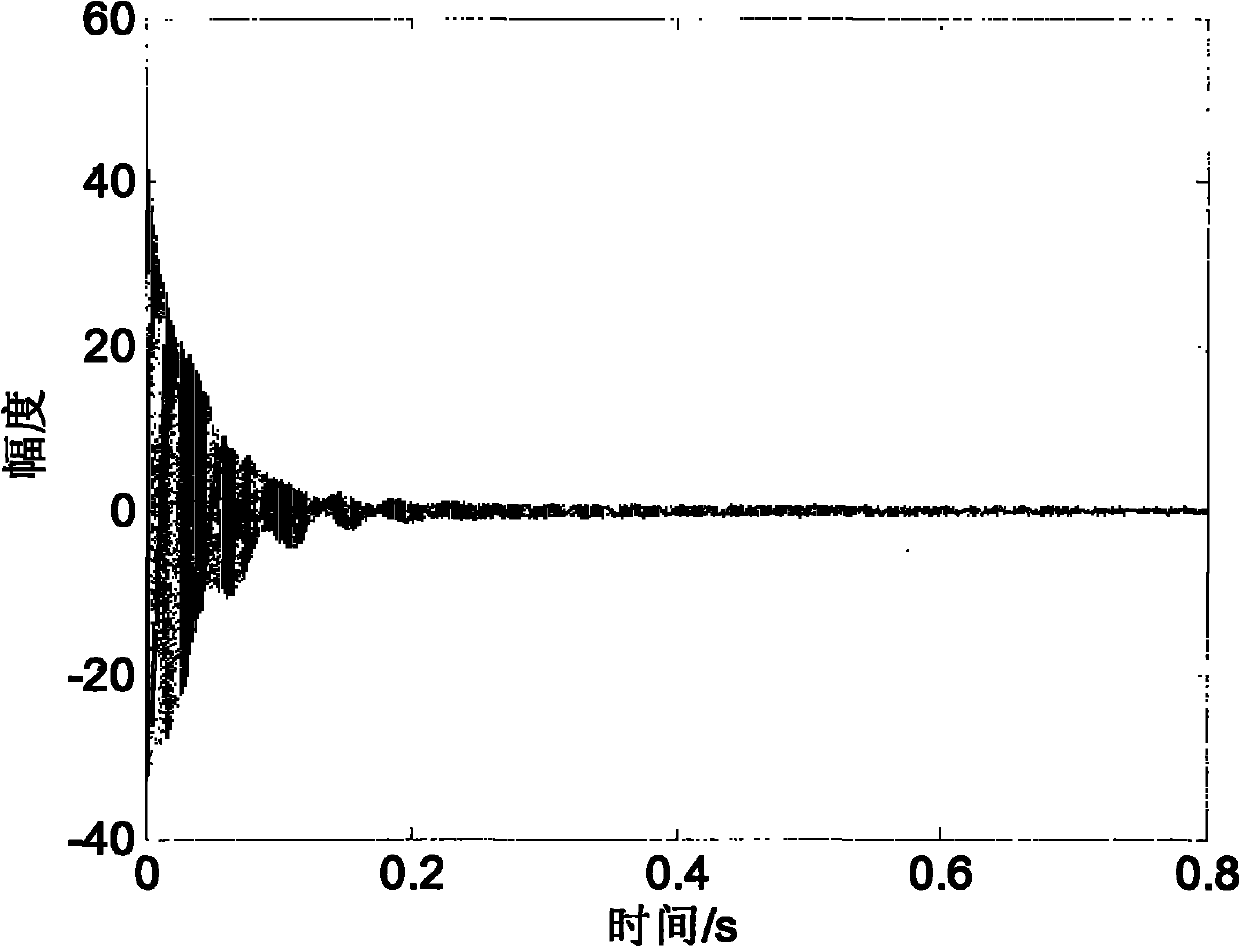
[0051] In this example, the FID signal is composed of four resonance signals, and the parameters of each resonance signal are shown in the design value column of Table 1

[0052] The resonance signal parameter in the embodiment 1 of table 1

[0053]

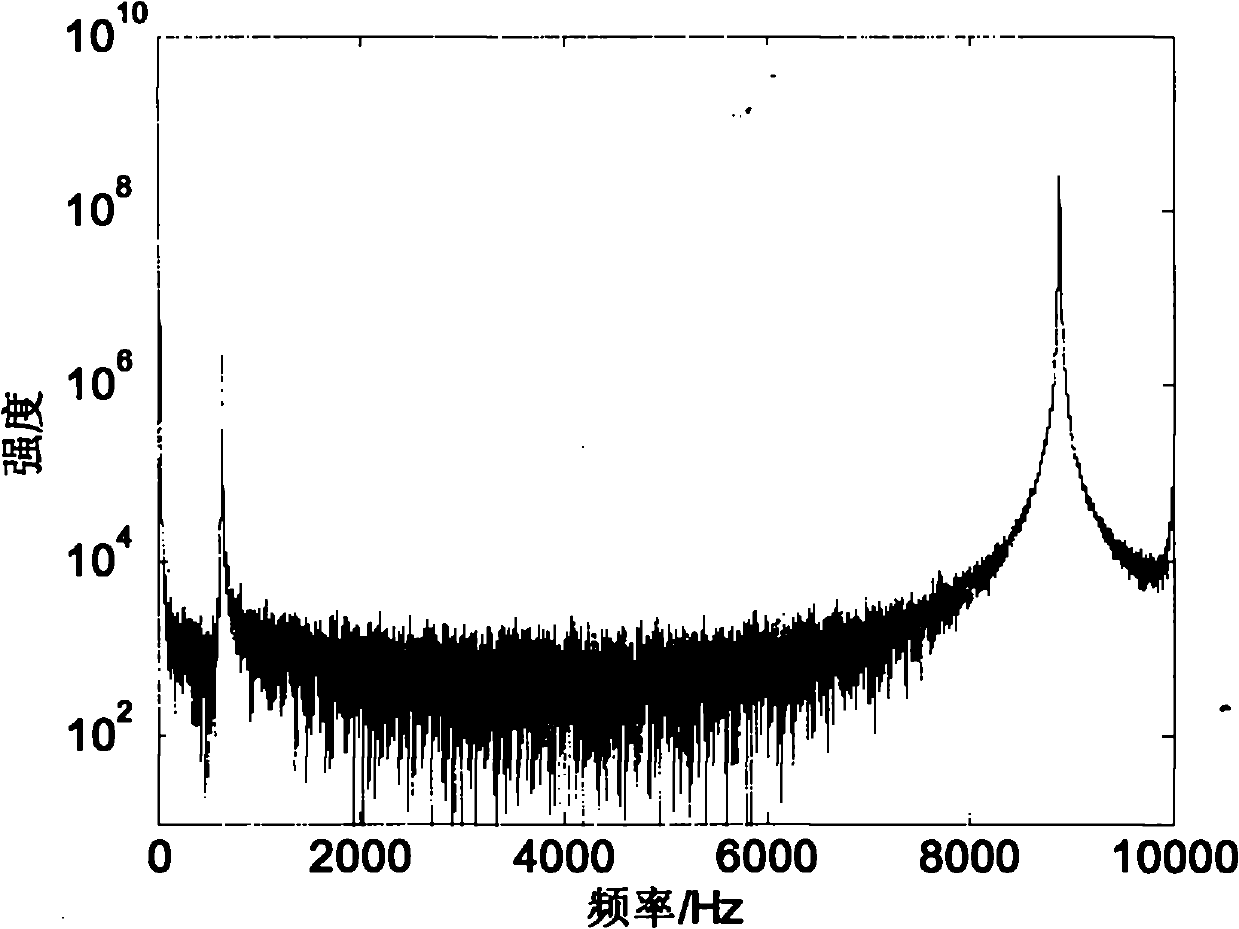
[0054] The NMR signal waveform constructed by the parameters in the above table is as follows: figure 2 As shown, the nuclear magnetic resonance spectrum can be obtained by calculating its power spectrum by fast Fourier transform, such as image 3 shown. From image 3 Three obvious spectral peaks can be clearly seen, which are the spectral peaks of Signal 1, Signal 2, and Signal 4 respectively. Figure 4 It is a partial enlarged view of the NMR spectrum. From the enlarged view, only the spectral peak of signal 4 can be seen, but there is no obvious peak at the frequency of signal 3, indicating that the spectral peak of signal 3 has been submerged in the frequency of signal 4. In the spectral peak, that is, when using tradi...

Embodiment 2

[0057] In this example, the FID signal contains only one resonance signal, and its amplitude is very small. The signal parameters are shown in the design value column of Table 2.

[0058] The resonance signal parameter in the embodiment 2 of table 2

[0059] Resonance Signal Parameters

[0060] The NMR signal waveform constructed by the parameters in the table is as follows: Figure 9 As shown (in order to see the signal clearly, only the waveform of the first 0.2s is given here, Figure 11 The same is true), the calculated NMR spectrum is as follows Figure 10 shown. From Figure 10 It is difficult to find the resonance peaks in the results, so the resonance signal parameters cannot be estimated. Figure 10 The reason why the formant cannot be found in the signal is that the power of the resonance signal is too low, and its formant is completely submerged in the noise. Figure 11 is the resonance signal separated by the present invention. It can be seen from t...


PUM


Abstract

The present invention relates to analysis and treatment of nuclear magnetic resonance (NMR) time-domain free induction decay signal (FID). The resonance signal parameters of FID signal are measured by pre-estimate of parameters, iterative separation and accurate estimate of parameters, and calculation of final result. Compared with traditional Fourier transform method, the method can estimate resonance frequency and peak area of FID signal in high resolution and appear transverse relaxation time, further to achieve correct results at a low ratio of signal to noise.

Description

technical field [0001] The invention relates to the analysis and processing of nuclear magnetic resonance (NMR) free decay signal (FID) in time domain. Background technique [0002] With its unique advantages, nuclear magnetic resonance has been widely used in chemistry, biology, medicine, energy and so on. At present, the application of nuclear magnetic resonance is mainly through the analysis and processing of the inherent characteristic parameters of each nuclear resonance process: chemical shift (resonance frequency), relaxation time (decay constant), peak area (resonance signal energy), etc., and finally obtain useful results. . Obviously, the accuracy of chemical shift, relaxation time and peak area directly affects the accuracy of the final result. Therefore, in order to obtain more accurate processing results, more accurate feature parameters must be used. Existing pulse-Fourier transform nuclear magnetic resonance spectrometers all sample the free decay (FID) sig...

Claims


Application Information

Patent Timeline
Patent Type & Authority Applications(China)
IPC IPC(8): G01N24/08G01R33/46G01R33/465
Inventor 吴雪梅刘志强
Owner 吴雪梅
Why Eureka
Try Eureka