Testing method for eliminating fluorescence internal filtration effects by using corrector formula
A test method and fluorescence technology, which is applied in the directions of fluorescence/phosphorescence, color/spectral characteristic measurement, material excitation analysis, etc., can solve cumbersome problems, achieve the effects of simple operation, time saving, and great promotion and application value
- Summary
- Abstract
- Description
- Claims
- Application Information
AI Technical Summary
Problems solved by technology
Method used
Image


Examples
Embodiment 1
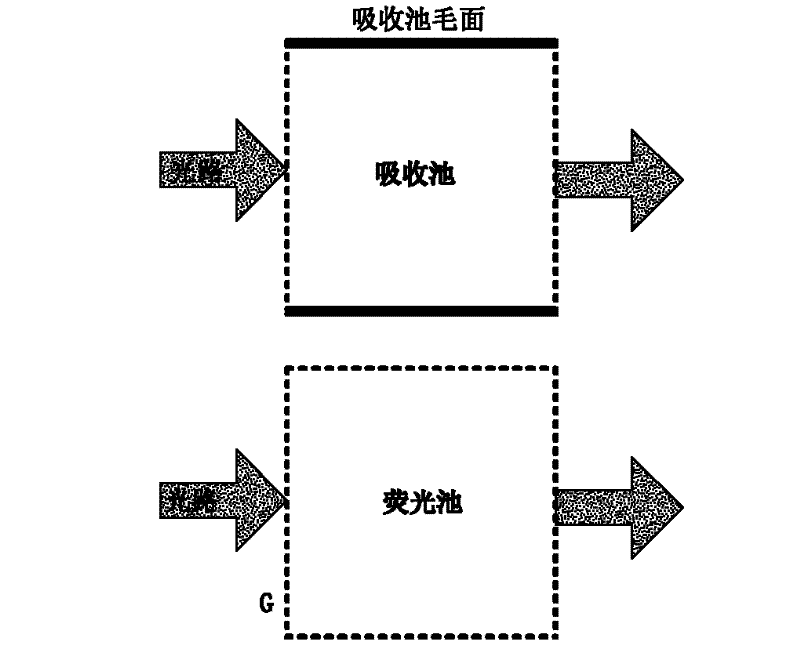
[0019] Put the reference absorption cell and the fluorescence cell used to measure the absorption value (spectrum) of the fluorescent sample into ultrapure water, mark one side of the fluorescence cell, make the marked side face the light source side, and set the UV-Vis The scanning wavelength range of the spectrophotometer, so that it includes the range of the excitation wavelength and the emission wavelength (pre-examined) during the fluorescence test of the sample to be tested, for baseline correction; prepare bovine serum albumin (BSA) solution, tetracycline (TC) solution and a mixture of the two (C BSA =1×10 -6 mol / L, C TC =5×10 -5 mol / L, with a phosphate buffer solution to control the pH to be 7.4), put the prepared sample to be tested in the fluorescence cell, with the marked side facing the light source side, and measure the fluorescence emission spectrum of the BSA+TC mixed solution (excitation Wavelength = 278nm, emission wavelength range 280-500nm, take a data po...
Embodiment 2
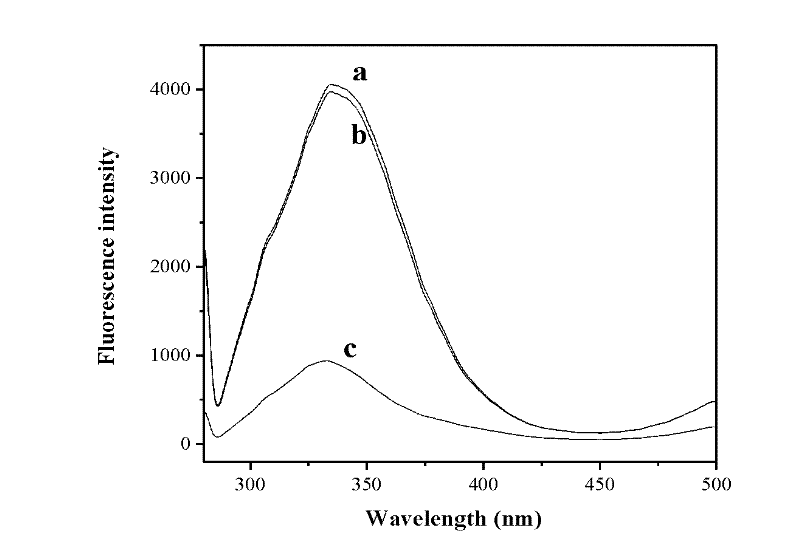
[0023] Similar to the steps in Example 1, baseline correction is performed first. Prepare catalase (CAT) solution, oxytetracycline (OTC) solution and their mixed system (C CAT =1.5×10 -6 mol / L, C OTC =5×10 -5 mol / L, with phosphate buffer to control the pH to 7.4). Fluorescence spectrum (excitation wavelength=274nm, emission wavelength=283-490nm, temperature is 293K) and absorption spectrum (absorption spectrum measurement range is 273-490nm) and fluorescence spectrum of CAT+OTC mixed solution measured by the technical scheme described in embodiment 1 and Emission spectra were corrected. The fluorescence spectrum before correction is Figure 4 In the curve c, the fluorescence spectrum corrected by the technical scheme of the present invention is Figure 4 Curve a in.
[0024] Contrast experiment: the fluorescent spectrum after adopting the routine correction procedure identical with example 1 correction is curve b( Figure 4 ).
[0025] The peak deviation between curve...
PUM
 Abstract
Description
Claims
Application Information
 - R&D
- Intellectual Property
- Life Sciences
- Materials
- Tech Scout
- Unparalleled Data Quality
- Higher Quality Content
- 60% Fewer Hallucinations
Browse by: Latest US Patents, China's latest patents, Technical Efficacy Thesaurus, Application Domain, Technology Topic, Popular Technical Reports.
© 2025 PatSnap. All rights reserved.Legal|Privacy policy|Modern Slavery Act Transparency Statement|Sitemap|About US| Contact US: help@patsnap.com