Wind field visual display method based on three-dimensional virtual globe

A three-dimensional virtual and wind farm technology, applied in the fields of climate sustainability, 3D image processing, image data processing, etc., can solve the problems of insatiability, lack of realism, occupying network bandwidth, etc., and achieve the effect of realistic effect

Active Publication Date: 2014-02-26
STATE GRID CORP OF CHINA +2
View PDF2 Cites 43 Cited by
  • Summary
  • Abstract
  • Description
  • Claims
  • Application Information

AI Technical Summary

Problems solved by technology

[0006] However, the existing wind field visualization technology is generally two-dimensional visualization. Basic methods such as arrow diagrams, wind field distribution maps, streamline maps, and texture maps use abstract elements such as arrows, colors, and lines to analyze wind field data. Description, there is no sense of reality and cannot give ordinary observers an intuitive feeling, and these methods can only simply reflect the instantaneous state of the wind field, and cannot dynamically display its development and evolution process
The particle method can generate more detailed wind field effects and can be displayed dynamically. However, because it needs to track particle trajectories based on wind field data in the early stage, it needs to perform real-time animation rendering of the calculation results in the later stage, which involves a lot of mathematical calculations. As the number increases, the amount of calculation will increase rapidly, which will bring great pressure to the system software and hardware
Moreover, the real wind field changes frequently and involves a large area. Using the particle method to directly visualize the collected raw data will also occupy a large amount of network bandwidth for the data to be transmitted.
Therefore, the traditional particle method is difficult to meet the requirements of dynamically displaying large-area real-time wind field in the 3D digital earth system

Method used


Image

  • Wind field visual display method based on three-dimensional virtual globe
  • Wind field visual display method based on three-dimensional virtual globe
  • Wind field visual display method based on three-dimensional virtual globe

Examples


Embodiment Construction

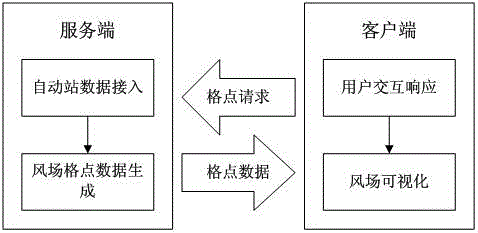
[0045] The present invention provides a wind field visualization display method based on a three-dimensional virtual globe, such as figure 1 shown, including the following steps:

[0046] Step 1. Automatic weather station data access: The server uses the wind speed and direction data of the automatic weather station provided by the Meteorological Bureau as the data source of the wind field data, and regularly imports the automatic weather station data in a data format conforming to the NetCDF specification to ensure that the wind Real-time performance of field visualization;

[0047] Step 2. Gridding of wind field data: The acquired meteorological automatic station data is discrete point data, and the server interpolates the discrete point data of the meteorological automatic station into wind field grid point data according to the visualization area covered by the wind field. The interpolation method adopts The distance inverse ratio method; the weather automatic station dat...


PUM


Abstract

The invention relates to a wind field visual display method based on a three-dimensional virtual globe. The wind field visual display method comprises the following steps of (1) automatic meteorological station data access, wherein automatic meteorological station data provided by the weather bureau serve as a data source of wind field data at a server side, and the automatic meteorological station data are imported at regular times in the data form meeting the NetCDF standard; (2) gridding of the wind field data, wherein the acquired automatic meteorological station data serve as discrete point data, and the server side conducts interpolation on the automatic meteorological station discrete point data according to a visual area covered with the wind field; (3) user interactive response, wherein a client side downloads the wind field grid data at specified time and in specified space from the server side according to user interactive operation; (4) wind filed visualization, wherein the client side drives a particle system according to the downloaded wind field grid data, and wind field visualization is achieved by controlling movement of the particles in three-dimensional space. The wind field visual display method based on the three-dimensional virtual globe is good in display effect, efficient to operate and high in instantaneity.

Description

technical field [0001] The present invention relates to the technical field of visual display of wind field, especially a method of using gridded wind field data to drive a particle system to simulate wind field, display wind field visualization in the form of smoke movement, and simulate multi-level real and fast in a three-dimensional virtual earth environment ( macro, meso, local) wind field methods. Background technique [0002] With the rapid development of science and technology, especially computer technology, traditional visualization technology can no longer meet the rapid improvement of social needs. Computational visualization has become the main means of transforming scientific computing data into graphics or images that are easy for people to understand. In-depth development in the directions of interaction, multi-dimensionality, virtual reality and network applications. [0003] Geographic Information System (GIS), as the best carrier of geographic and environ...

Claims


Application Information

Patent Timeline
Patent Type & Authority Applications(China)
IPC IPC(8): G06T17/05G06T15/00
CPCY02A90/10
Inventor 廖福旺陈金祥陈强林承华林嘉梁曼舒
Owner STATE GRID CORP OF CHINA
Why Eureka
Try Eureka