

Maximum power tracking control method for small permanent-magnet direct-drive wind power generation system
A technology of wind power generation system and maximum power tracking, which is applied in the control of wind turbines, wind power generation, wind turbines, etc. It can solve the problems of poor tracking accuracy, high cost, and errors, so as to improve speed and accuracy and save control costs , Improve the effect of tracking speed
- Summary
- Abstract
- Description
- Claims
- Application Information
AI Technical Summary
Problems solved by technology
Method used
Image

Examples
Embodiment Construction
[0045] The preferred embodiments will be described in detail below in conjunction with the accompanying drawings. It should be emphasized that the following description is only exemplary and not intended to limit the scope of the invention and its application.
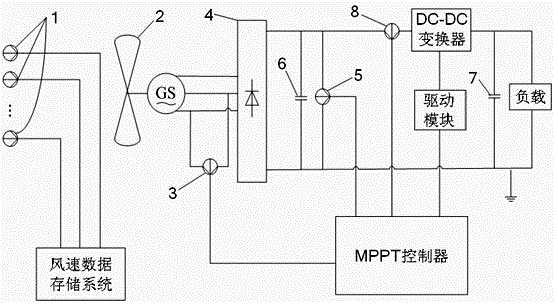
[0046] figure 1 It is a hardware structure diagram of the embodiment of the present invention, wherein the main parameters of the small permanent magnet direct drive wind power generator 2 are: the diameter of the wind wheel is 1.2m, the rated power is 300W, the rated voltage is 24V, the rated speed is 800r / min, and the starting The wind speed is 1m / s, the rated wind speed is 10m / s, and the safe wind speed is 25m / s; the main parameters of the maximum power tracking device are: MPPT controller adopts dsPIC33FJ06GS101 single-chip microcomputer, DC-DC converter adopts Boost circuit, drive module adopts MCP14E3, voltage sensor 5 Choose LV28-P, choose LA25-NP for current sensor 8, use voltage zero-crossing detection type ...
PUM
 Abstract
Description
Claims
Application Information