Optical non-invasive detection method for oxygen saturation of mixed venous blood and oxygen saturation of central venous blood
A technology of central vein and detection method, applied in the field of medical devices, can solve the problems of inability to measure blood oxygen saturation relatively accurately, poor skin penetration, etc.
- Summary
- Abstract
- Description
- Claims
- Application Information
AI Technical Summary
Problems solved by technology
Method used
Image
Examples
Embodiment 1
[0054] In this embodiment the detector has two light sources and two wavelengths.
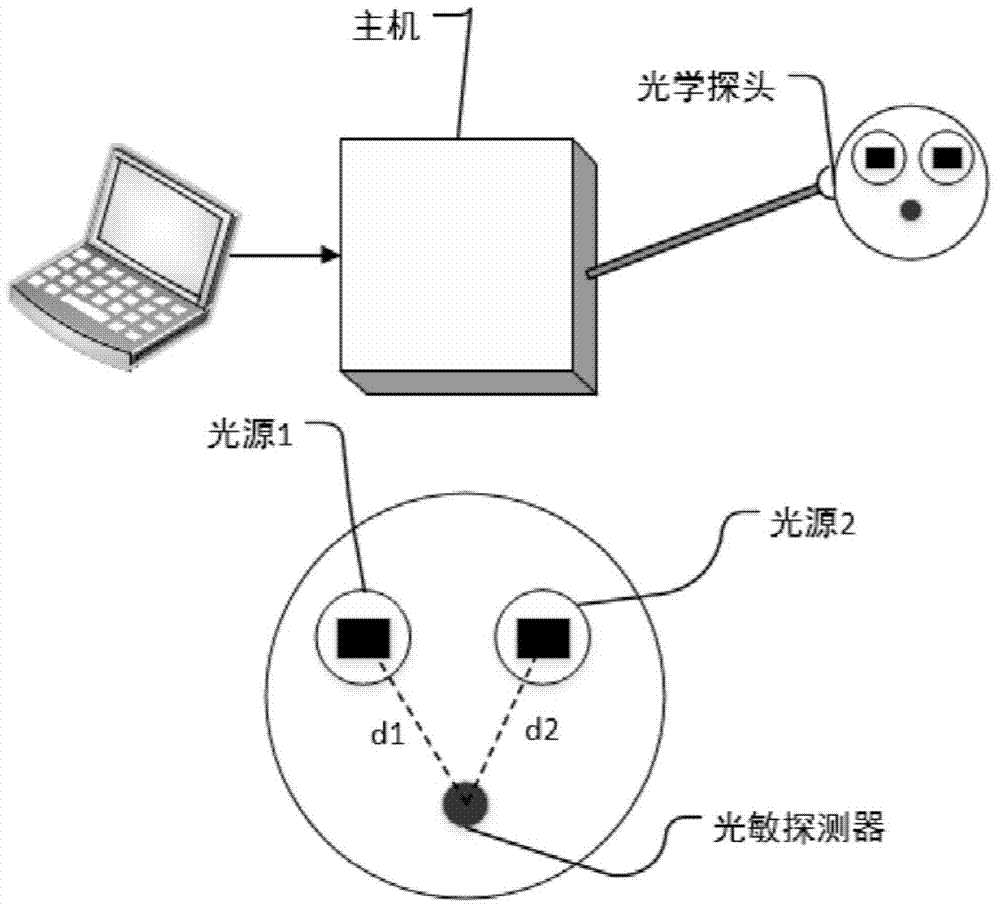
[0055] In step A, two light sources emitting near-infrared light of two wavelengths and a series of photosensitive detectors capable of detecting light attenuation changes of light transmitted back from the tissue to be measured constitute an optical detector, such as image 3 As shown, the typical values of the two wavelengths here are λ 1 = 735nm and λ 2 = 850nm. In this example, the optical detector is placed on the neck of the subject for measurement. After the measurement is completed, the time is taken as the abscissa and the voltage is taken as the ordinate, and the output voltage measured by the optical detector is plotted as follows: Figure 4 , where the subscripts 1 and 2 represent light source 1 and light source 2, respectively. Through the function U(λ,t) of the measured output voltage signal changing with time t and the initial output voltage U 0 (λ) ratio, calculate the tra...
Embodiment 2
[0097] In this example, instead of taking Δ[HbO 2 ] and Δ[Hb] in the frequency domain, the signal generated by the frequency of about 1% of the respiratory frequency, but one of the other frequency bands is chosen arbitrarily. Calculated SvO 2 Most of them exceed the normal SvO of the human body 2 scope. Choose from a group of Figure 8 As shown, the four pictures on the left are Δ[HbO 2 ] r and Δ[Hb] r , the four graphs on the right are Δ[HbO 2 ] r and Δ[Hb] r , the difference is obvious. Therefore, the frequency band around 1% of the respiratory rate is the most suitable for measuring SvO 2 and ScvO 2 the frequency band.
Embodiment 3
[0099] In this embodiment, data verification is added in the calculation process, and its specific flow chart is as follows Figure 9 shown. The formula for calculating the signal-to-noise ratio is as follows:
[0100] SNR Hb = f { Δ [ Hb ] } f = r σ f = r
[0101] SNR HbO 2 = f { Δ [ Hb O 2 ...
PUM
 Abstract
Description
Claims
Application Information
 - R&D
- Intellectual Property
- Life Sciences
- Materials
- Tech Scout
- Unparalleled Data Quality
- Higher Quality Content
- 60% Fewer Hallucinations
Browse by: Latest US Patents, China's latest patents, Technical Efficacy Thesaurus, Application Domain, Technology Topic, Popular Technical Reports.
© 2025 PatSnap. All rights reserved.Legal|Privacy policy|Modern Slavery Act Transparency Statement|Sitemap|About US| Contact US: help@patsnap.com


