
Flue gas concentration measuring method based on spectrum analysis

A technology of flue gas concentration and measurement method, which is applied to the measurement of color/spectral characteristics, material analysis by optical means, and measurement devices, etc., can solve the problems of increased cost, large error of measurement results, and low signal-to-noise ratio of detection signals, etc. Achieve the effect of eliminating mutual interference and reducing equipment cost

Inactive Publication Date: 2016-05-11
CHONGQING CHUANYI AUTOMATION
View PDF5 Cites 5 Cited by
  • Summary
  • Abstract
  • Description
  • Claims
  • Application Information

AI Technical Summary

Problems solved by technology

[0002] Monitoring harmful gases in flue gas is an important aspect of environmental protection work. Current flue gas monitoring technology is mainly divided into modern chemical measurement technology and spectral measurement technology. Differential Optical Absorption Spectroscopy (DOAS, Differential Optical Absorption Spectroscopy) is a representative of spectral measurement technology. , due to its simple measurement principle, fast response speed, real-time online monitoring of gas and other advantages, it is widely used in online monitoring of flue gas concentration, such as for measuring the gas concentration of SO2 and NO in flue gas; based on DOAS The current gas concentration measurement method has made great achievements in the measurement of long optical path and high concentration gas, but for the measurement of low concentration and short optical path gas concentration, due to the low signal-to-noise ratio of the detection signal, the error of the measurement result Large, in the existing technology, to improve the measurement accuracy of low-concentration gases, you can increase the optical path or use a high-precision spectrometer, but this will increase the cost

Method used


Image

  • Flue gas concentration measuring method based on spectrum analysis
  • Flue gas concentration measuring method based on spectrum analysis
  • Flue gas concentration measuring method based on spectrum analysis

Examples


Embodiment Construction

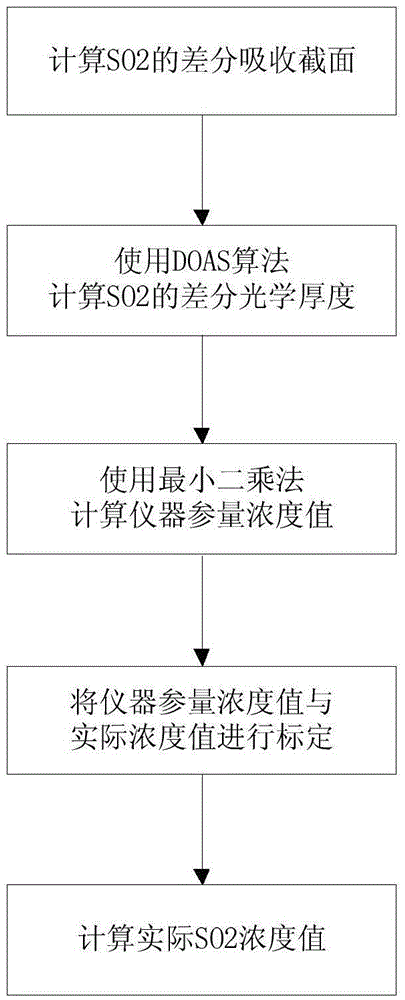
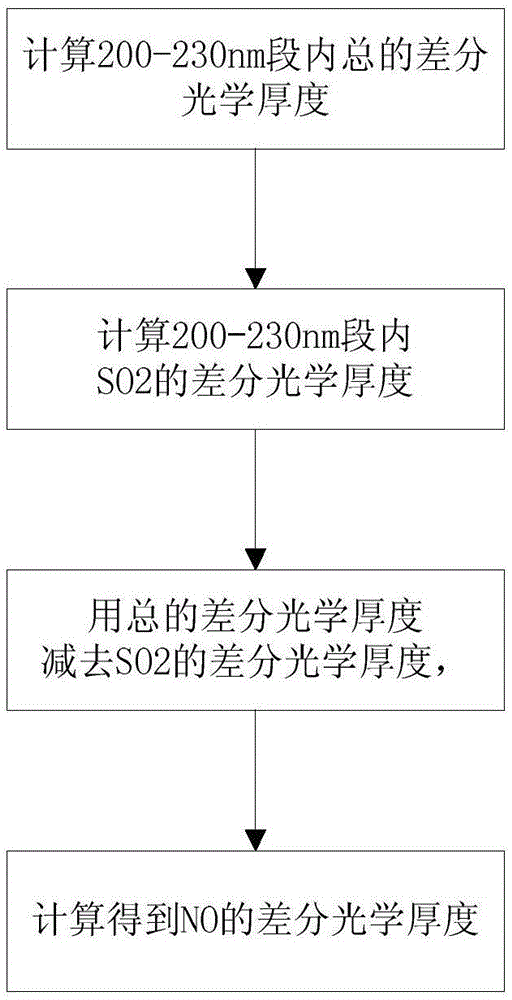
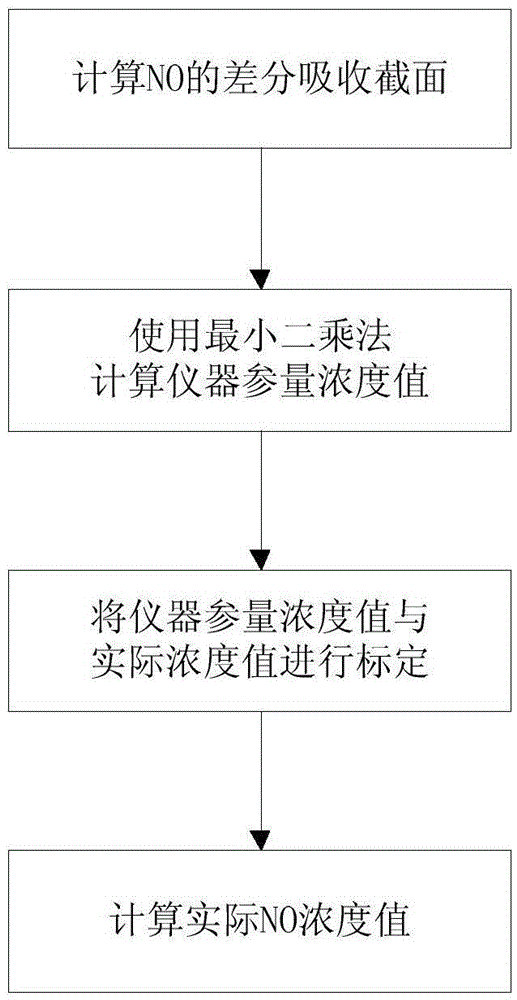
[0021] figure 1 It is a structural schematic diagram of the present invention, figure 1 It is the calculation flowchart of step a in the present invention, figure 2 It is the calculation flowchart of step b in the present invention, image 3 It is the calculation flowchart of step c in the present invention, Figure 4 For using the standard concentration calculated by the algorithm in the present invention to be 49ppm SO The measured value of the concentration, Figure 5 For using the standard concentration calculated by the algorithm in the present invention to be the measured value of the NO concentration of 25ppm, Figure 4 and Figure 5 The ordinate represents the concentration value and the unit is ppm, and the abscissa represents the number of measurements; as shown in the figure, the smoke concentration measurement method based on spectral analysis in the present embodiment includes the following steps:

[0022] a. In the first ultraviolet band, obtain the SO2 dif...


PUM


Abstract

The invention discloses a flue gas concentration measuring method based on spectrum analysis. According to the flue gas concentration measuring method disclosed by the invention, by carrying out band division treatment on flue gas, an instrument SO2 concentration value can be inverted in a first ultraviolet band, an actual standard SO2 concentration value is utilized for calibrating the instrument SO2 concentration value so as to obtain an accurate actual SO2 concentration value, the differential optical thickness of SO2 in a second ultraviolet band can be calculated by bringing in the actual SO2 concentration value, the differential optical thickness of NO can be calculated, and an accurate actual NO concentration value can be obtained by combining the differential optical thickness of the NO in the second ultraviolet band, so that mutual interference between the SO2 and the NO is eliminated, the measuring accuracy of SO2 and NO concentration in short-optical length and low-concentration flue gas is increased, the optical length is prevented from being increased or a high-accuracy spectrograph is prevented from being used, and the equipment cost is reduced.

Description

technical field [0001] The invention relates to the field of flue gas concentration measurement, in particular to a method for measuring flue gas concentration based on spectral analysis. Background technique [0002] Monitoring harmful gases in flue gas is an important aspect of environmental protection work. Current flue gas monitoring technology is mainly divided into modern chemical measurement technology and spectral measurement technology. Differential Optical Absorption Spectroscopy (DOAS, Differential Optical Absorption Spectroscopy) is a representative of spectral measurement technology. , due to its simple measurement principle, fast response speed, real-time online monitoring of gas and other advantages, it is widely used in online monitoring of flue gas concentration, such as for measuring the gas concentration of SO2 and NO in flue gas; based on DOAS The current gas concentration measurement method has made great achievements in the measurement of long optical p...

Claims


Application Information

Patent Timeline
Patent Type & Authority Applications(China)
IPC IPC(8): G01N21/33G01N21/31
CPCG01N21/33G01N21/31G01N2021/3129
Inventor 王菁甄长飞
Owner CHONGQING CHUANYI AUTOMATION
Learn More