Device and method for forecasting survival rate of freshwater fish based on passive acoustic information

A technology for predicting device and survival rate, applied in fish farming, radio wave measurement system, instrument, etc., can solve undiscovered problems, achieve the effects of avoiding adverse effects, non-destructive testing, and reducing farming or transportation costs

Active Publication Date: 2017-02-08
HUAZHONG AGRICULTURAL UNIVERSITY
0 Cites 5 Cited by

AI-Extracted Technical Summary

Problems solved by technology

[0004] Fish sound detection methods mainly include active sonar detection and passive sonar detection. In the existing research, active sonar methods are most...

Method used

Described the first hydrophone 4, the second hydrophone 5 are positioned at first fish box 1, below the second fish box 2 water surfaces respectively, described first fish box 1, the second fish box 2 are provided with Sound insulation cotton6. In order to ensure the integrity of fish sound signal collection and reduce external interference, the hydrophone is set below the water surface. In order to minimize the interference caused by external noise and ground vibration to the test, sound insulation cotton is provided on the outer surface and bottom of the fish box.
[0049] The sound insulation cotton 6 is a rubber sponge. The rubber sponge products have excellent cushioning and sound insulation properties. They evenly cover the outer surface of the fish box, and two layers of rubber sponge are lined at the bottom of the fish box to minimize the interference caused by external noise and ground vibration to the test.
[0078] The correlation coefficient R value of the crucian carp survival rate prediction model is 0.835, and the calibration standard deviation RMSECV value is 10.096, indicating that ...

Abstract

The invention belongs to the technical field of quality analysis of agricultural products and specifically relates to a device and a method for forecasting survival rate of freshwater fish based on passive acoustic information. The device for extracting an original fish acoustic signal comprises a fish box, wherein a hydrophone is arranged in the fish box; the hydrophone is respectively connected with an acoustic recorder; sound-insulating cotton is arranged on the exterior of the fish box. The method for forecasting survival rate of freshwater fish comprises the following steps: collecting the original fish acoustic signal; performing de-noising treatment on the fish acoustic signal; extracting characteristic parameters of the fish acoustic signal, including short-time average energy, short-time average zero-crossing rate and frequency band energy; constructing a feature vector; dividing a sample set; selecting the feature frequency band of the fish acoustic signal; establishing a forecasting model for survival rate of freshwater fish. The forecasting model for survival rate of freshwater fish established according to the method provided by the invention can realize online detection for the survival rate of freshwater fish, can be used for detecting the survival rate of the fish in the processes of fresh water fish breeding and live fish transportation and has a significance in increasing the survival rate of the fish in the processes of fresh water fish breeding and live fish transportation.

Application Domain

Technology Topic

De noisingSurvival rate +13

Image

  • Device and method for forecasting survival rate of freshwater fish based on passive acoustic information
  • Device and method for forecasting survival rate of freshwater fish based on passive acoustic information
  • Device and method for forecasting survival rate of freshwater fish based on passive acoustic information

Examples

  • Experimental program(3)

Example Embodiment

[0044] Example 1
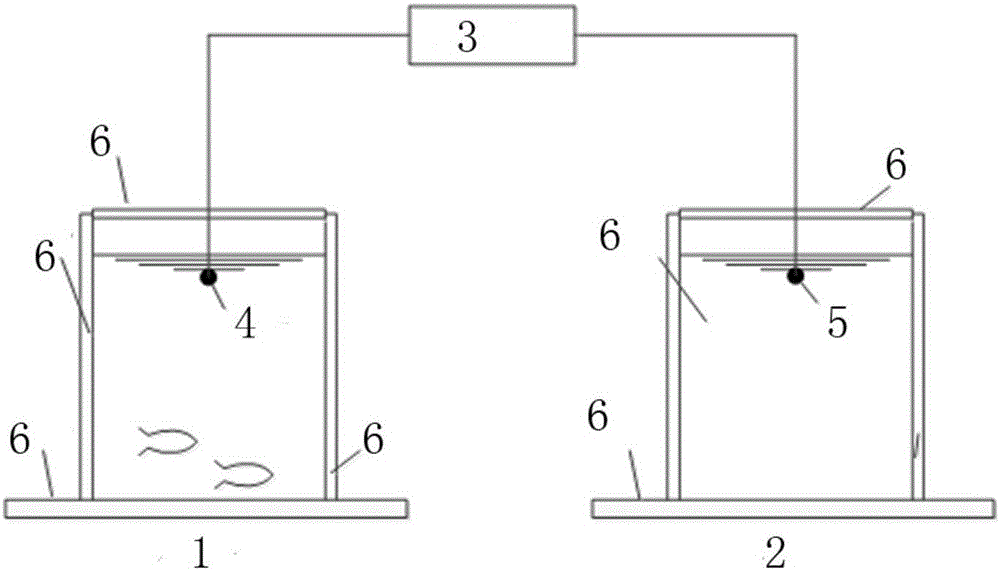
[0045] A freshwater fish survival rate prediction device based on passive acoustic information. The device for extracting original fish sound signals includes a first fish box 1 and a second fish box 2. The first fish box 1 is provided with a first hydrophone 4 A second hydrophone 5 is provided in the second fish box 2, and the first hydrophone 4 and the second hydrophone 5 are respectively connected to the acoustic recorder 3. The first fish box is used to collect the sound signals of freshwater fish, and the second fish box is used to collect background environmental noise, which is used for background environmental noise denoising during post-data processing.
[0046] There are several said first fish tank 1, first hydrophone 4, and second hydrophone 5. When it is used for transportation or breeding, there are multiple first fish boxes for placing fish, so each fish box for placing fish needs to collect fish sound signals.
[0047] In the process of large-scale breeding or transportation, the fish tank is very large, and a hydrophone cannot collect complete fish sound information, so it is necessary to set up several.
[0048] The first hydrophone 4 and the second hydrophone 5 are respectively located below the water surface of the first fish tank 1 and the second fish tank 2, and sound insulation cotton 6 is provided outside the first fish tank 1 and the second fish tank 2 . In order to ensure the integrity of the fish sound signal collection and reduce external interference, the hydrophone is set below the water surface. In order to minimize the interference from external noise and ground vibration to the test, sound insulation cotton is installed on the outer surface and bottom of the fish box.
[0049] The soundproof cotton 6 is rubber sponge. Rubber sponge products have excellent cushioning and sound insulation properties, uniformly covering the outer surface of the fish box, and two layers of rubber sponge are lined at the bottom of the fish box to minimize the interference from external noise and ground vibration on the test.

Example Embodiment

[0050] Example 2 Prediction model of crucian carp survival rate
[0051] 1) Fish sound signal acquisition and denoising processing: respectively figure 1 Inject 500L of water into the first fish tank and the second fish tank, the water temperature is 10-15℃, the dissolved oxygen content is 7-8mg/L, and the pH is 7.2-7.5. Connect the first hydrophone and the second water The hearing device is placed 20cm below the water surface. Put the crucian carp into the No. 1 fish box, the number of live crucian carp is 1-50, the minimum fish-water ratio is 1:999, the maximum fish-water ratio is 1:19, let stand for 5 minutes, and wait until the fish is relatively stable in the water , Set up an acoustic recorder to collect fish sound signals.
[0052] The setting parameters are as follows: acquisition time: 1min; sampling frequency: 4000Hz; acquisition channel: dual channels; acquisition times: 3 times. A total of 1,363 sound signal samples of crucian carp were collected.
[0053] 2) Extracting characteristic parameters: According to the fish sound signal after the denoising process in step 1), extract the short-term average energy of the fish sound and the short-term average zero-crossing rate of the fish sound, and then decompose the denoised fish sound signal , Using four-layer, five-layer, six-layer and seven-layer wavelet packet decomposition methods to divide the frequency band of the fish sound signal and extract the energy of each frequency band;
[0054] 3) Constructing a feature vector: Construct a feature vector according to the short-term average energy, short-term average zero-crossing rate and energy of each frequency band extracted in step 2); the dimension of the feature vector is shown in Table 1.
[0055] Table 1 Feature vector dimensions of different decomposition scales
[0056]
[0057]
[0058] 4) Sample set division: The crucian carp sound signal samples collected in step 1) are divided into training set and verification set, the number of samples is 1363.
[0059] The SPXY method and the Rank-SPXY method are used to divide the crucian carp sound signal sample set into a training set and a verification set at a ratio of 4:1, and the analysis and comparison are carried out. The m of the Rank-SPXY method is 5 and 10 respectively. . The results of sample set division are shown in Table 2. Rank-SPXY method, this method consists of two parts, the first is the "Rank" part, that is, the sample is sorted in ascending order of the dependent variable (number of live fish), and then the sample is divided into m parts; the second is the "SPXY method" part , That is, the SPXY method is used to select the training set in each interval of the equal division, and the remaining samples are automatically classified as the validation set. Among them, m is also an important parameter. When m=1, it is the SPXY method; when m is larger, the number of live fish in the training set obtained is more uniform, but the representativeness of the feature value is reduced.
[0060] Table 2 Division results of different sample set division methods
[0061]
[0062] As can be seen from Table 2, in the sample set divided by the SPXY method, 29-50 crucian carp sound samples are all divided into the training set, which causes the uneven division of the sample set, and the data range of the validation set divided by the Rank-SPXY method includes Within the data range of the training set, and the average of the validation set is smaller than the average of the training set, it is more reasonable to choose the Rank-SPXY method to divide the sample set. When the Rank-SPXY method is used to divide the sample set, by comparing the standard deviation of the verification set when m=5 and m=10, it can be seen that the division of the crucian carp sound signal sample set with m=10 is more uniform, but the value of m is larger It will also affect the representativeness of the characteristic value. Therefore, in this embodiment, two different values ​​of m are used to divide the crucian carp sound signal sample set, and a prediction model is established to compare which value is better.
[0063] 5) Feature value selection and feature vector dimensionality reduction: Perform Z-score (standard score) standardization preprocessing on the crucian carp sound signal after step 4) dividing the sample set, and use the competitive adaptive re-weighted sampling (CARS) method to The eigenvalues ​​of the sound signal sample set are optimized, and 10-fold cross validation is used to select the subset of eigenvalue variables with the smallest mean square error (RMSECV) value of the model cross validation;
[0064] Use multiple linear regression (MLR) to optimize the characteristic frequency again. After MLR modeling, the insignificant characteristic frequency range is removed to obtain the characteristic frequency band energy of the fish sound signal. The dimensionality of the characteristic vector of step 3) is reduced to obtain the reduced fish The eigenvectors of the acoustic signal, and the optimal results are shown in Table 3.
[0065] Table 3 Optimization results of the characteristic value of the sound signal of crucian carp
[0066]
[0067] 6) Model establishment: Using the multiple linear regression (MLR) method and the partial least squares (PLSR) method to establish the prediction model of the survival rate of the crucian carp respectively for the fish sound signal feature vector after the dimensionality reduction in the step 5). The correlation coefficient of the prediction model is shown in Table 4.
[0068] Table 4 Correlation coefficient of prediction model
[0069]
[0070] Based on the above modeling results obtained by using different feature extraction, different sample set division methods and different modeling methods, it can be seen that the correlation coefficient of the MLR prediction model established by the sample set obtained by "7-layer + Rank-SPXY (m = 10)" The highest, but the amount of calculation is twice that of "6 layers + Rank-SPXY (m=10)", so the short-term average energy and short-term average zero-crossing rate and the frequency band energy based on the 6-layer wavelet packet decomposition are selected as the crucian sound The optimal feature extraction method of signal samples; Rank-SPXY (m=10) method is the optimal sample set division method of crucian carp sound signal samples. After feature extraction of the sound signal of the crucian carp, the sample set is divided by the Rank-SPXY (m=10) method, and then the Z-score (standard score) standardization preprocessing is carried out, and the characteristic value of the sample set is optimized by the CARS method, and finally established The MLR prediction model for the survival rate of crucian carp, the regression equation is as follows:
[0071] y=40.471-3.095x 2 +1.710x 4 -1.981x 5 -1.768x 6 +2.349x 7 -10.883x 11 +7.301x 12 -1.306x 16 -2.187x 18 +19.417x 25 +9.734x 28 +70.133x 35 -25.264x 43 -79.860x 47 -40.098x 50 +26.155x 55 -24.005x 61 +31.320x 62
[0072] The parameters of the equation and their significance are shown in Table 5. Among them, the regression constant term b=40.071, x i Is the eigenvalue of crucian carp sound signal preprocessed by Z-score standardization, x 1 Refers to the short-term average energy of fish sound, x 2 Refers to the short-term average zero-crossing rate of fish sounds, x i When i≥3, it is the frequency band energy based on 6-layer wavelet packet decomposition. The specific meaning is shown in Table 6, a i Is the regression coefficient of each eigenvalue.
[0073] Table 5 Parameters of the regression equation and their significance
[0074]
[0075] Table 6: Fish sound signal short-term average energy, short-term average zero-crossing rate, and fish six-layer decomposition frequency band energy characteristic values
[0076]
[0077]
[0078] The correlation coefficient R value of the crucian carp survival rate prediction model is 0.835, and the calibration standard deviation RMSECV value is 10.096, indicating that the model has good stability and predictability. It can be seen from Table 5 that at x 35 , X 47 , X 50 Where, the absolute value of the regression coefficient is the largest, the t value is relatively large, and the P value is 0.000, indicating that these eigenvalues ​​have a significant impact on the prediction model. They represent the characteristic frequency bands of the crucian carp sound signal of 256~264Hz, 352~ 360Hz, 376~384Hz.
[0079] 7) Predict survival rate: detect fish sound signals of unknown freshwater fish samples, and bring the feature vectors of fish sound samples into the regression equation after Z-score standardization preprocessing, to calculate the number of live fish;
[0080] Use the regression equation established in step 6) to predict the 274 crucian carp sound samples in the verification set. The 18 characteristic values ​​of 274 crucian carp sound samples were preprocessed by Z-score standardization and then brought into the regression equation to calculate the number of live fish. The actual number and predicted number of some crucian carp validation sets are shown in Table 7. The correlation coefficient R verified by the crucian carp survival rate prediction model is 0.816, the calibration standard deviation RMSEP value is 8.015, and the relative analysis error RPD value is 1.79, indicating that the prediction model is more reliable.
[0081] Table 7 Prediction results of crucian carp survival rate
[0082]
[0083]
[0084] It can be seen from Table 7 that the prediction error of the sample numbers near the two ends (1 and 50) is relatively large, about 12; while the sample prediction error in the middle is relatively small, about 3, and the model accuracy needs to be further improved. .

Example Embodiment

[0085] Example 3 Prediction model of bream survival rate
[0086] 1) Fish sound signal acquisition and denoising processing: respectively figure 1 Inject 500L of water into the first fish tank and the second fish tank, the water temperature is 10-15℃, the dissolved oxygen content is 7-8mg/L, and the pH is 7.2-7.5. Connect the first hydrophone and the second water The hearing device is placed 20cm below the water surface. Put the crucian carp into the No. 1 fish box, the number of live bream fish ranges from 1 to 30, the minimum fish-water ratio is 1:666, the maximum fish-water ratio is 1:21, let stand for 5 minutes, and wait until the fish is stable in the water Set the acoustic recorder to collect fish sound signals.
[0087] The setting parameters are as follows: acquisition time: 1min; sampling frequency: 4000Hz; acquisition channel: dual channels; acquisition times: 3 times. There are 294 bream sound signal samples.
[0088] 2) Extracting characteristic parameters: same as embodiment 2;
[0089] 3) Constructing feature vector: same as embodiment 2;
[0090] 4) Sample set division: The crucian carp sound signal samples collected in step 1) are divided into training set and validation set, the number of samples is 294.
[0091] The SPXY method and the Rank-SPXY method are used to divide the bream sound signal sample set into a training set and a validation set according to the ratio of 4:1, and the analysis and comparison are carried out. The m of the Rank-SPXY method is 5 and 10, respectively. . The results of the sample set division are shown in Table 8.
[0092] Table 8 Division results of different sample set division methods
[0093]
[0094] It can be seen from Table 8 that in the sample set divided by the SPXY method, the average and standard deviation of the training set and the validation set are quite different, while the average and standard deviation of the sample set by the Rank-SPXY method are not much different. Using the SPXY method to divide the sample set results in uneven division, while the Rank-SPXY method is used to divide the sample set more evenly. Therefore, it is more reasonable to select the Rank-SPXY method to divide the bream sound signal sample set. When the Rank-SPXY method is used to divide the sample set, by comparing the standard deviation of the verification set when m=5 and m=10, it can be seen that the division of the sample set with m=10 is more uniform, but the larger m value will also affect Representativeness of eigenvalues. Therefore, in this embodiment, two different values ​​of m are simultaneously used to divide the bream sound signal sample set.
[0095] 5) Feature value selection and feature vector dimensionality reduction: Perform Z-score (standard score) standardization preprocessing on the crucian carp sound signal after step 4) dividing the sample set, and use the competitive adaptive reweight sampling (CARS) method to The eigenvalues ​​of the bream sound signal sample set are optimized, and the 10-fold cross-validation is used to select the subset of eigenvalue variables with the smallest mean square error (RMSECV) value of the model cross-validation.
[0096] Use MLR to optimize the characteristic frequency again. After MLR modeling, remove the insignificant characteristic frequency bands to obtain the characteristic frequency band energy of the fish sound signal, and reduce the dimension of the characteristic vector in step 3) to obtain the dimensionality reduction fish sound signal characteristic vector. The preferred results are shown in Table 9.
[0097] Table 9 Optimal results of bream sound signal characteristic values
[0098]
[0099] 6) Model establishment: Using the multiple linear regression (MLR) method and the partial least squares (PLSR) method to establish the bream survival rate prediction model for the fish sound signal feature vector after the dimensionality reduction in step 5). The correlation coefficient of the prediction model is shown in Table 10.
[0100] Table 10 Correlation coefficients of prediction models
[0101]
[0102] Based on the above modeling results obtained by using different feature extraction, different sample set division methods, and different modeling methods, it can be seen that the sample set obtained by "7-layer + Rank-SPXY (m=5)" has the highest correlation coefficient for establishing the MLR prediction model , But the amount of calculation is twice that of "6 layers + Rank-SPXY (m=5)", so this embodiment selects the short-term average energy and the short-term average zero-crossing rate and the frequency band energy based on the 6-layer wavelet packet decomposition as The optimal feature extraction method of bream sound signal samples; Rank-SPXY (m=5) method is the optimal sample set division method of bream sound signal samples. After the feature extraction of the bream sound signal, the Rank-SPXY (m=5) method is used to divide the sample set, and then the Z-score standardization preprocessing is performed, and the CARS method is used to optimize the feature value of the sample set, and finally the survival of the bream is established Rate MLR prediction model, the regression equation is as follows:
[0103] y=4.384+1.415x 5 +2.681x 9 +8.356x 14 +2.694x 18 -3.290x 24
[0104] The parameters of the equation and their significance are shown in Table 11. Among them, the regression constant term b = 4.384, x i Is the eigenvalue of the bream sound signal after preprocessing, a i Is the regression coefficient of each eigenvalue.
[0105] Table 11 Parameters of bream survival rate prediction model and their significance
[0106]
[0107] The correlation coefficient R value of the bream survival rate model is 0.894, and the calibration standard deviation RMSECV value is 3.83, indicating that the model has good stability and predictability. It can be seen from Table 4-10 that in x 9 , X 14 , X 18 , X 24 Where, the absolute value of the regression coefficient is the largest, and its t value is relatively large, and the P value is 0.034, which is less than 0.05, indicating that these eigenvalues ​​have a significant impact on the prediction model. They represent the characteristic frequency bands of the bream sound signal from 48 to 56Hz, 88~96Hz, 120~128Hz, 168~178Hz.
[0108] 7) Predict survival rate: detect fish sound signals of unknown freshwater fish samples, and bring the feature vectors of fish sound samples into the regression equation after Z-score standardization preprocessing, to calculate the number of live fish;
[0109] Use the regression equation established in step 6) to predict the 60 bream sound samples in the validation set. The 5 eigenvalues ​​of 60 bream sound samples were preprocessed by Z-score standardization and then brought into the regression equation to calculate the number of live fish. The actual number and predicted number of some bream verification sets are shown in Table 12. The correlation coefficient R verified by the bream survival rate prediction model is 0.865, the calibration standard deviation RMSEP value is 4.54, and the relative analysis error RPD value is 2.01, indicating that the prediction model is very reliable.
[0110] Table 12 Prediction results of bream survival rate
[0111]
[0112]
[0113] It can be seen from Table 12 that the minimum deviation is 0 and the maximum is 7. This error is caused by noise interference. It is necessary to further improve the signal-to-noise ratio of the signal, and thereby improve the prediction accuracy of the model.
[0114] In this example, a freshwater fish and bream survival rate prediction model was established. The model was used to predict the validation set samples, and the frequency band decomposition of different decomposition scales and the effect of different sample set division methods on the survival rate prediction model performance were studied. The results showed : The bream survival rate prediction model established by using "short-term average energy + short-term average zero-crossing rate + 6-layer wavelet packet decomposition of energy in each frequency band" combined with the Rank-SPXY (m = 5) sample division method has the best prediction performance (R=0.894, RPD=0.01).

PUM

no PUM

Description & Claims & Application Information

We can also present the details of the Description, Claims and Application information to help users get a comprehensive understanding of the technical details of the patent, such as background art, summary of invention, brief description of drawings, description of embodiments, and other original content. On the other hand, users can also determine the specific scope of protection of the technology through the list of claims; as well as understand the changes in the life cycle of the technology with the presentation of the patent timeline. Login to view more.

Similar technology patents

Pipe Fittings Allowing Non-Destructive Pressure Testing of Integrity of Seals

ActiveUS20160186910A1Increase flexibilityNon-destructive testingPipe couplingsFluid-tightness measurementEngineeringPull off test
Owner:PROPER PIPE EHF +1

Classification and recommendation of technical efficacy words

  • Avoid adverse effects
  • Non-destructive testing

Sigma-Delta analog-to-digital converter

InactiveCN101640539AAvoid adverse effectsDelta modulationDelta modulationGreek letter sigma
Owner:ZHEJIANG UNIV

Touch control display panel

Owner:XIAMEN TIANMA MICRO ELECTRONICS

Constant-temperature dehumidifying air conditioner and dehumidifying method

ActiveCN103411341AComfortable indoor environmentAvoid adverse effectsSpace heating and ventilation safety systemsSpace heating and ventilation control systemsAdverse effectEngineering
Owner:HISENSE (SHANDONG) AIR CONDITIONING CO LTD

White light interference measurement device and method based on sample space structure illumination

ActiveCN111220068ASuppress signal interferenceNon-destructive testingImage analysisUsing optical meansSample imageLighting system
Owner:INST OF MACHINERY MFG TECH CHINA ACAD OF ENG PHYSICS
Why Eureka
Try Eureka