Methods and systems for measuring serotonin in a sample
A serotonin and sample technology, which is used in the field of measuring serotonin and systems in samples, can solve the problems of complex operation and the lack of popularization of platelet function assays, etc.
- Summary
- Abstract
- Description
- Claims
- Application Information
AI Technical Summary
Problems solved by technology
Method used
Image
Examples
Embodiment 1
[0158] Example 1: Serotonin Release Assay (SRA) for Diagnosis of Heparin-Induced Thrombocytopenia (HIT)
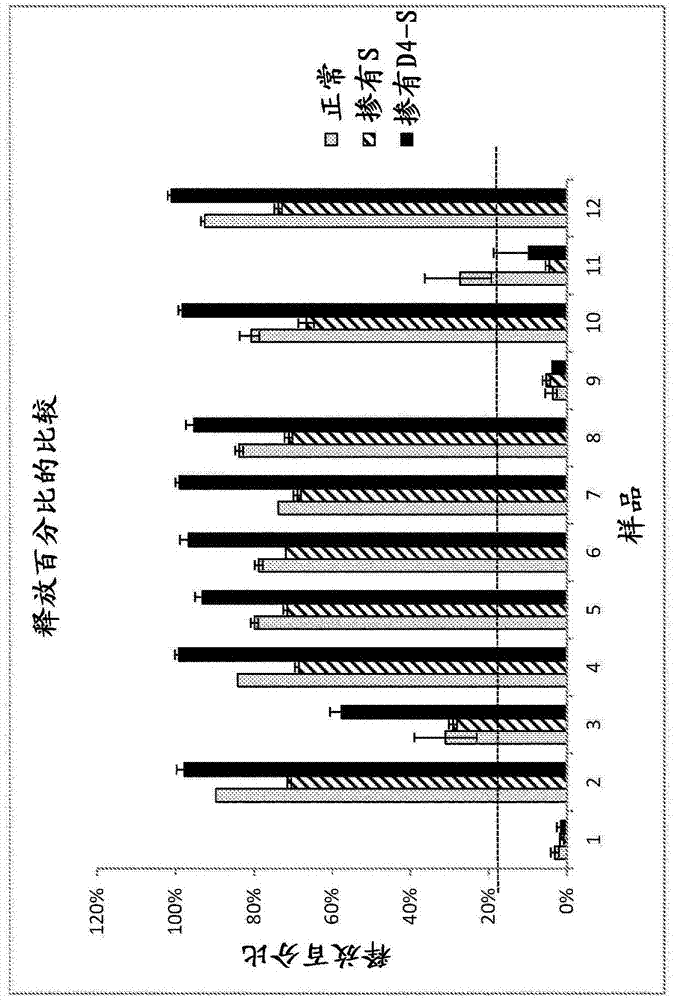
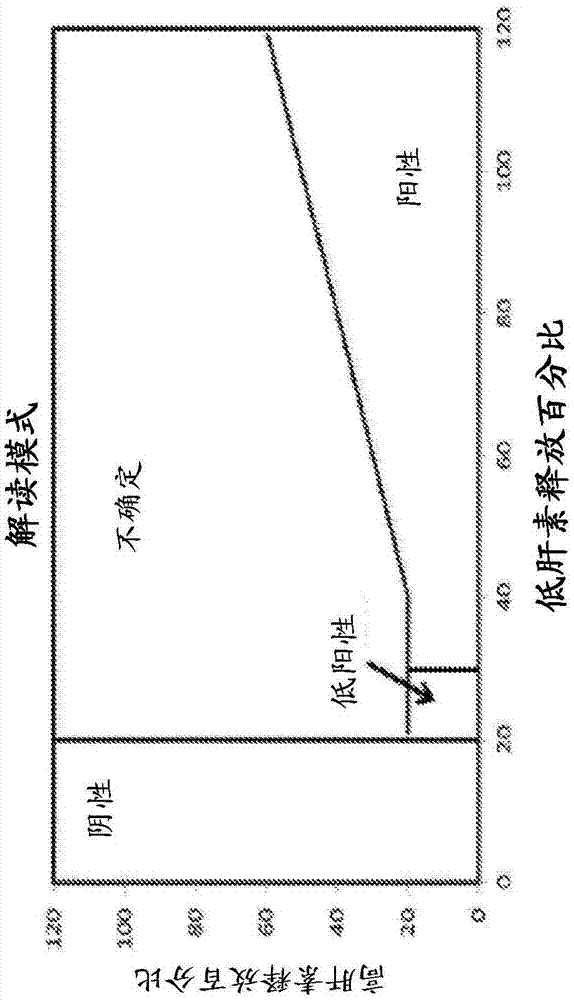
[0159] Serotonin is measured by mass spectrometric detection after isotope dilution and chromatographic separation. A stable labeled isotope of serotonin is added to the sample aliquots as an internal standard. After adding the internal standard in the precipitation solution to the sample aliquots, the samples were mixed, centrifuged, further diluted with ethyl acetate, and then injected into the LC-MS / MS system. An MDS-Sciex API5500 triple quadrupole mass spectrometer operating in positive ion electrospray ionization mode was used for detection. Quantification of analytes and internal standards was performed in selected reaction monitoring mode (SRM). The back-calculated amount of serotonin in each sample was determined from a calibration curve generated by spiking known amounts of purified serotonin from 1-1000 ng / mL into blank charcoal-treated serum. Percent serotoni...
Embodiment 2
[0223] Example 2: Positive HIT Assay
[0224] Biological samples were tested for HIT according to the procedure in Example 1. This sample showed a 27% release rate of serotonin at 0.2 U / mL heparin relative to the total serotonin available in the platelets (100%), with inhibition of release present at 100 U / mL heparin (see image 3 ), the total serotonin available in the platelets is determined by analysis according to the method described herein without the addition of a biological sample. Such as image 3 As shown in the upper left panel, the endogenous serotonin level in the biological sample and buffer was 1.2 ng / mL. image 3 The upper middle panel shows biological samples and 0.2 U / mL heparin. Approximately 60.4 ng / mL of serotonin was measured in the sample. image 3 The upper right panel shows biological samples and 100 U / mL heparin. Approximately 0.2 ng / mL of serotonin was measured in the samples. The percent serotonin release was 27% for the sample and 0.2 U / mL he...
Embodiment 3
[0226] Example 3: Conversion Ratio Evaluation
[0227] By dividing the qualitatively transformed area response value in the sample by the quantitatively transformed area response value (i.e., the transformation ratio) and comparing this ratio to the average transformation ratio measured in calibrators from the same batch (excluding calibrator 1), comparison for conversion ratio evaluation. Compile the data for the conversion ratio assessment from the Quantitative Results table. Acceptance criteria established during validation were provided for the analytes (see Table 2). In cases where concentration-specific acceptance criteria cannot be used in an automated fashion, recommended acceptance criteria (i.e., concentration-independent acceptance criteria) for all samples are provided as a backup.
[0228] Table 2: Recommended acceptance criteria for conversion ratio monitoring
[0229]
PUM
| Property | Measurement | Unit |
|---|---|---|
| diameter | aaaaa | aaaaa |
| volume | aaaaa | aaaaa |
Abstract
Description
Claims
Application Information
 - R&D
- Intellectual Property
- Life Sciences
- Materials
- Tech Scout
- Unparalleled Data Quality
- Higher Quality Content
- 60% Fewer Hallucinations
Browse by: Latest US Patents, China's latest patents, Technical Efficacy Thesaurus, Application Domain, Technology Topic, Popular Technical Reports.
© 2025 PatSnap. All rights reserved.Legal|Privacy policy|Modern Slavery Act Transparency Statement|Sitemap|About US| Contact US: help@patsnap.com


