AI (Artificial Intelligence) based low-confidence sample processing method and system of board sorting
A low-confidence, processing method technology, applied in the fields of instruments, character and pattern recognition, computer parts, etc., can solve the problems of low-confidence samples, limited source of wooden boards, judgment and classification, etc., to improve training efficiency and improve sorting. The effect of accuracy and high classification accuracy
- Summary
- Abstract
- Description
- Claims
- Application Information
AI Technical Summary
Problems solved by technology
Method used
Image

Examples
Embodiment 1
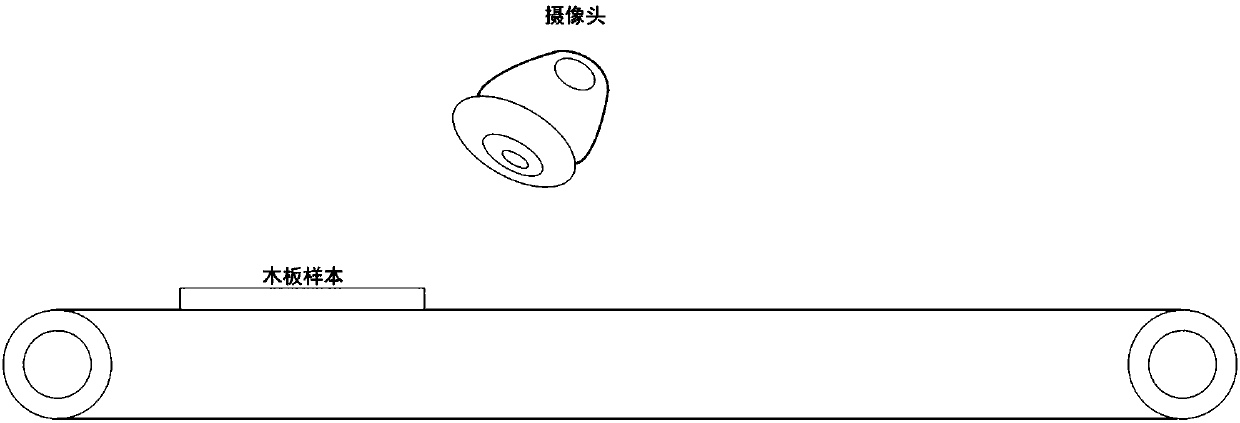
[0075] like figure 1 As shown, a wooden board is sent into the image acquisition area through the conveyor belt, and the image acquisition is completed during the moving process of the wooden board. The photographing device collects the image of the wooden board, and inputs the collected image into the trained machine learning model.
[0076] For the machine learning method, first, a part of wood samples need to be obtained inside the factory, and the classification of each wood sample. Since wood is a semi-natural product, it is impossible to have clear classification standards like industrial products such as steel. Therefore, currently in the factory, custom classification is carried out according to the actual situation of the factory. This self-defined classification method is more suitable for the actual situation of different board factories and the classification requirements, and the classification is more flexible and convenient. The specific implementation of the ...
Embodiment 2
[0098] In the process of manual labeling, due to the ambiguity of the samples with low confidence, even manual classification still faces certain challenges. Therefore, how to better present these samples to the operator determines the labeling accuracy of low confidence samples. Here, we introduce the following implementation manners to describe specific presentation manners.
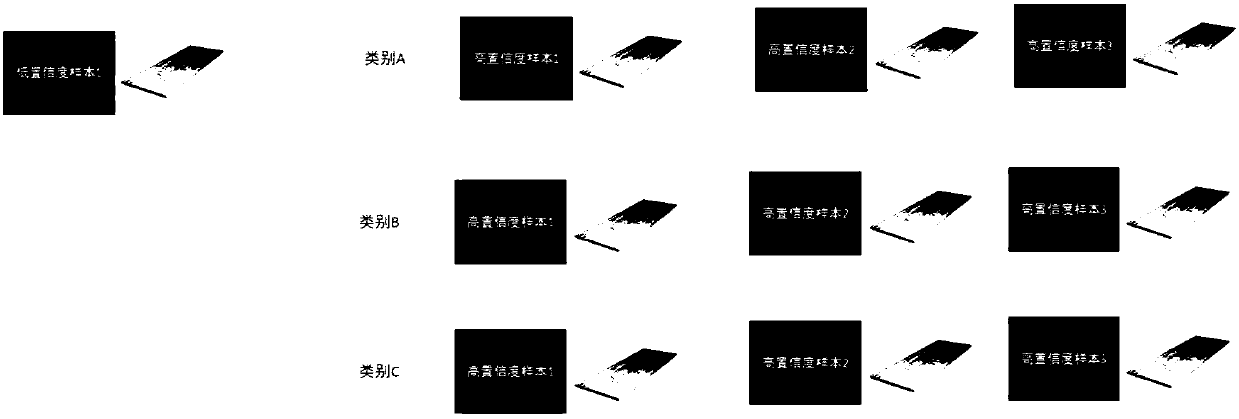
[0099] like image 3 As shown, not only the image data of low-confidence samples but also the image data of high-confidence samples are presented at the same time. By comparing the high-confidence sample data and low-confidence sample data at the same time, it is easier for the operator to compare , to recalibrate the low-confidence sample image.
[0100] For a clearer comparison, low-confidence samples and high-confidence samples, or manually labeled samples, can be presented simultaneously in the same interface. In the interface of the method, a low-confidence sample is presented, and multiple hig...
Embodiment 3
[0103] There is a possibility that the generation of low-confidence samples may be caused by changes in external ambient light, such as insufficient light intensity, or other light pollution entering the captured image. Therefore, one method preprocesses the samples, such as by enhancing the original image based on the reference image, such as normalizing parameters such as brightness, white balance, and contrast.
[0104] In order to eliminate the impact of illumination changes on image quality in the later stage, a reference image can be set during image acquisition. For example, in the image acquisition area, a white reference object is provided to ensure that the image of the wood sample and the image of the white reference object are collected at the same time. White reference objects can be used to provide a reference for white balance, brightness or other image parameters. In one manner, an external light source, such as an LED light source, is used during image acquis...
PUM
 Abstract
Description
Claims
Application Information