Tableau-based synchronous line loss anomaly analysis method and system

An analysis method and abnormal technology, applied in instruments, data processing applications, calculations, etc., can solve problems such as long analysis period, different database structures, and difficult analysis of line loss anomalies, and achieve the effect of improving efficiency

Inactive Publication Date: 2018-05-08
ELECTRIC POWER RES INST OF STATE GRID ZHEJIANG ELECTRIC POWER COMAPNY +2
View PDF6 Cites 9 Cited by
  • Summary
  • Abstract
  • Description
  • Claims
  • Application Information

AI Technical Summary

Problems solved by technology

[0003] At present, the traditional analysis of line loss anomalies mainly conducts quarter-point line loss statistical analysis on data such as marketing and metering systems, and gateway electricity, etc., and there are six major business systems and three major platforms associated with line loss in the same period, and different systems and platforms The structure of the database is different, and the correctness of data transmission and correlation requires the cooperation of inter-professional departments. It is difficult to analyze the abnormal line loss, and the analysis cycle is long

Method used


Image

  • Tableau-based synchronous line loss anomaly analysis method and system

Examples


Embodiment 1

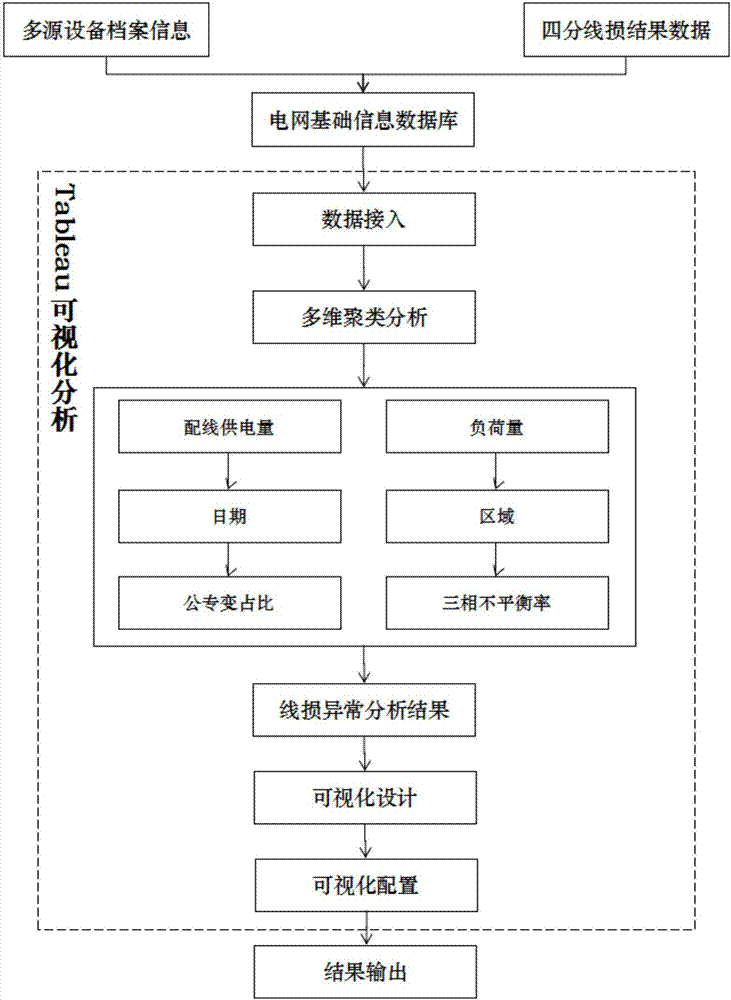
[0040] This embodiment provides a Tableau-based method for synchronous line loss anomaly analysis, which includes the following steps:

[0041] (1) Construct / connect the basic information database of the power grid, which mainly includes various factors that affect the abnormal line loss. Here, wiring is taken as an example, and based on Tableau, it focuses on mining abnormal high-loss data of wiring and locating abnormalities.

[0042] (2) Connect to the data source. Connect the wiring loss schedule (table collection) in the grid basic information database to Tableau Desktop software, and make basic adjustments to the connected data sources, mainly including setting the initial SQL, adjusting the data field type, and setting data source screening The controller adjusts the data range, etc., and prepares the data according to the analysis requirements.

[0043] (3) Data analysis, mainly using multi-dimensional cluster analysis and other analysis methods, by using Tableau Desk...

Embodiment 2

[0049] This embodiment provides the above-mentioned method for analyzing abnormal line loss in the same period, including steps:

[0050] Using the clustering analysis method, cluster the basic data information related to the line loss of the power grid in different dimensions, and find the abnormal problem of the line loss;

[0051] Through the analysis results of the abnormal line loss problem, the abnormal problem is excavated vertically, and the abnormal node is located;

[0052] According to the analysis results of abnormal line loss, design a visual display scheme for abnormal line loss analysis;

[0053] According to the visual display scheme of abnormal line loss analysis, the analysis results of abnormal line loss are verified.

Embodiment 3

[0055] This embodiment provides a Tableau-based synchronous line loss anomaly analysis system, which includes:

[0056] Cluster analysis unit: use the cluster analysis method to cluster the basic data information related to the line loss of the power grid in different dimensions, and find the abnormal problem of line loss;

[0057] Abnormal node positioning unit: through the analysis results of line loss abnormal problems, vertically excavate abnormal problems and locate abnormal nodes;

[0058] Visual design unit: According to the analysis results of abnormal line loss, design a visual display scheme for abnormal line loss analysis;

[0059] Abnormal analysis result verification unit: According to the visual display scheme of line loss abnormal analysis, apply Tableau Desktop to configure the visual analysis dashboard, and perform result verification on the analysis results of line loss abnormal problems;

[0060] Visual configuration unit: Publish the wiring loss visual ana...


PUM


Abstract

The invention discloses a Tableau-based synchronous line loss anomaly analysis method and system. with basic data information relates to power grid line losses as data input, Tableau visual analysis software is used, a cluster analysis method is applied to big data analysis, abnormal causes are analyzed, an abnormal point position is positioned, the line loss conditions of different units are compared transversely and analyzed, problem discovery is thus assisted, the problem law is found out, a line loss management process is optimized, and the efficiency is enhanced. Through mining the line loss anomaly data from the power grid basic information data, a line loss anomaly node is searched, a Tableau-based big data visual display mode is applied, transverse and longitudinal visual analysisis carried out on a synchronous quarter line loss condition, and auxiliary reference is provided for improving the management level of the power line losses.

Description

technical field [0001] The invention belongs to the technical field of power grid line loss anomaly analysis, in particular to a method and system for synchronous line loss anomaly analysis based on Tableau. Background technique [0002] The line loss rate index is used to assess the economy of the power system operation, and it is a major economic and technical index that comprehensively reflects the planning and design, production operation, link loss and operation and management level of the power grid. The analysis of line loss management in the same period puts forward higher requirements for the lean management of line loss, and tests the basic equipment management of the power grid, the coverage of smart meters, the success of collection, and the timeliness and effectiveness of the interconnection between various business systems. [0003] At present, the traditional analysis of line loss anomalies mainly conducts quarter-point line loss statistical analysis on data...

Claims


Application Information

Patent Timeline
Patent Type & Authority Applications(China)
IPC IPC(8): G06Q50/06
CPCG06Q50/06
Inventor 陆海清徐玮韡王博文陈峰陆承宇楼伯良吴俊初东晖孙杰张慧敏
Owner ELECTRIC POWER RES INST OF STATE GRID ZHEJIANG ELECTRIC POWER COMAPNY
Why Eureka
Try Eureka