A Dynamic Network Edge Sampling and Its Visualization Method

A dynamic network and sample sampling technology, applied in other database browsing/visualization, other database retrieval, other database indexing, etc., can solve the problems of poor visualization results, limited space, visual disorder, etc., and achieve the goal of reducing visual disorder and reducing scale Effect

Active Publication Date: 2021-11-02
CENT SOUTH UNIV
View PDF3 Cites 0 Cited by
  • Summary
  • Abstract
  • Description
  • Claims
  • Application Information

AI Technical Summary

Problems solved by technology

Animation is the most familiar and popular dynamic method. It uses a method similar to playing movies to play the network visualization view of each time slice in chronological order one by one, allowing people to observe the changes of nodes or edges in the dynamic network; based on The way of the time axis is to divide the entire dynamic network into several time slices, visualize each time slice separately, and then display each time slice on the screen space in a static manner. Although the animation method is very intuitive, it is difficult for human The short-term memory capacity of the network is limited, and it is difficult for users to capture a large amount of network change information in a short period of time
Therefore, people still choose to use the time axis-based method to visualize the dynamic network. This method draws the dynamic network on a time-space mapped time axis, and all time-slice views are displayed in a static picture. Therefore, it can give the user a better time overview, but this method also has a disadvantage, that is, when there are too many time slices or the node scale is large, and the relationship between nodes is complicated, due to the limited space allocated to each time slice , resulting in poor visualization results, complex view structure, serious overlapping of graphic elements, and visual disorder, making it difficult for people to obtain dynamic network timing patterns and structural information
In order to overcome these difficulties, the common method is to sort, cluster, and sample dynamic network nodes or edges. In practical applications, there are many research results on the sorting and clustering of dynamic network nodes or edges. There are few research results
Some widely used sampling methods, such as random sampling, uniform sampling, etc., have unsatisfactory sampling effects in dynamic networks. Dynamic network structure information

Method used


Image

  • A Dynamic Network Edge Sampling and Its Visualization Method
  • A Dynamic Network Edge Sampling and Its Visualization Method
  • A Dynamic Network Edge Sampling and Its Visualization Method

Examples


Embodiment Construction

[0028] In order to make the purpose, design ideas and advantages of the present invention clearer, the present invention will be further described in detail below in combination with specific examples and with reference to the accompanying drawings.

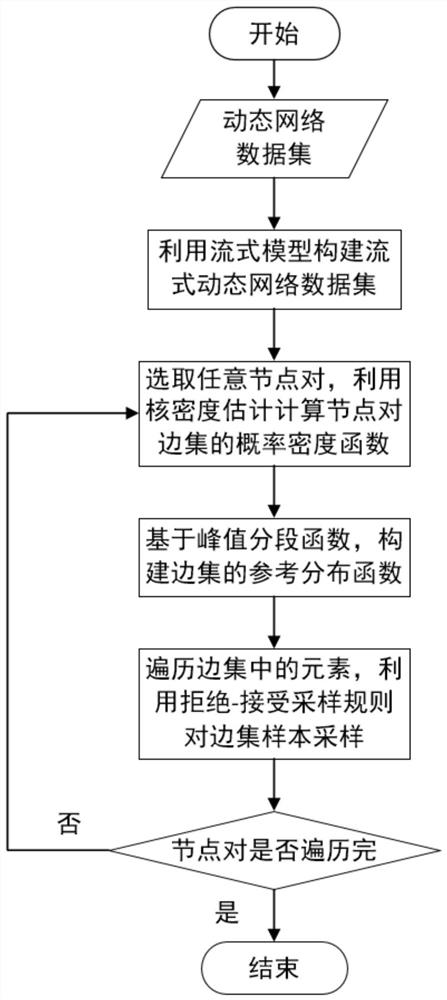
[0029] The invention provides a dynamic network edge sampling and its visualization method, comprising the following steps: 1) processing the dynamic network data with a stream model to obtain a stream network connection data set; 2) selecting any group of node pairs, using The kernel density estimation method calculates the probability density function of the edge between the pair of nodes; 3) constructs a suitable reference distribution function according to the probability density function of the edge of the node pair, which approximates the real probability density distribution; 4) for the target node pair For each edge, use a 0-1 uniform distribution to obtain a random value, and calculate the ratio of the probability density...


PUM


Abstract

The present invention provides a dynamic network edge sampling and its visualization method, comprising the following steps: 1) select any group of node pairs in the dynamic network, and use the kernel density estimation method to calculate the probability density function of the edge between the pair of nodes; 2) according to the node The probability density function of the paired edges constructs a suitable reference distribution function, which approximates the real probability density distribution; 3) For each edge of the target node pair, use a 0‑1 uniform distribution to obtain a random value, and calculate the edge The ratio of the probability density at each moment to the value of the reference distribution function constructed in the second step, compare the relationship between the ratio and the random value, and judge whether to accept the sample; 4) Traversing all node pairs in the dynamic network, repeat steps 1) to 3 ), to obtain the edge sample set of the dynamic network after sampling. The invention can basically maintain the structural features of the original dynamic network while reducing the scale of the dynamic network.

Description

technical field [0001] The invention relates to the field of visual optimization in dynamic network visualization, in particular to a dynamic network edge sampling and a visualization method thereof. Background technique [0002] Network, also known as Graph, is a well-known data structure used to describe the relationship between entities. Usually, all entities with relationships can be abstracted into a network (graph), that is, entities are abstracted into nodes. , the relationships between entities are abstracted into edges. According to whether the network will change over time, it can be divided into static network and dynamic network. [0003] The dynamic network is mainly used to represent the situation that the nodes in the network and the relationship between the nodes change with time. To efficiently and intuitively help people achieve the acquisition of structural information and time series patterns in dynamic networks, a common practice is to use visualizatio...

Claims


Application Information

Patent Timeline
Patent Type & Authority Patents(China)
IPC IPC(8): G06F16/901G06F16/904
CPCG06F16/9024G06F16/904
Inventor 赵颖盛英帅刘俊荣江钧佘燕敏陈文江周芳芳
Owner CENT SOUTH UNIV
Why Eureka
Try Eureka