A magnetic resonance sounding signal sparse denoising method based on particle swarm optimization
A particle swarm optimization and signal sparse technology, which is applied in the fields of electronic magnetic resonance/nuclear magnetic resonance detection, instrumentation, calculation, etc. The effect of reducing information loss, fast calculation speed, and enhanced calculation accuracy
- Summary
- Abstract
- Description
- Claims
- Application Information
AI Technical Summary
Problems solved by technology
Method used
Image
Examples
Embodiment 1
[0099] This embodiment is a simulation experiment of the method of the present invention carried out under the MATLAB 7.0 programming environment.
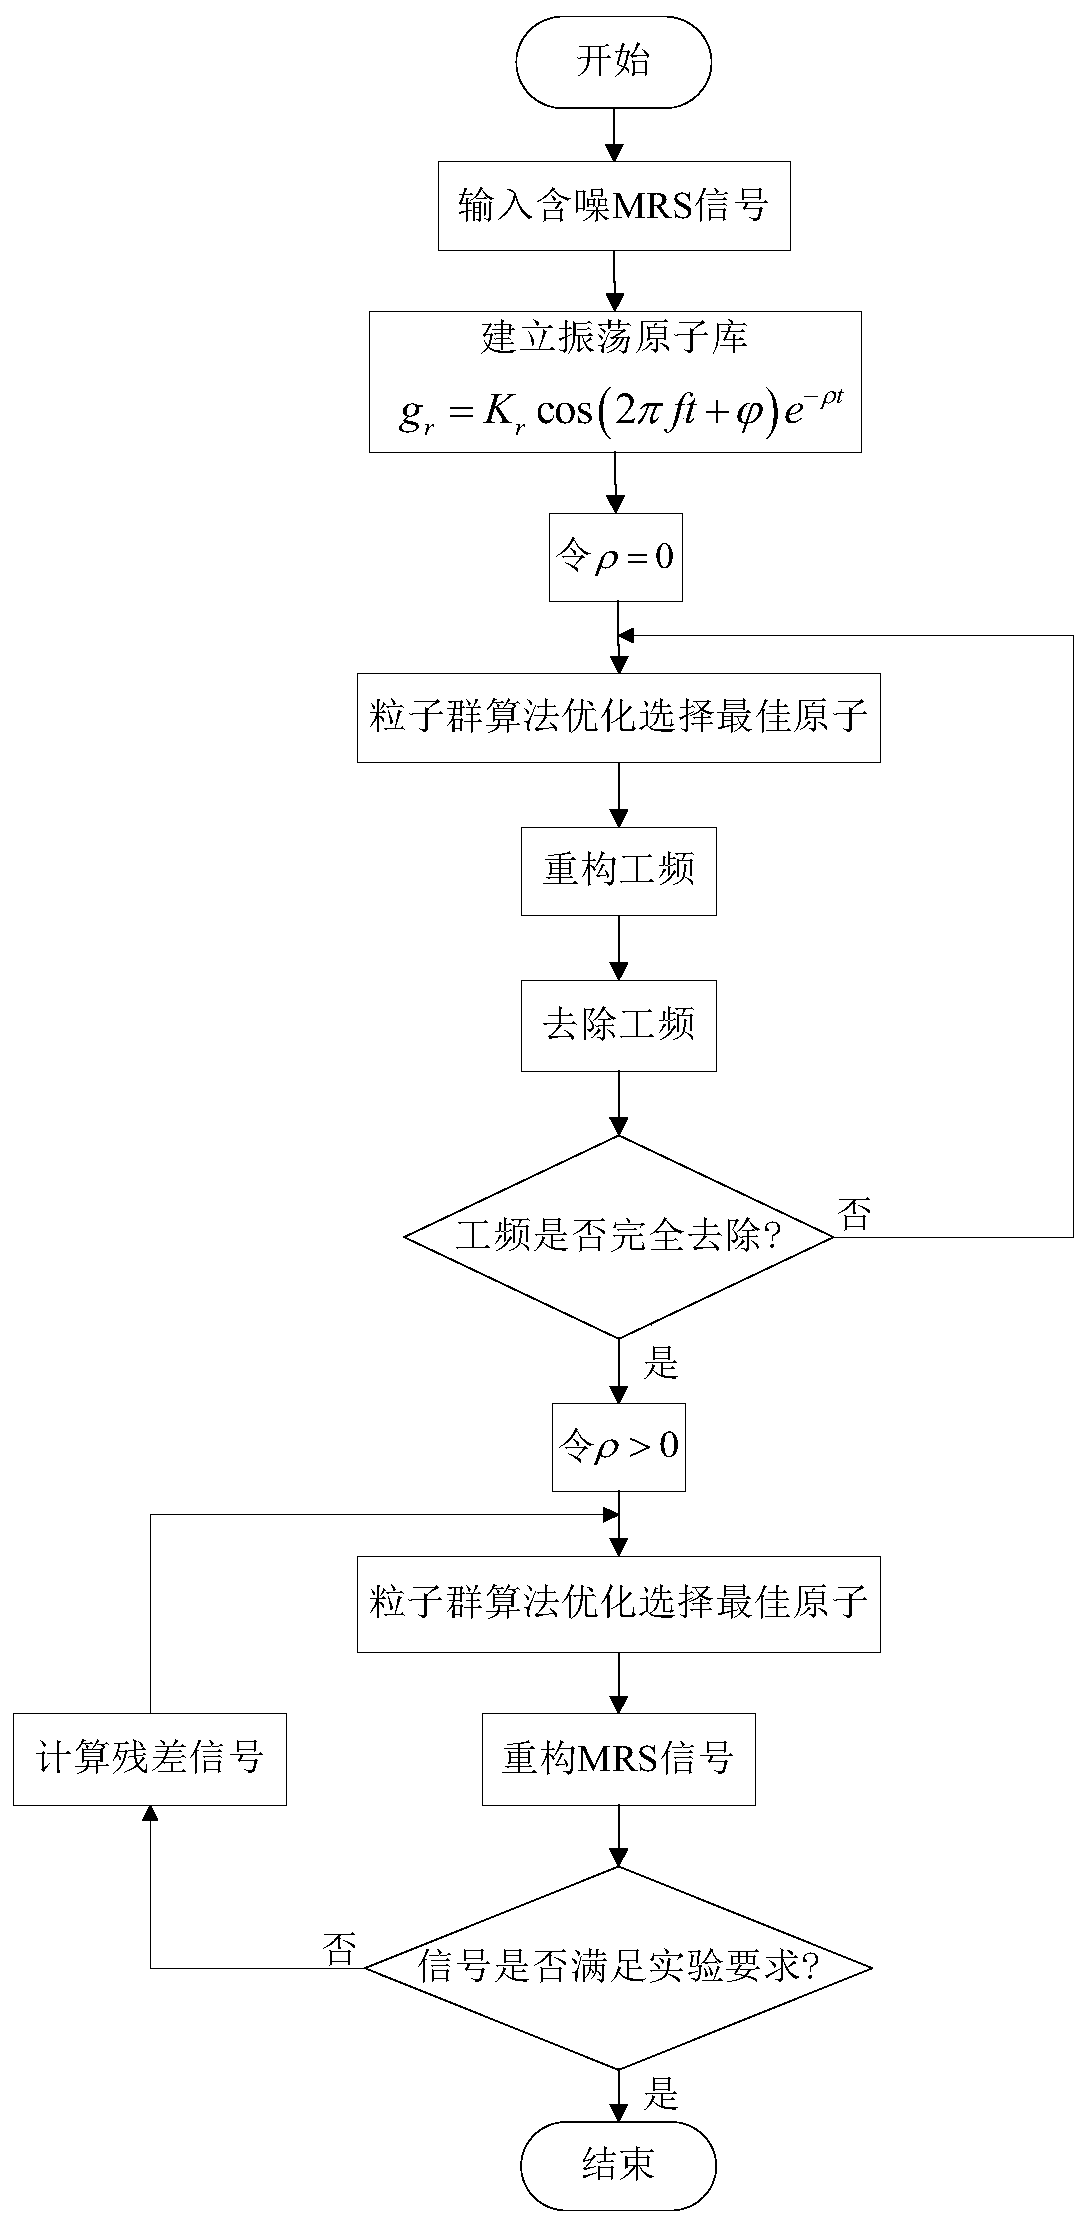
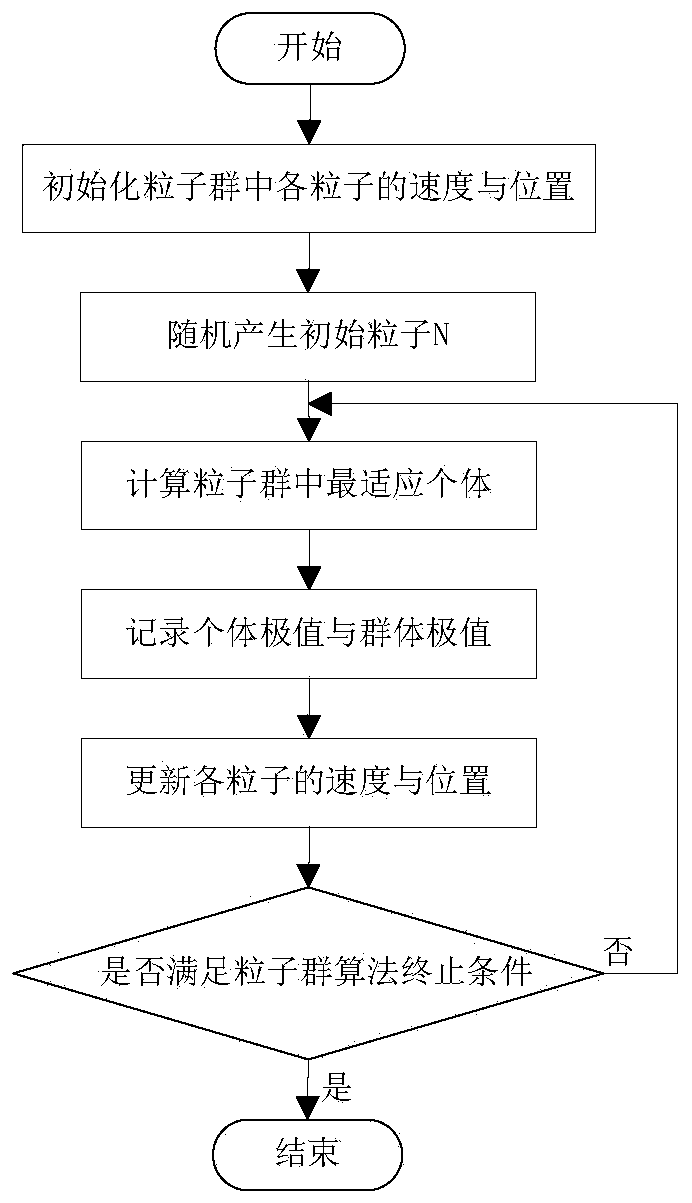
[0100] The simulation algorithm of sparse denoising method for magnetic resonance sounding signal based on particle swarm optimization, refer to figure 1 , including the following steps:
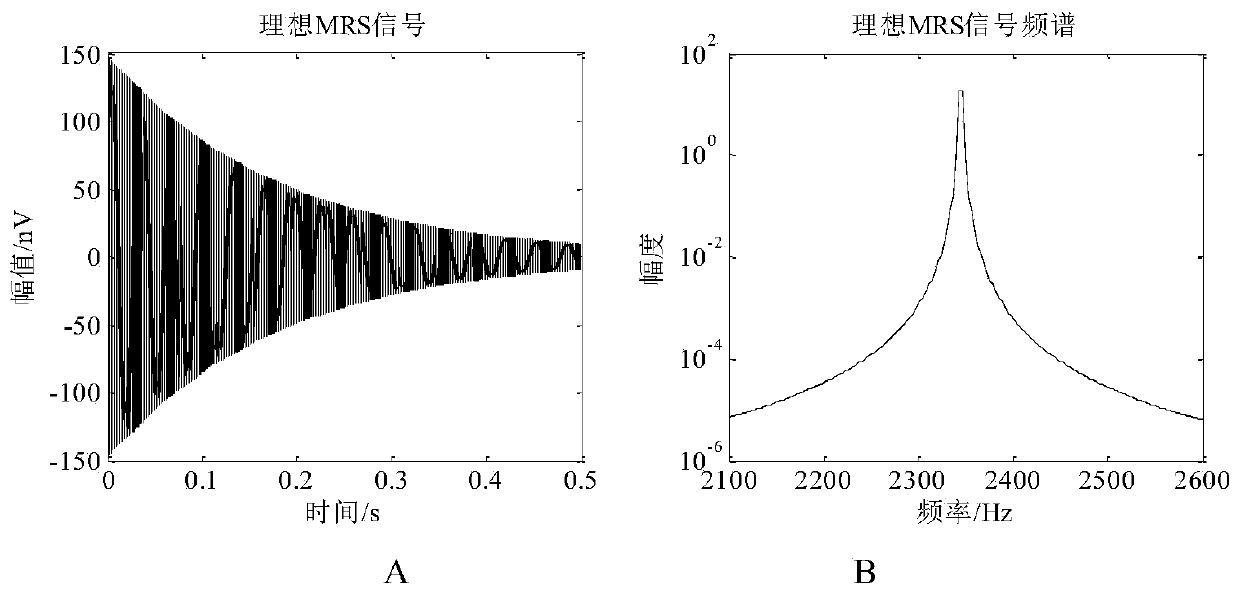
[0101] Step (1): Use the formula Construct a Larmor frequency of 2345Hz and an amplitude of e 0 150nV, the relaxation time An ideal MRS signal of 0.18s, such as image 3 The ideal MRS signal shown ( image 3 A) and its spectrum ( image 3 B). Add power frequency interference of 2200Hz, 2250Hz, 2300Hz, 2350Hz, 2400Hz, 2450Hz and 2500Hz near the Larmor frequency of the signal and random noise with an amplitude of 100nV, and form an observation with a signal-to-noise ratio of -6.7471dB through a certain linear combination MRS signal x(t) (row vector), such as Figure 4 The noisy MRS signal shown ( Figure 4 A) and its spectrum ( Figure...
Embodiment 2
[0106] In this embodiment, the actual measured MRS signal collected on the spot in Changchun Cultural Square is used as the processing object of the method of the present invention.
[0107] A sparse denoising method for magnetic resonance sounding signals based on particle swarm optimization, such as figure 1 shown, including the following steps:
[0108] Step (1): For a set of observed MRS signals X(t) collected by the nuclear magnetic resonance sounding (MRS) water detector, such as Figure 7 The measured MRS signal shown ( Figure 7 A) and its spectrum ( Figure 7 B); Utilize the mode of band-pass filtering to preprocess it, and obtain the noisy MRS signal x(t) (for a row vector) within the target frequency band, such as Figure 8 As shown in A, calculate its signal-to-noise ratio as SNR=-7.11dB; carry out Fourier transform to it to obtain its frequency spectrum, as Figure 8 As shown in B, it can be seen that the signal is at f 1 =2300Hz, f 2 = 2400Hz has strong pow...
PUM
 Abstract
Description
Claims
Application Information
 - R&D
- Intellectual Property
- Life Sciences
- Materials
- Tech Scout
- Unparalleled Data Quality
- Higher Quality Content
- 60% Fewer Hallucinations
Browse by: Latest US Patents, China's latest patents, Technical Efficacy Thesaurus, Application Domain, Technology Topic, Popular Technical Reports.
© 2025 PatSnap. All rights reserved.Legal|Privacy policy|Modern Slavery Act Transparency Statement|Sitemap|About US| Contact US: help@patsnap.com


