Wheat grain resistant starch content rapid measurement method
A technology for resistant starch and wheat grain, applied in the direction of testing starch pollutants, testing food, measuring devices, etc., can solve problems such as time-consuming and complicated operations
Active Publication Date: 2019-06-21
湖北高农科技有限公司
5 Cites 3 Cited by
AI-Extracted Technical Summary
Problems solved by technology
[0004] The purpose of the present invention is to: provide a kind of rapid determination method by establishing the mid-infrared spectrum model about the resista...
Abstract
The invention relates to a wheat grain resistant starch content rapid measurement method and belongs to the technical field of wheat grain resistant starch content prediction. The wheat grain resistant starch content rapid measurement method achieves a purpose of rapidly measuring the wheat grain resistant starch content by establishing a medium-infrared spectroscopy model related to the wheat grain resistant starch content. Compared with a chemical measurement method, the method is fast, efficient and environmentally friendly, and meets the needs of people.
Application Domain
Testing starch susbtancesMaterial analysis by optical means
Technology Topic
Environmentally friendlySpectroscopy +5
Image
Examples
- Experimental program(1)
Example Embodiment
[0029] The method for rapid determination of resistant starch content in wheat grains comprises the following steps:
[0030] (1) Select a certain amount of grains of different wheat materials in the germplasm resource bank, each material is the clean wheat grains after manual impurity removal, and grind the wheat grains into fine powder with a cyclone mill equipped with a 0.8 mm sieve plate , then put the obtained wheat flour into a sealing bag, put it in an open shape and put it into a drying box for 8 hours to dry at 40 °C, take it out, and seal it for later use after natural cooling; in this way, whole wheat flour materials of different materials can be prepared .
[0031] (2) Using the K-RSTAR Resistant Starch Kit produced by the Irish company, according to the AOAC method 2002.02 resistant starch determination principle, the resistant starch content of each whole wheat flour material was determined multiple times, and then the average value of the multiple determination results was taken. , so that the resistant starch content value of each whole wheat flour material can be obtained;
[0032] (3) Spectroscopic determination of wheat material:
[0033] The spectral acquisition range of the Nicolet iS5 Fourier transform infrared spectrometer produced by Thermo Fisher Scientific was set to 4000-525cm -1; The absorption area of starch functional groups is 4000-525cm -1 Therefore, the spectral collection range of the Fourier transform infrared spectrometer is set within this range, and the resolution is set to 4cm -1 , the number of scans is set to 16 times, and then use the small spoon that comes with the Fourier transform infrared spectrometer to take about 0.01g of whole wheat flour material into the detection port, rotate the probe clockwise until a sound is heard, and then use the OMNIC 8.2 smart The software records the spectral data of the whole wheat flour material. After each material is measured, wipe the probe and the detection port with anhydrous ethanol, and then collect the spectrum of the next whole wheat flour material after natural drying; in this way, the spectral data of each whole wheat flour material can be obtained;
[0034] (4) Division of calibration set and validation set:
[0035] The spectral data of each whole wheat flour material and the data of resistant starch content measured by chemical method were combined correspondingly, and then arranged according to the chemical value of each wheat flour material from small to large, and 1 sample was selected from every 5 samples as the validation set, and the rest As the calibration set, the calibration set and the validation set were classified separately, and then these data were imported into Unscrambler 9.7 (CAMO Corporation, USA) software for the establishment of the prediction model;
[0036] (5) Establishment of the prediction model:
[0037]In the Unscrambler 9.7 software, the samples were first edited into the calibration set and the validation set, then the independent variables were edited as spectral variables and the dependent variables were edited as chemical value variables, and then the linear baseline correction was selected in the software, and the preprocessing of the linear baseline correction was performed. , hereinafter referred to as Baseline preprocessing; then select linear baseline correction+Gaussian Filter Smoothing for linear baseline correction and Gaussian filter smoothing preprocessing, hereinafter referred to as Baseline+GFS preprocessing; then select linear baseline correction+MultiplicativeScatter Correction for linear baseline correction and multivariate Scatter correction preprocessing, hereinafter referred to as Baseline+MSC preprocessing; to eliminate the influence of baseline drift, high-frequency random noise, sample unevenness and other factors on modeling, after the above preprocessing is completed, regression analysis in Unscrambler 9.7 software Select PLS1 respectively, and click the full cross-validation method to use the partial least squares method to model, so that the parameter values of the prediction models after different preprocessing can be obtained;
[0038] The prediction model parameter values contain the coefficient of determination R 2 and the root mean square error RMSE, the coefficient of determination R 2 is an important statistic that reflects the goodness of fit of the model, and the root mean square error RMSE is used to measure the deviation between the observed value and the true value; when the coefficient of determination R 2 The closer it is to 1, the smaller the root mean square error RMSE, and the better the prediction effect of the model; in this way, the correction determination coefficient R of different preprocessed prediction models can be compared. c 2 and the predicted coefficient of determination R p 2 And the size of the corrected root mean square error RMSEC and the prediction root mean square error RMSEP, and find the best prediction model, which is the prediction model for measuring the resistant starch content;
[0039] (6) External validation of prediction models;
[0040] After the prediction model is established, select "predict" in the task bar of the Unscrambler 9.7 software, in the prediction box, select the validation set as the sample set, select the spectral variable as the independent variable, select the resistant starch chemical value as the dependent variable, and select the model Save the best prediction model, click "OK", the system can automatically predict the predicted value of the external validation set material, and input the predicted value and chemical value into Excel, perform regression analysis, and obtain a linear regression equation for further Verify the accuracy of the prediction model;
[0041] (7) How to use;
[0042] 1) Select about 8 g of clean wheat grains to be measured after manual impurity removal, then grind the wheat grains to be measured into fine powder with a cyclone mill equipped with a 0.8 mm sieve plate, and then put the obtained whole wheat flour into Put it into a sealed bag, put it in an open shape and put it in a drying box for 8 hours to dry at 40°C, take it out, and seal it for later use after natural cooling; in this way, the whole wheat flour material to be determined can be obtained;
[0043] 2) Set the spectral collection range of the Fourier transform infrared spectrometer to 4000-525cm -1 , the resolution is set to 4cm -1 , the number of scans is set to 16 times (in the measurement process, it is found that when the number of scans is 16, the measured spectrum has reached stability), and then use the small spoon that comes with the Fourier transform infrared spectrometer to take about 0.01g of the whole to be determined. Put the wheat flour material into the detection port, rotate the probe clockwise until a sound is heard, and then use the OMNIC 8.2 intelligent software to record the spectral data of the whole wheat flour material;
[0044] 3) Import the spectral data of the whole wheat flour material into the software of Unscrambler 9.7, then select "predict" in the task bar, in the prediction box, select the validation set with only spectral data as the sample set, and select the spectral variable as the independent variable, The model selects the best prediction model saved, click "OK", the system can automatically predict the resistant starch content value of the whole wheat flour material to be tested.
[0045] Typical Case:
[0046] (1) Source of materials
[0047] The wheat materials were obtained from the wheat germplasm resources of Changjiang University, with a total of 63 different material grains.
[0048] (2) Instruments
[0049] Pulverizer (Perten Laboratory Mill 3100), electric heating constant temperature blast drying oven (Suzhou Jiangdong Precision Instrument Co., Ltd.), Nicolet is5 infrared spectrometer (Thermo Fisher Scientific), electronic balance (Ohaus Instrument (Changzhou) Co., Ltd.), water bath (Jintan Honghua Instrument Factory), centrifuge (Shanghai Aiyan Biotechnology Co., Ltd.), IKA constant temperature shaker KS 3000 ic control (IKA (Guangzhou) Instrument Equipment Co., Ltd.), BETS-M1 decolorizing micro circular shaker (Haimen Qilin Bell Instrument Manufacturing Co., Ltd.), UV Spectrophotometer (Shimadzu Instrument (Changzhou) Instrument Co., Ltd.)
[0050] The method for rapid determination of resistant starch content in wheat grains comprises the following steps:
[0051] (1) Select 63 different wheat material grains in the germplasm resource bank of Changjiang University. After each material is cleaned manually, the wheat is smashed by a cyclone mill (Perten Laboratory Mill 3100) equipped with a standard 0.8 mm sieve plate. The grains are ground into fine powder, and then 0.1g of each whole wheat flour is extracted and put into a separate sealed bag, and it is uniformly placed in a drying box in an open shape and dried at 40 °C for about 8 hours. Seal for later use, so that 63 whole wheat flour materials of different material grains can be prepared.
[0052] (2) Purchase the resistant starch kit from the Irish company, and measure the content of resistant starch in wheat grains according to the principle of AOAC method 2002.02 determination of resistant starch. The specific method of AOAC method 2002.02 determination principle of resistant starch is as follows:
[0053] Accurately weigh 0.0500g of dried wheat flour with an electronic balance with an accuracy of 0.0001g (Ohaus Instruments (Changzhou) Co., Ltd.), and place them in 15mL centrifuge tubes; add 2mL of α-amylase to each material tube, Tighten the lid, place it on a shaker (IKA constant temperature shaker KS 3000 ic control) and shake for 16h (135r 37°C); take it out, let it cool to room temperature, add 3mL of 50% ethanol, mix well, centrifuge at 4000r for 10min (Shanghai Aiyan) Biotechnology Co., Ltd.), discard the supernatant; add 4 mL of 50% ethanol, 4000 r/min, centrifuge twice for 10 min, discard the supernatant to fully inactivate the enzyme; invert the centrifuge tube on the filter paper and dry it to evaporate the alcohol. ; Add 1 mL of 2 mol/L KOH solution to each centrifuge tube, shake on ice for 20 min (BETS-M1 decolorizing micro-circular shaker) to fully dissolve the resistant starch; take out and wipe the water on the tube wall, add 4 mL of 1.2 mol/L (pH=3.8) sodium acetate, then immediately add 50 μL of amyloglucosidase (3300U/mL), tighten the lid, take a water bath at 50°C for 30min (Jintan Honghua Instrument Factory), shake every 10 minutes for 1 Second, convert digestible starch into glucose; after water bath, cool down to room temperature, centrifuge at 5000r for 10min, take 50μL of supernatant and add them to another 10mL centrifuge tube; then add 1.5mL of GOPOD to each 10mL centrifuge tube , at the same time set blank (pH=4.5 sodium acetate) and glucose standard sample (1mg/mL D-glucose) control, 50 ℃ water bath for 20min, make it fully react; use UV spectrophotometer (Shimadzu (Changzhou) Instrument Company ) The absorbance value of glucose was measured at 510nm, and the absorbance value of glucose divided by the absorbance value of D-glucose standard solution multiplied by 9.27 divided by 0.87 was the content of resistant starch.
[0054] In order to ensure the accuracy of the measured data, each wheat flour material was measured 3 times, and the average value was taken; the measured resistant starch content of each wheat material is shown in Table (1):
[0055] Table (1) Resistant starch content of 63 wheat grains
[0056]
[0057] (3) Spectroscopic determination of wheat grains:
[0058] Spectral measurement was performed with the Nicolet is5 Fourier infrared spectrometer produced by Thermo Fisher Scientific, and the spectral data of the 63 wheat grains were recorded with the OMNIC 8.2 intelligent software; Turn on the instrument in the order of the table, printer and computer, wait for about 3 minutes after the optical table is stable, and then open the OMNIC measurement software, the instrument will automatically detect the id7 ATR accessory put in, check the optical table status indicator is normal. Setting, that is, the spectrum collection range is 4000-525cm -1 , the resolution is 4cm -1 , The number of scans is 16 times, first collect the background, take about 0.01g of wheat flour with the small spoon that comes with the device and put it into the detection port, rotate the probe clockwise until a sound is heard, and then in the OMNIC8.2 software The material spectrum data can be recorded automatically deducting the atmospheric background. After each material is measured, the probe and detection window are wiped with absolute ethanol, and the next material spectrum is collected after natural drying. In this way, spectral data of the grains of the 63 wheat materials can be obtained.
[0059] (4) Division of calibration set and validation set:
[0060] Will use Nicolet is5 Fourier transform infrared spectrometer at 4000-525cm -1 The spectral data measured in the spectral range and the resistant starch content data measured by the chemical method were combined correspondingly, and then arranged according to the chemical value of the 63 wheat grains from small to large, and 1 sample out of every 5 samples was selected as the validation set. The rest are used as the calibration set, and the remaining 3 copies are used as the calibration set material, so that 51 calibration sets (Calibraion set) and 12 validation sets (Validation set) can be obtained; the distribution of resistant starch content in the calibration set and the validation set is shown in In table (2);
[0061] Table (2) Distribution of resistant starch content in calibration set and validation set
[0062]
[0063] From the above table, it can be concluded that the range of resistant starch content is 0.22%-3.35%, representing a wide range, in addition, the mean (Mean) and standard deviation (SD) of the calibration set and the validation set are similar, which The relative consistency of calibration set data and validation set data was ensured; these data were then imported into Unscrambler 9.7 (CAMO Corporation, USA) software for predictive model building.
[0064] (5) Establishment of the prediction model:
[0065]In Unscrambler 9.7 software, the samples were first edited into 51 calibration sets and 12 validation sets, and then the variables were edited into spectral variables (independent variables) and chemical value variables (dependent variables). Before modeling with Unscrambler 9.7 software, in order to To eliminate the influence of baseline drift, high-frequency random noise, sample unevenness and other factors on the modeling, Baseline was selected in the software to perform linear baseline correction preprocessing, and then Baseline+GFS was selected to perform linear baseline correction and Gaussian filter smoothing. processing; then select Baseline+MSC for preprocessing of linear baseline correction and multivariate scatter correction; then select PLS1 method for modeling in the regression analysis of Unscrambler 9.7 software, and then click to select the full cross-validation method, then different preprocessing can appear. Parameter values for the prediction model. The parameter values of the prediction model obtained through the above processing are shown in Table 3.
[0066] Table 3 Results of mid-infrared spectroscopy models with different preprocessing
[0067]
[0068] (6) Evaluation of the prediction model
[0069] The results of the prediction model parameters after different preprocessing (see Table (3)) are shown in which the corrected coefficient of determination R c 2 , the prediction coefficient of determination R p 2 , Corrected root mean square error RMSEC and prediction root mean square error RMSEP are the main indicators to judge the accuracy of the model, the coefficient of determination R 2 is an important statistic that reflects the goodness of fit of the model, and the root mean square error RMSE is used to measure the deviation between the observed value and the true value. when R 2 The closer it is to 1, the smaller the RMSE, and the better the prediction performance of the model.
[0070] From the correlation coefficients in the calibration set, it can be seen that the four treatments all have good linear correlations, and the calibration determination coefficient of the Baseline treatment (R c 2 ) slightly higher than the Baseline+GFS and Baseline+MSC treatments, but both higher than the untreated corrected coefficient of determination (R c 2 ). In terms of errors, the values of the four preprocessing correction root mean square errors RMSEC are shown that the Baseline processing is smaller than the Baseline+GFS processing, and the Baseline+MSC processing is less than the unprocessed value. It can be seen that the error value of the Baseline preprocessing is smaller than that of the others.
[0071] Correlation coefficient (r) and prediction coefficient of determination (R) for the four treatments in internal cross-validation p 2 ) compared with the calibration set, but the overall trend remains unchanged, and it is still that the Baseline treatment is greater than the Baseline+GFS treatment is greater than the Baseline+MSC treatment is greater than the untreated. Compared with the calibration set, the values of root mean square error of prediction (RMSEP) and standard error of prediction (SEP) have increased, but the overall trend remains unchanged, and the error of Baseline preprocessing is still lower than other preprocessing. The analysis and comparison of the data of the established model shows that the Baseline preprocessing has a higher coefficient of determination and smaller error than other preprocessing. The infrared model established later has higher accuracy. At this time, the corrected set root mean square error (RMSEC) and prediction root mean square error (RMSEP) (0.1685 and 0.2841) of the Baseline preprocessed resistant starch mid-infrared model are relatively small, the coefficient of determination of the calibration set (R c 2 ) and the coefficient of determination for internal cross-validation (R p 2 ) (0.9371 and 0.8282) are closer to 1, indicating that the infrared model of wheat grain resistant starch content established with Baseline pretreatment has better prediction performance, which is the prediction model for wheat grain resistant starch content determination.
[0072] (7) Model external verification;
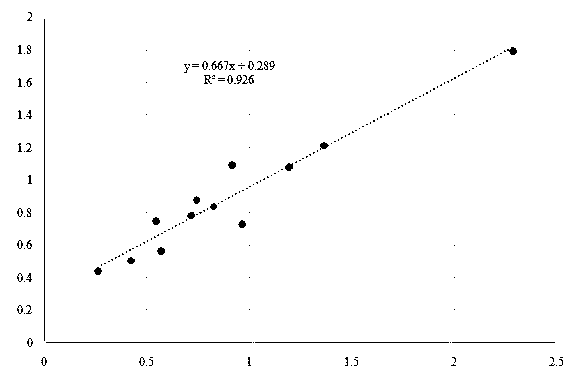
[0073] The specific method is to select "predict" in the task bar of Unscrambler 9.7 software, in the prediction box, select 12 external validation set materials for the sample set, select the spectral variable for the independent variable, select the chemical value of resistant starch for the dependent variable, and select the Baseline prediction for the model. Model, click "OK", the system can automatically predict the predicted value of the external validation set material, and the predicted value is shown in the following table (4). In addition, the predicted values and chemical values of the 12 external validation set materials were entered into Excel, and linear regression analysis was performed to further verify the accuracy of the prediction model. The regression analysis results are shown in the attached manual. figure 1 shown.
[0074] Table (4) Prediction results with the best preprocessing and without preprocessing
[0075]
[0076] Table 4 and figure 1 is the external test result of the prediction model preprocessed by Baseline. The results show that the average absolute error of the prediction model preprocessed by Baseline for the predicted values of resistant starch content of the 12 external validation set materials is 0.153, and the average deviation is 0.233 , the coefficient of determination R for the predicted and chemical values 2 It is 0.9266, indicating that the mid-infrared prediction model with the best Baseline preprocessing is better in terms of precision and accuracy. It can be seen that the content prediction model established by mid-infrared spectroscopy can be used in practical applications, that is, for the prediction of resistant starch content in wheat grains.
[0077] In order to verify the accuracy of the present invention, the present invention has done the following test:
[0078] Test materials: 1010 grains of YUW-1-207 wheat mutant material and 30 YUW-1-207 wheat controls that were not treated with ionizing radiation were screened from the M3 generation planted in the field after 50 Gy of Li ion irradiation. material grains. YUW-1-207 is a high-generation wheat material selected by Changjiang University and Jingzhou Academy of Agricultural Sciences.
[0079] experiment procedure:
[0080] 1) Distribute about 8g each of the harvested 1010 YUW-1-207 mutant material grains and 30 YUW-1-207 control material grains. After removing impurities, crush them with a cyclone equipped with a 0.8 mm sieve plate The machine grinds the wheat grains into fine powder, and then puts the obtained whole wheat flour into a sealed bag, and puts it in an open state in a drying oven at 40 °C for 8 hours.
[0081] 2) Spectrometry was performed with the Nicolet is5 Fourier transform infrared spectrometer produced by Thermo Fisher Scientific, and the 1010 YUW-1-207 wheat mutant materials and 15 were recorded with OMNIC 8.2 intelligent software. The spectral data of YUW-1-207 wheat reference material; the process is: first, turn on the instrument in the order of the optical table, printer and computer, wait for about 3 minutes after the optical table is stable, then open the OMNIC measurement software, the instrument will automatically detect all Put in the id7 ATR accessory, check the optical stage status indicator is normal, set the parameters, that is, the spectrum collection range is 4000-525cm -1 , the resolution is 4cm -1 , The number of scans is 16 times, first collect the background, take about 0.01g of wheat flour with the small spoon that comes with the device and put it into the detection port, rotate the probe clockwise until a sound is heard, and then in the OMNIC8.2 software The material spectrum data can be recorded automatically deducting the atmospheric background. After each material is measured, the probe and detection window are wiped with absolute ethanol, and the next material spectrum is collected after natural drying. In this way, spectral data of 1010 YUW-1-207 wheat mutant materials and 15 YUW-1-207 wheat control materials can be obtained.
[0082] 3) Import the spectral data of 1010 YUW-1-207 wheat mutants and 15 YUW-1-207 control materials into Unscrambler 9.7. In the sample editing of the software, the above 51 corrections used to establish the prediction model Set material data (which contains chemical value data and spectral data) as calibration set data; set the spectral data of 1010 YUW-1-207 wheat mutant materials as validation set 1; set 15 YUW-1-207 The spectral data of the wheat reference material was set as the validation set 2, and then the independent variable was edited as a spectral variable and the dependent variable was edited as a chemical value variable; then the Baseline preprocessing method was selected to preprocess the 51 calibration set materials, and then in the task In the column, the partial least squares PLS1 method was selected for modeling. In the PLS1 regression analysis, 51 calibration set materials were selected as the sample set, the spectral variable was the independent variable, and the chemical value of resistant starch was the dependent variable. In order to ensure the robustness of the model, Click to select the full cross-validation method, and click "OK" to complete the establishment of the best prediction model and save it; then select "predict" in the task bar, and in the prediction box, select only 1010 copies of spectral data for the sample set Validation set 1, the independent variable selects the spectral variable, the model selects the saved Baseline prediction model, and clicks "OK", the system can automatically predict the resistant starch content of the 1010 YUW-1-207 wheat mutant materials to be tested; then predict 15 The resistant starch content of the YUW-1-207 control material, also select "predict" in the task bar, in the prediction box, the sample set selects 15 validation sets with only spectral data 2, the independent variable selects the spectral variable, and the model selects Save the Baseline prediction model, click "OK", the system can automatically predict the resistant starch content of the 15 YUW-1-207 wheat control materials to be tested.
[0083] 4) Select the remaining 15 YUW-1-207 control materials, and use the resistant starch kit to measure the resistant starch content of the 15 YUW-1-207 control materials according to the AOAC method 2002.02 resistant starch determination principle. to measure.
[0084] 5) Select the predicted mutant YUW-1-207 of suspected highly resistant starch, and use the resistant starch kit to measure the content of resistant starch according to the AOAC method 2002.02 determination principle of resistant starch.
[0085] test results:
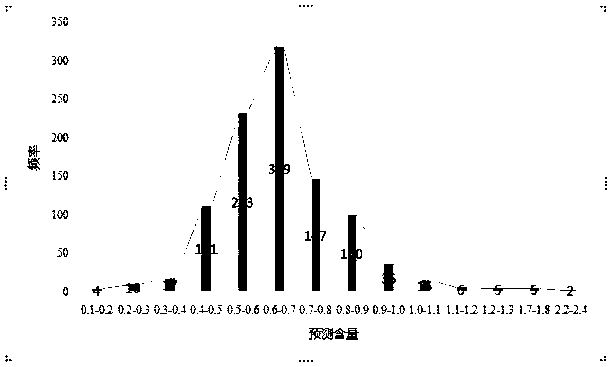
[0086] The resistant starch content of 1010 YUW-1-207 wheat mutant grains predicted by the prediction model preprocessed by Baseline is as attached to the specification. figure 2 shown.
[0087] from figure 2 It can be concluded that the predicted value of resistant starch content in 963 copies is between 0.3% and 1.0%, accounting for 95.3% of the total mutants. The predicted value of resistant starch content was between 0.1% and 0.3% in 14 samples, 31 samples were between 1.0% and 1.8%, and 2 samples were between 2.2% and 2.4%.
[0088]Using the prediction model preprocessed by Baseline to predict the resistant starch content of 15 wheat control materials of YUW-1-207, the predicted values of the 15 wheat control materials are: 0.312%, 0.665%, 0.607%, 0.683%, The predicted values of resistant starch content of these YUW-1-207 control materials ranged from 0.627%±0.17. Analysis of variance showed that the mutants with predicted grain resistant starch content between 0.3% and 1.0% had no significant change compared with the predicted value of YUW-1-207 control material resistant starch; the predicted grain resistant starch content was 0.1%. There were 4 suspected low-resistant starch mutants between %-0.2% and 7 suspected high-resistant starch mutants between 1.7%-2.4% predicted grain resistant starch content.
[0089] The content of resistant starch of 15 YUW-1-207 reference materials was determined by the chemical method used above, and the measured resistant starch contents of 15 YUW-1-207 reference materials were: 0.615%, 0.623%, 0.592%, 0.569%, 0.607%, 0.561%, 0.554%, 0.607%, 0.635%, 0.629%, 0.640%, 0.621%, 0.597%, 0.618%, 0.507%, the average content is 0.598%, it can be seen that the resistance of the wheat control material The content of resistant starch was in the range of 0.598%±0.04. The chemical values of the 15 resistant starch content measured by the chemical method were compared with the predicted value of the resistant starch content of the above 15 control materials by Turkey method, and the p value was 0.5205. , it can be shown that the predicted value of resistant starch content in the mutant control material has no significant change compared with the actual value of resistant starch content measured by chemical method.
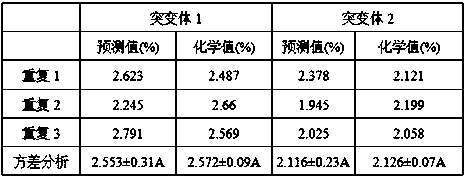
[0090] Finally, the chemical values of the two suspected highly resistant starch mutants with the above predicted values ranging from 2.2% to 2.4% were measured. The results are shown in Table 5.
[0091] table 5
[0092]
[0093] The rationality of the model application and the feasibility of the prediction of the mid-infrared model are further illustrated. It can be clearly drawn from Table 5 that the ANOVA results show that there is no significant difference between the predicted and chemical values of the two suspected highly resistant starch mutants; thus, the accuracy of the infrared model prediction is further verified.
[0094] The method for rapid determination of resistant starch content in wheat grains achieves the purpose of rapidly determining the content of resistant starch in wheat grains by establishing a mid-infrared spectroscopy model about the content of resistant starch in wheat grains, which is more rapid than chemical determination methods. , High efficiency and environmental protection, to meet the needs of people's use.
PUM


Description & Claims & Application Information
We can also present the details of the Description, Claims and Application information to help users get a comprehensive understanding of the technical details of the patent, such as background art, summary of invention, brief description of drawings, description of embodiments, and other original content. On the other hand, users can also determine the specific scope of protection of the technology through the list of claims; as well as understand the changes in the life cycle of the technology with the presentation of the patent timeline. Login to view more.