A biomarker for early diagnosis of diabetes and its application
A target, fasting blood glucose technology, applied in the biological field
- Summary
- Abstract
- Description
- Claims
- Application Information
AI Technical Summary
Problems solved by technology
Method used
Image
Examples
Embodiment 1
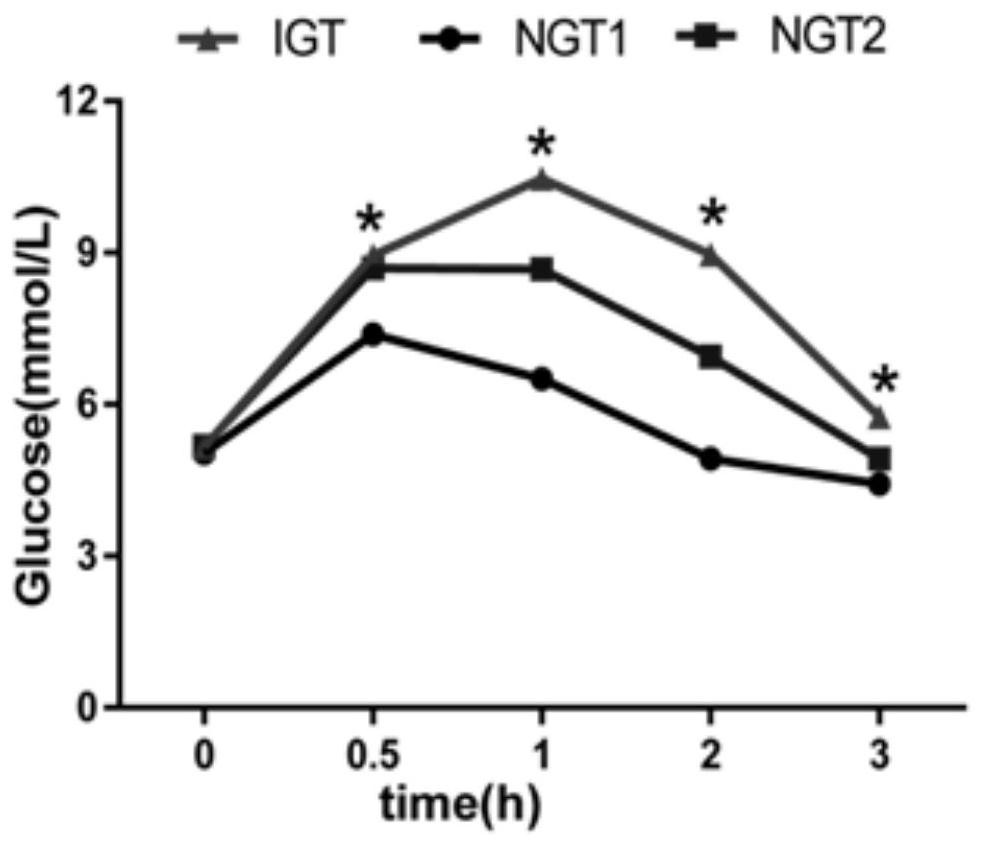
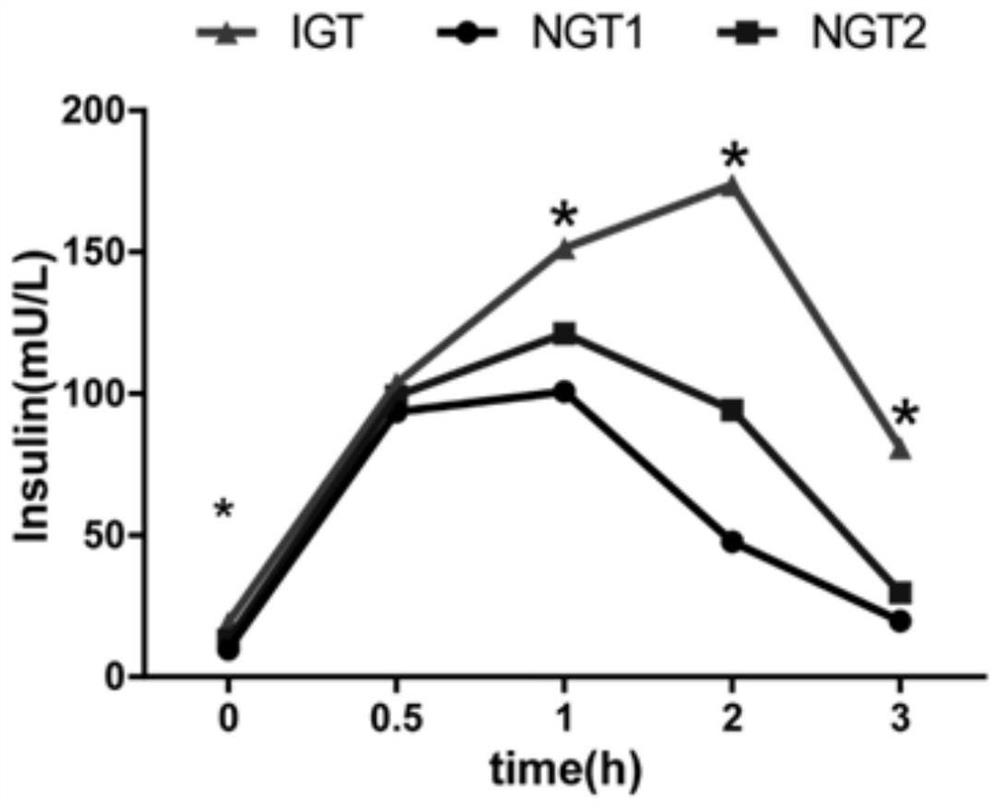
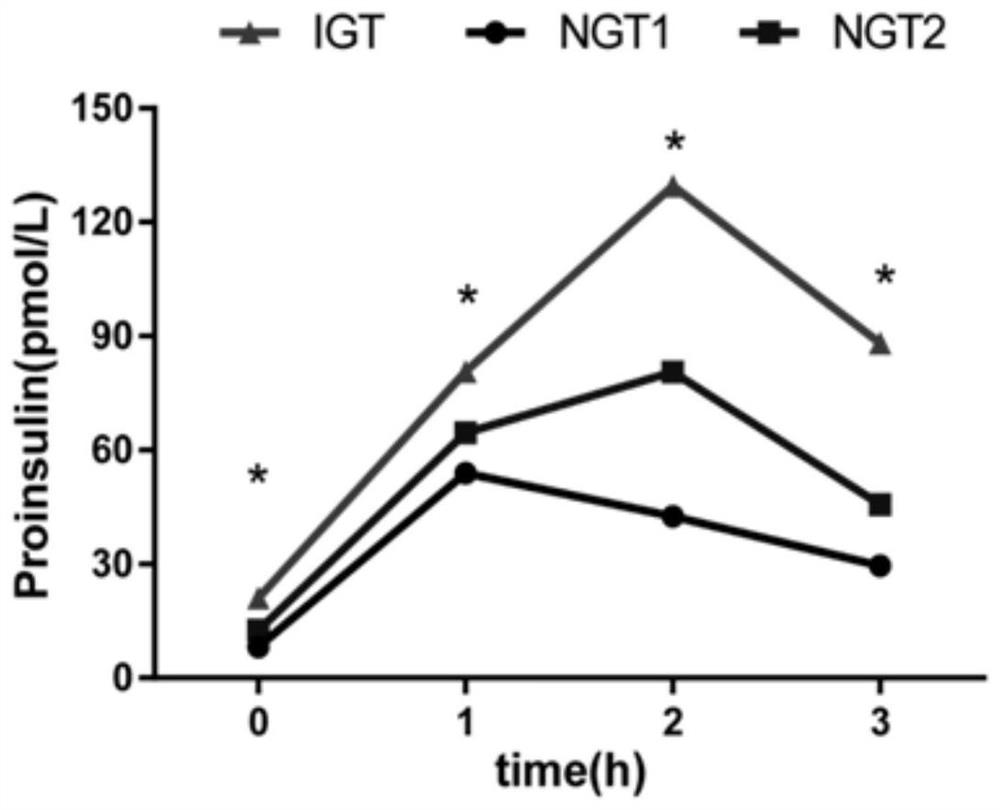
[0031] In this example, subjects are divided into groups according to the level of PBG2h, the name of this group is: PBG2h group, and is specifically divided into three groups: NGT1, NGT2 and IGT.
[0032] The PBG2h grouping criteria are shown in Table 1.
[0033] Table 1. PBG2h grouping criteria
[0034]
[0035] Note: Conversion of blood sugar unit: 1mmol / L=18mg / dL
[0036] The basic information of the three groups in the PBG2h group showed that the age of the IGT group was significantly higher than that of the NGT1 group (p<0.01); the BMI, abdominal circumference and family history of diabetes of the IGT and NGT2 patients were significantly higher than those of the NGT1 group (p<0.01); The blood pressure in the NGT2 group was significantly higher than that in the NGT1 group (p<0.01) (see Table 2). That is to say, the risk of developing diabetes increased in the NGT1, NGT2 and IGT groups sequentially. The dynamic change curves of blood glucose and insulin after glucose...
Embodiment 2
[0049] In order to avoid the influence of insulin on the results, in this example, the subjects combined with insulin levels were regrouped on the basis of the PBG2h group in Example 1. The name of this group is: insulin group, which is specifically divided into: NI group (normal insulin group ) and HI group (high insulin group), among which, NI group is divided into two subgroups, NI-NGT1 group and NI-NGT2 group; HI group is divided into HI-NGT1 group, HI-NGT2 group and IGT group. subgroup.
[0050] The criteria for HI grouping were fasting insulin ≥18mU / L and / or 2h insulin ≥75mU / L and / or peak insulin ≥150mU / L.
[0051] The results showed that the proinsulin secretion curve of the above five subgroups was a unimodal curve, and the curves of NI-NGT1 and HI-NGT1 peaked at 1 h, while NI-NGT2, HI-NGT2 and IGT peaked at 2 h (see Figure 2A , Figure 2B and Figure 2C ), which is consistent with the results of Example 1. At the same time, the area under the curve of proinsulin ...
Embodiment 3
[0054] In order to further confirm that the function of pancreatic islet β-cells decreased sequentially in NGT1, NGT2 and IGT groups, in this example, by calculating and comparing the evaluation indexes of pancreatic islet β-cell function in each group, including insulin production index (IGI), insulin sensitivity index (Matsuda index), Insulin resistance index (HOMA-IR), and disposition index (DI), which represents islet beta cell function (see Table 4). The results showed that IGI, which represents insulin production, decreased sequentially in the NGT1, NGT2, and IGT groups, indicating a sequential decrease in insulin production in the three groups (see Figure 3A ); insulin sensitivity index Matsuda index decreased sequentially in NGT1, NGT2 and IGT groups, indicating that insulin sensitivity decreased sequentially in the three groups (p Figure 3B ); the insulin resistance index HOMA-IR increased sequentially in the NGT1, NGT2 and IGT groups, indicating that the insulin resi...
PUM
 Abstract
Description
Claims
Application Information
 - R&D
- Intellectual Property
- Life Sciences
- Materials
- Tech Scout
- Unparalleled Data Quality
- Higher Quality Content
- 60% Fewer Hallucinations
Browse by: Latest US Patents, China's latest patents, Technical Efficacy Thesaurus, Application Domain, Technology Topic, Popular Technical Reports.
© 2025 PatSnap. All rights reserved.Legal|Privacy policy|Modern Slavery Act Transparency Statement|Sitemap|About US| Contact US: help@patsnap.com


