Supercharge Your Innovation With Domain-Expert AI Agents!

Circular array sound source positioning visualization system and method

A sound source localization and array technology, applied in other database browsing/visualization, positioning, radio wave measurement systems, etc., can solve the problems of easy collision damage, poor practicability, complex array structure, etc., to avoid false peaks and improve accuracy Effect

Active Publication Date: 2019-10-01
NORTHEAST DIANLI UNIVERSITY
View PDF13 Cites 4 Cited by
  • Summary
  • Abstract
  • Description
  • Claims
  • Application Information

AI Technical Summary

Problems solved by technology

[0003] Most of the existing sound source localization devices are three-dimensional structures, such as Chinese patent application number 201710362998, which is named: "Robust The microphone array used in the "sound source localization method" has a regular tetrahedral structure, which leads to a large volume of the device, a complex array structure, difficult to move and transport, and prone to collision damage; secondly, the current sound source localization system cannot satisfy Real-time monitoring requirements; the sound source location system can only quantitatively represent the position information of the sound in digital form, and cannot intuitively display the specific position and sound intensity information of the sound source, with low degree of visualization and poor practicability

Method used


Image

  • Circular array sound source positioning visualization system and method
  • Circular array sound source positioning visualization system and method
  • Circular array sound source positioning visualization system and method

Examples


Embodiment 1

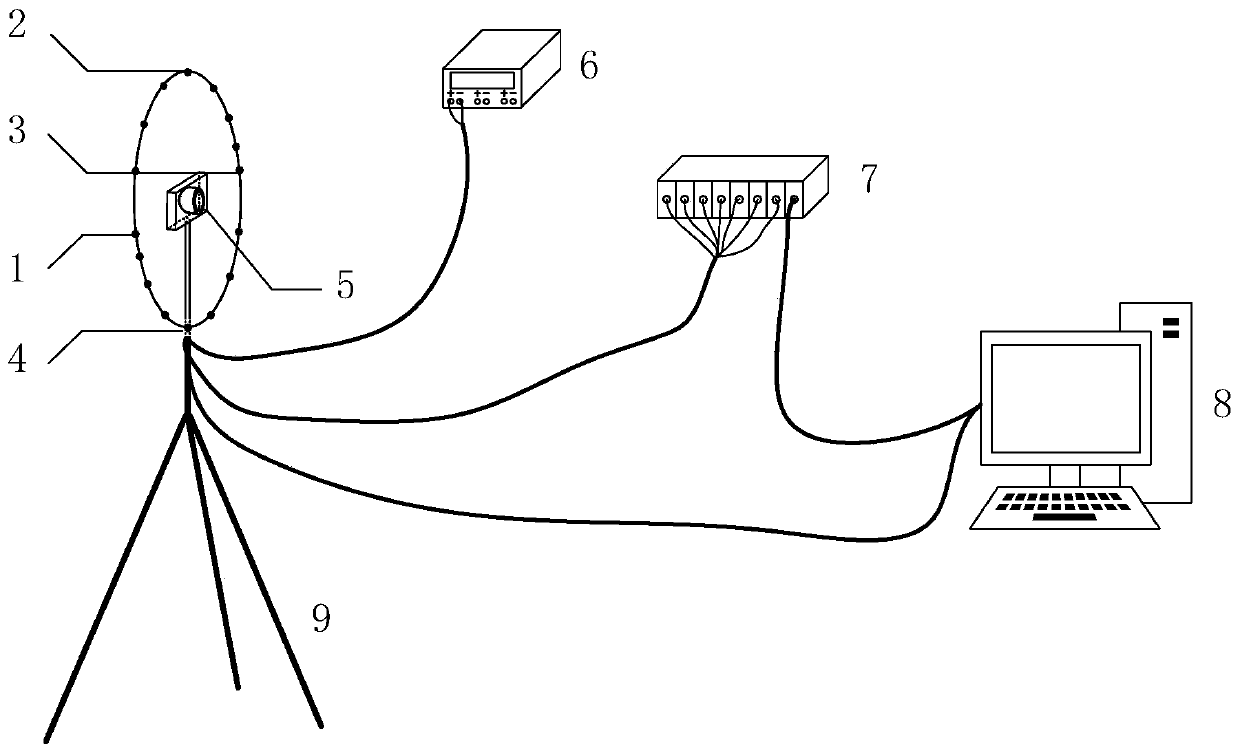
[0097] This embodiment discloses a circular array sound source localization visualization system, such as figure 1 As shown, for sound collection, visual data collection, power supply, data collection, data processing display and mechanical structure, including:

[0098] The sound collection part is composed of a microphone array, 16 microphones are evenly distributed on a circle with a radius of 20cm, and the microphones are M4261 microphones produced by NTi Company; among them, 1 is the first microphone, 2 is the fifth microphone, and 3 is the ninth microphone , 4 is the 13th microphone;

[0099] In the visual collection part, 5 is an industrial camera, the optical center of which coincides with the center of the array circle, and the optical axis points to the same direction as the pickup head of the microphone;

[0100] The power supply part, 6 is the power supply, which provides 5V DC power supply to the microphone;

[0101] In the data acquisition part, 7 is a data acq...

Embodiment 2

[0105]This embodiment discloses a sound source localization method of a circular array sound source localization visualization system, which is applied to sound data processing and calculation, including:

[0106] Obtain the sound signal received by each microphone, and perform preprocessing such as extraction, denoising, pre-emphasis, windowing, and framing;

[0107] Calculate the delay of the 5th microphone and the 13th microphone, and use the cross-correlation method to calculate the cross-correlation of the data received by the 5th microphone and the 13th microphone calculate Obtain the value of τ at the maximum value, and obtain the time difference τ;

[0108] Judging the quadrant of the sound source according to the positive or negative of the time difference τ, determine the azimuth search range, if the time difference is positive, the azimuth search range is 180°~360°, if the time difference is negative, the azimuth search range is 0°~180° ;

[0109] Calculate the...

Embodiment 3

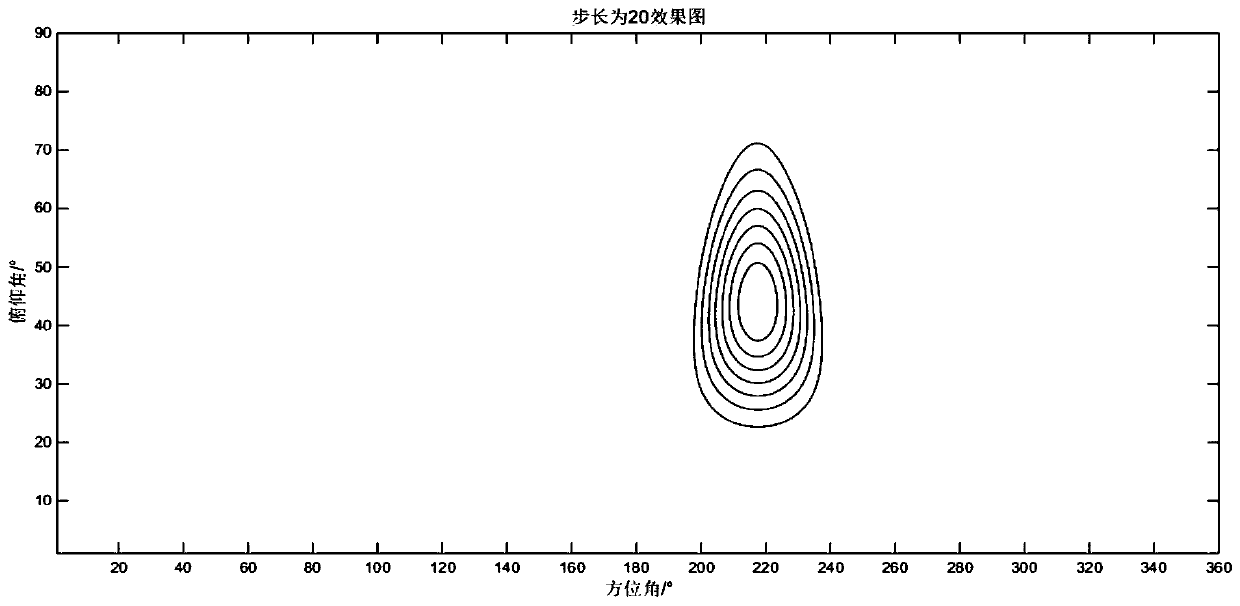
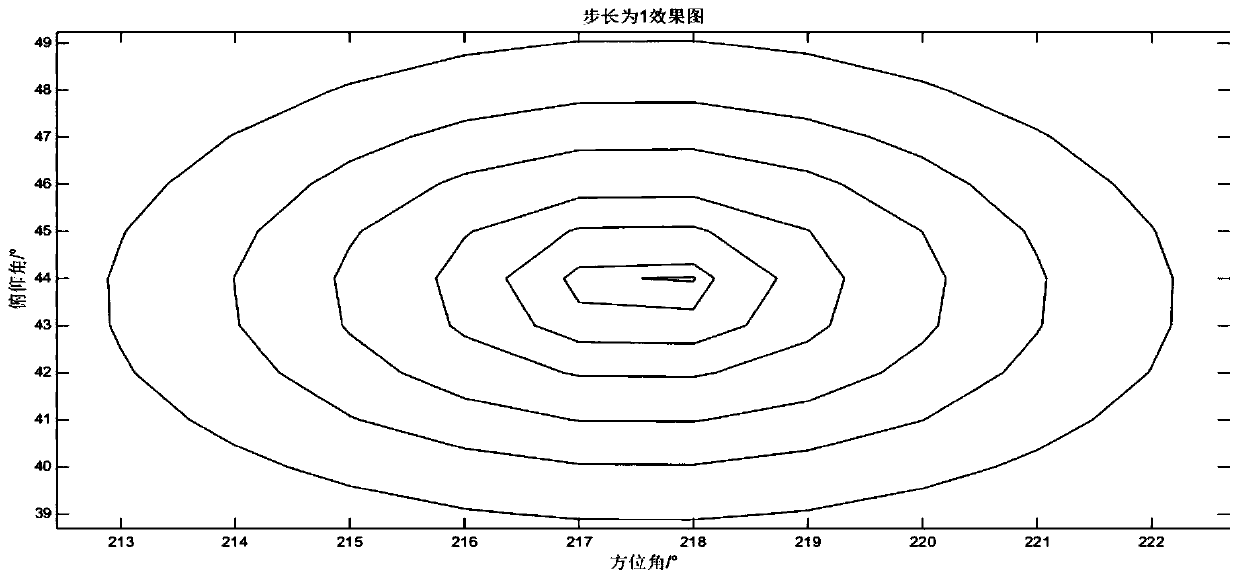
[0120] This embodiment also discloses a sound source localization method of a circular array sound source localization visualization system, which is applied to the matching display of sound source position information in a visual scene, specifically including:

[0121] Calculate the distance l from the center of the sound source array, including:

[0122] Select the 1st microphone, the 5th microphone, the 9th microphone, and the 13th microphone, and the coordinates are A 1 (r,0,0),A 2 (0, r, 0), A 3 (-r,0,0), A 4 (0,-r,0), the time when the sound source arrives at each microphone is τ 1 , τ 2 , τ 3 , τ 4 , then the time difference between the sound source reaching the microphone is τ ij (i,j=1,2,3,4), the speed of sound is c, and the distance l between the sound source and the center of the array is calculated:

[0123]

[0124] where the time difference between the sound source reaching the microphone is τ ij (i,j=1,2,3,4), obtained by the generalized cross-corre...


PUM


Abstract

The invention relates to a circular array sound source positioning visualization system, and the system is characterized by comprising 16 microphones, a vision acquisition module, a data acquisition module and a data processing module, wherein 16 microphones are uniformly distributed on a circle with the circle center of O and the radius of r; the vision acquisition module is provided with an industrial camera at the position where the center of a circle O, namely the optical center is, and the optical axis is outward and coincides with the Z axis, the industrial camera is electrically connected with an upper computer, the data acquisition module is a data acquisition card which is electrically connected with the output ends of the 16 microphones, the data acquisition card is connected with the upper computer, the data processing module processes and calculates the acquired visual data and sound data, calculates the angle of a sound source, and displays the position of the sound sourcein a photo and the sound intensity power of the sound source. The invention also comprises a sound source positioning method. The angle searching range can be obtained, and the occurrence of pseudo peaks is avoided; the variable step power spectrum peak searching angle is adopted to gradually approach the sound source angle, so that the precision is improved and the calculation times are reduced;and the corresponding angle of a pixel point and the sound intensity power thereof are calculated according to the coordinate inverse mapping to perform image processing to finish image fusion, thereby realizing sound source visualization.

Description

technical field [0001] The technology of the present invention relates to the field of sound source localization, and is a circular array sound source localization visualization system and method. Background technique [0002] In the existing technology, the operating conditions of nuclear power plant equipment are becoming more and more complex, and there are more and more failure reasons. It is becoming more and more difficult to detect equipment failures relying on manual experience. Therefore, automatic equipment failure detection technology is becoming more and more important. Acoustic detection technology has gradually attracted the attention of nuclear power enterprises due to its non-contact characteristics. Since the operation of faulty mechanical equipment is always accompanied by machine noise, these noise signals contain fault information about the operation of mechanical equipment, so the fault sound source of the equipment can be located through mechanical nois...

Claims


Application Information

Patent Timeline
Patent Type & Authority Applications(China)
IPC IPC(8): G01S5/22G01S5/20G06F16/904
CPCG01S5/22G01S5/20G06F16/904
Inventor 苏庆宇王锴文陈东升侯一民沈学强陈康尺圣斌
Owner NORTHEAST DIANLI UNIVERSITY
Features
  • R&D
  • Intellectual Property
  • Life Sciences
  • Materials
  • Tech Scout
  • Unparalleled Data Quality
  • Higher Quality Content
  • 60% Fewer Hallucinations
Learn More