Construction method, system and device of WebGIS power grid visualization framework based on SpringMVC

A construction method and framework technology, applied in the construction field of WebGIS power grid visualization framework, can solve the problems of high development and maintenance cost, low efficiency of visualization system, complicated operation, etc., achieve low development and maintenance cost, optimize loading and display time , the effect of low coupling

Inactive Publication Date: 2020-02-28
NANJING GUODIAN NANZI POWER GRID AUTOMATION CO LTD
View PDF0 Cites 2 Cited by
  • Summary
  • Abstract
  • Description
  • Claims
  • Application Information

AI Technical Summary

Problems solved by technology

[0005] To sum up, the visualization system based on the existing framework has the defects of low efficiency, complex operation, and high development and maintenance costs.

Method used


Image

  • Construction method, system and device of WebGIS power grid visualization framework based on SpringMVC
  • Construction method, system and device of WebGIS power grid visualization framework based on SpringMVC

Examples


Embodiment Construction

[0050] The present invention will be further described below in conjunction with the accompanying drawings. The following examples are only used to illustrate the technical solution of the present invention more clearly, but not to limit the protection scope of the present invention.

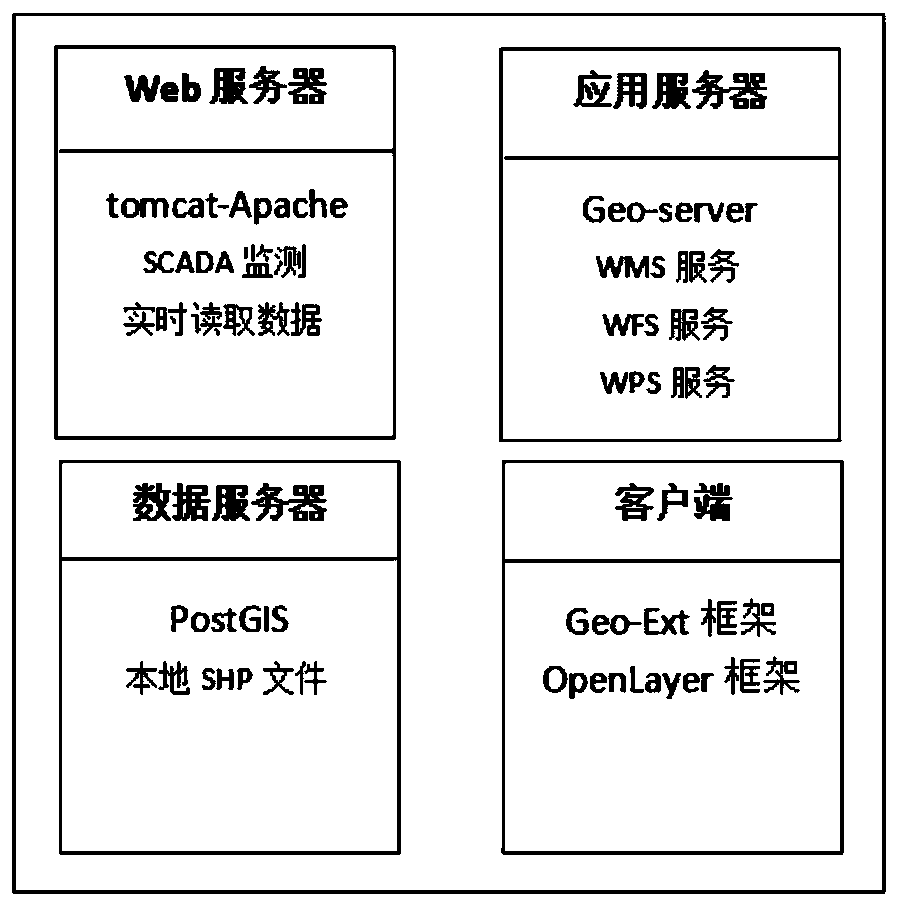
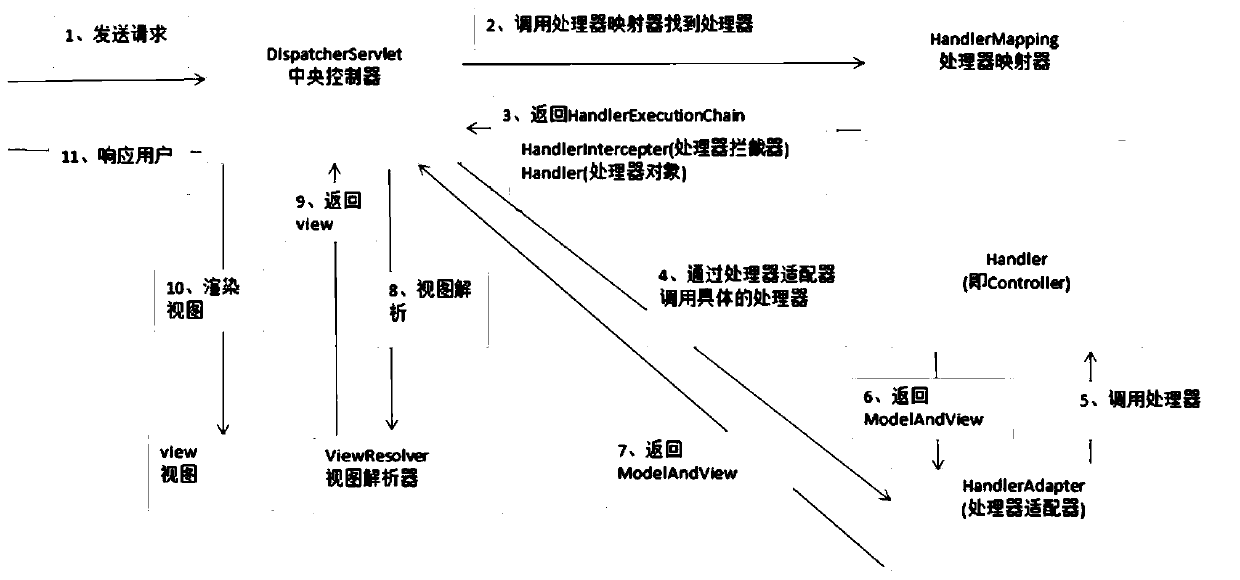
[0051] like figure 1 and 2 As shown, the present invention provides a method for constructing a WebGIS grid visualization framework based on Spring MVC, which involves the construction of a visualization server and a visualization client. Among them, the construction method of the visualization server includes the following process:

[0052] S11. Add the support of SpringMVC library.

[0053] S12. Create a MyEclipse Web project, create a java applet program, and import the Geoserver library into the project.

[0054] S13. Define the mapping relationship between the acquired map data file and the URL of the map drawing engine.

[0055] S14. Create a UI interface in the init() f...


PUM


Abstract

The invention discloses a construction method, system and device of a WebGIS power grid visualization framework based on Spring MVC. The method comprises the following steps: adding support of a Spring MVC library; creating a MyEclipse Web project, creating a java applet program, and importing the Geoserver library into the project; defining a mapping relationship between the obtained map data file and a map drawing engine URL; creating a UI in an init() function of the java applet, and adding the Geoserver object to the UI panel; creating a Geoserver map renderer, calling a map loading methodin a start() function to import a map data file and draw a map so as to serve the WMS; compiling an HTML file to load Applet, and defining a java applet library and a Geoserver library which need tobe loaded to a client under a (Applet) label; wherein the HTML content comprises an application name, a library to be referenced, an entry function and a map Url path in the library. According to theinvention, the spring mvc framework is adopted to construct the visualization system, the system has the advantages of simple configuration, convenient development environment construction and low development and maintenance cost, and the popularization and application of the visualization transformation of the intelligent power grid are facilitated.

Description

technical field [0001] The invention belongs to the technical field of smart grid information visualization, and in particular relates to a construction method, system and device of a WebGIS grid visualization framework based on Spring MVC. Background technique [0002] With the development of the power industry in the era of big data, the amount of data dispatchers are facing is also increasing. In the face of intricate and massive power equipment and ever-changing information data, the traditional power grid graphics system can no longer meet the efficient, stable and safe operation requirements of the smart grid. In view of the massive data in the smart grid, dispatchers urgently need a set of efficient and reliable big data visualization solutions to obtain key system information in a timely manner, monitor system operation, reduce the response time for troubleshooting, and better manage and monitor the power grid. [0003] WebGIS is a geographic information system exte...

Claims


Application Information

Patent Timeline
IPC IPC(8): G06F8/20G06F8/34G06F16/29G06Q50/06
CPCG06F8/24G06F8/34G06F16/29G06Q50/06
Inventor 曾强季玮施广德汪贤浩
Owner NANJING GUODIAN NANZI POWER GRID AUTOMATION CO LTD
Why Eureka
Try Eureka