Method for identifying metal material based on Gaussian distribution of amplitude root-mean-square value
A RMS value, Gaussian distribution technology, applied in analyzing materials, using sonic/ultrasonic/infrasonic waves for material analysis, and processing probe response signals, etc., can solve problems such as high accuracy and probe requirements, and improve accuracy The effect of reducing the interference of human factors and reducing errors
- Summary
- Abstract
- Description
- Claims
- Application Information
AI Technical Summary
Problems solved by technology
Method used
Image
Examples
Embodiment 1
[0069] Example 1: Identification between different metal materials with similar composition
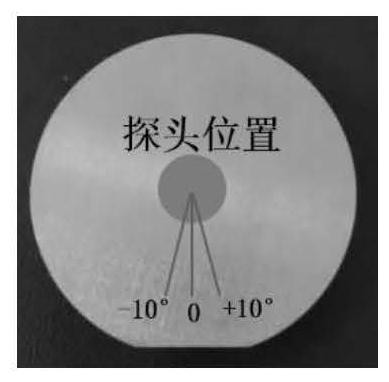
[0070] Experimental samples: three stainless steel round metal samples with the same specification and similar composition, and the materials are Cr17Ni2 (sample No. 1), 2Cr13 (sample No. 2), and 3Cr13 (sample No. 3), with a diameter of 50 mm and a thickness of 15 mm. . Experimental samples such as Figure 5 shown. During the experiment, sample No. 1 was selected as the standard sample, and samples No. 1, 2, and 3 were used as the samples to be identified. The sampling point during the experiment was the center of the sample, which was marked in advance to ensure that the probes were placed in the same position each time.
[0071] In order to ensure the same experimental conditions as much as possible, every time a signal is taken, the coupling agent (water) needs to be added dropwise, and the dosage is one drop.
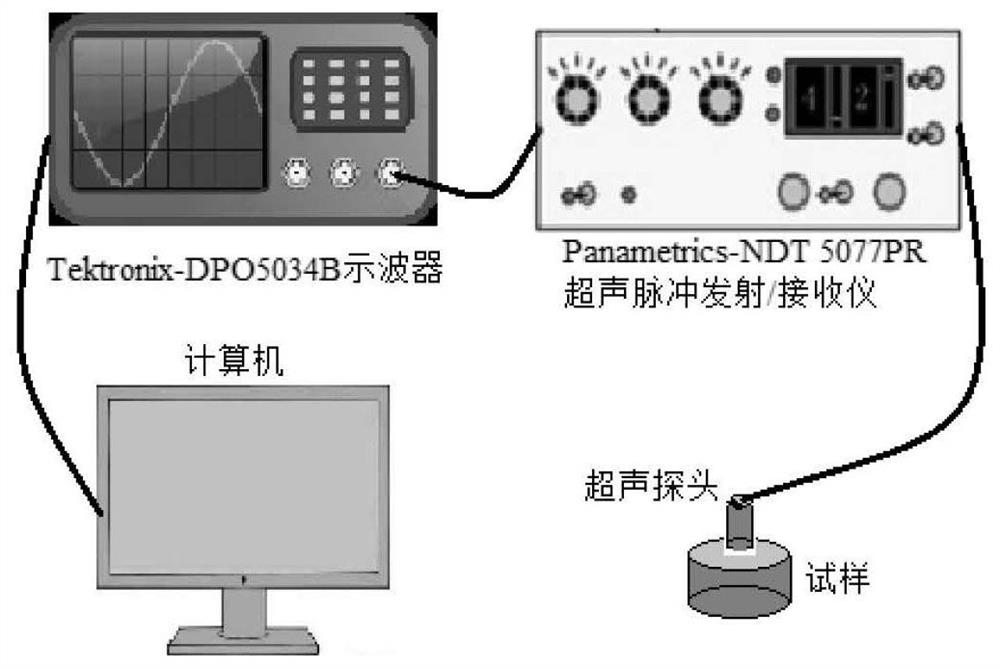
[0072] Instrument device connection: connect the Panametrics-NDT 50...
Embodiment 2
[0106] Example 2: Identification between the same metal material
[0107] The calculation method and identification method used in this embodiment are the same as those in Example 1, the difference is that the samples are selected from three civil woks produced by the same batch of the same material, which are samples No. 4, 5, and 6 respectively. , see Figure 6 .
[0108] Select sample No. 4 as the standard signal, and identify samples No. 4, 5, and 6 to be identified. Similarly, 25 signals were collected for the standard sample, and 7 signals were collected for each sample to be identified. The collection method and identification method are the same as those in Example 1.
[0109] The calculated root-mean-square ratios of the amplitudes of the 25 standard signals of sample No. 4 are: 1.3240, 1.1638, 1.4708, 0.8975, 1.8987, 1.6676, 0.6590, 1.6508, 0.9106, 1.6984, 2.0339, 1.1679, 1.4687, 1.4053, 0.20690, , 0.6495, 3.7978, 1.5213, 1.0375, 1.5984, 1.7641, 1.2393, 1.5168, 0...
PUM
| Property | Measurement | Unit |
|---|---|---|
| diameter | aaaaa | aaaaa |
Abstract
Description
Claims
Application Information
 - R&D
- Intellectual Property
- Life Sciences
- Materials
- Tech Scout
- Unparalleled Data Quality
- Higher Quality Content
- 60% Fewer Hallucinations
Browse by: Latest US Patents, China's latest patents, Technical Efficacy Thesaurus, Application Domain, Technology Topic, Popular Technical Reports.
© 2025 PatSnap. All rights reserved.Legal|Privacy policy|Modern Slavery Act Transparency Statement|Sitemap|About US| Contact US: help@patsnap.com


