Supercharge Your Innovation With Domain-Expert AI Agents!

Hierarchical data visualization method based on Gaussian mixture model clustering algorithm

A Gaussian mixture model and clustering algorithm technology, applied in the field of data visualization, can solve problems such as reduced observability, unresponsive web pages, browser crashes, etc., achieving cost-effective development and use, convenient access to data information, and improved refinement degree of effect

Active Publication Date: 2021-06-22
ANHUI AGRICULTURAL UNIVERSITY
View PDF4 Cites 1 Cited by
  • Summary
  • Abstract
  • Description
  • Claims
  • Application Information

AI Technical Summary

Problems solved by technology

[0004] 1. The amount of data generated after information analysis is relatively large. In the process of using the "force-directed graph" module or "relationship graph" module of some open source visualization libraries, the rendering of the webpage will be extremely slow due to the large amount of data, and finally lead to browsing The server crashes and the page becomes unresponsive
Specifically, when the "force-directed graph" is displayed on the front-end page, when the amount of imported data is greater than a threshold (for different hardware devices, the threshold is also different; the description here is common and moderate hardware devices on the market Running), the Html page needs to be rendered, and the loading is too slow due to too much data, which makes the web page unresponsive, and finally the data visualization fails
[0005] 2. The "force-directed graph" module or "relationship graph" module in the open source visualization tools available on the market is not very good when you need to check the length of the "link line" between nodes. In addition, most of the lines will overlap, similar to "hair balls". It is extremely difficult to accurately find the relationship link lines between two nodes manually, which greatly reduces the observability of people in this regard.
But so far, there is no better, available, and large-scale data visualization method on the market.

Method used


Image

  • Hierarchical data visualization method based on Gaussian mixture model clustering algorithm
  • Hierarchical data visualization method based on Gaussian mixture model clustering algorithm
  • Hierarchical data visualization method based on Gaussian mixture model clustering algorithm

Examples


Embodiment 1

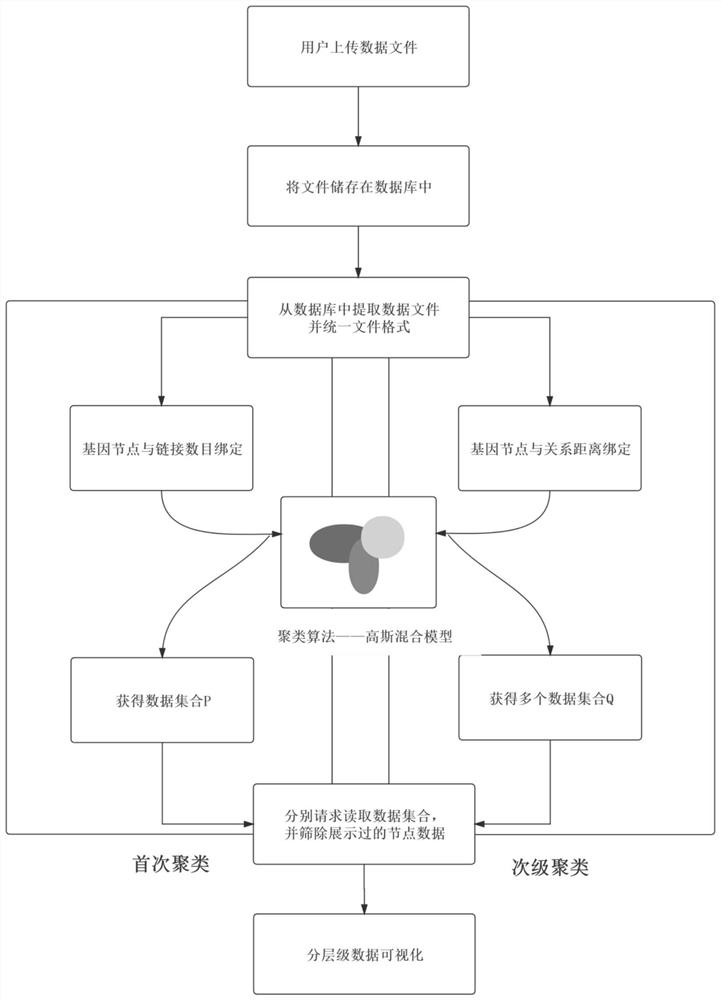
[0046] Such as figure 1 As shown, a hierarchical data visualization method based on the Gaussian mixture model clustering algorithm includes the following steps:

[0047] Step 1: Receive the data file uploaded by the user on the web page and store it in the background database, obtain the data in the background database, and unify the file format;

[0048] Receive the data files uploaded by users in the browser webpage and store them in the background database, and save the extracted data files in the same folder directory. Since the files extracted in the database are .NET files, for subsequent use of data and analysis, will require batch changes to the file format. Add a new bat file to the folder directory where the data file exists, and write the bat file to achieve a unified file format, and iterate the data resource files in the folder to change the file format to a .csv file.

[0049] Among them, the data file contains three types of file data: source, target, and va...


PUM


Abstract

The invention relates to a hierarchical data visualization method based on a Gaussian mixture model clustering algorithm, and the method comprises the following steps: receiving a data file uploaded by a user in a webpage, storing the data file in a background database, and unifying the file format; performing analysis and cleaning preprocessing on the data after the file format unification to obtain data to be clustered; performing primary clustering and secondary clustering on the to-be-clustered data by using a Gaussian mixture model to obtain to-be-displayed data; and establishing a front-end page, and performing hierarchical visual display on the to-be-displayed data by using a virtual rolling technology. According to the method, a processing method for relational gene data clustering is designed by utilizing the thought that gene nodes are marked by serial numbers, hierarchical data display is adopted, only the data of the current hierarchy are loaded for display, and the data are divided into multiple classes according to a clustering algorithm, so that the data volume displayed by one page is greatly reduced, and people can conveniently observe the data.

Description

technical field [0001] The invention belongs to the field of data visualization, and in particular relates to a hierarchical data visualization method based on a Gaussian mixture model clustering algorithm. Background technique [0002] After analyzing and collecting genetic and other data in bioinformatics, most of the data visualization is required. With the rapid development of B / S architecture and the recognition of most users, the method of displaying data through the front-end page is also widely used in biological information. In the visualization of node relationships between genes in biological information, Echarts' relationship diagrams and other open source visualization libraries are often used to refer to the front-end page to realize the process of data visualization based on B / S architecture. [0003] However, this data visualization technology still has the following problems: [0004] 1. The amount of data generated after information analysis is relatively...

Claims


Application Information

Patent Timeline
IPC IPC(8): G06F16/28G06F16/215G06F16/25
CPCG06F16/215G06F16/252G06F16/287
Inventor 毕家泽张平哲陈祎琼高羽佳刘澳张玮
Owner ANHUI AGRICULTURAL UNIVERSITY
Features
  • R&D
  • Intellectual Property
  • Life Sciences
  • Materials
  • Tech Scout
  • Unparalleled Data Quality
  • Higher Quality Content
  • 60% Fewer Hallucinations
Learn More