Inferring gene regulatory networks from time-ordered gene expression data using differential equations

A technique of differential equations and gene expression, which is applied in the field of determining the relationship between genes in organisms, and can solve problems such as inaccessibility

Inactive Publication Date: 2006-01-04
GNI USA +1
View PDF0 Cites 5 Cited by
  • Summary
  • Abstract
  • Description
  • Claims
  • Application Information

AI Technical Summary

Problems solved by technology

However, to reliably infer such an arbitrary system of differential equations requires lo

Method used


Image

  • Inferring gene regulatory networks from time-ordered gene expression data using differential equations
  • Inferring gene regulatory networks from time-ordered gene expression data using differential equations
  • Inferring gene regulatory networks from time-ordered gene expression data using differential equations

Examples


example 1

[0087] Example 1: Gene network in Bacillus subtilis

[0088] Embodiments of the invention for finding gene regulatory networks using gene expression data were recently measured in MMGE gene expression experiments in Bacillus subtilis. MMGE is a synthetic minimal medium containing glucose and glutamine as carbon and nitrogen sources. In this medium, the expression of genes required for the biosynthesis of small molecules, such as amino acids, is induced. In this experiment, the expression level of the 4320 ORF was measured at eight time points in one hour intervals, with two measurements at each time point.

[0089] Data Preparation and Analysis

[0090] To reduce the effect of measurement noise present in the data, the expression level of each gene was compared to the measured background level. Genes with an average gene expression level below the average background level, whether in the red or green channel, were removed from the analysis.

[0091] Global normalization wa...

example 2

[0099] Example 2: Clustering of Bacillus subtilis genes

[0100] These 684 genes of B. subtilis were clustered sequentially into 5 groups using k-means clustering. The distance between genes was measured using Euclidean distance, and the centroid of a cluster was defined as the median of all genes in the cluster. The number of clusters was chosen to avoid significant overlap. The k-means algorithm is repeated 1,000,000 times starting with different random initial clusters. Find the best solution 81 times.

[0101] Complete clustering results are available at the following websites:

[0102] http: / / bonsai.ims.u-tokyo.ac.jp / -mdehoon / publications / Subtilis / clusters.html.

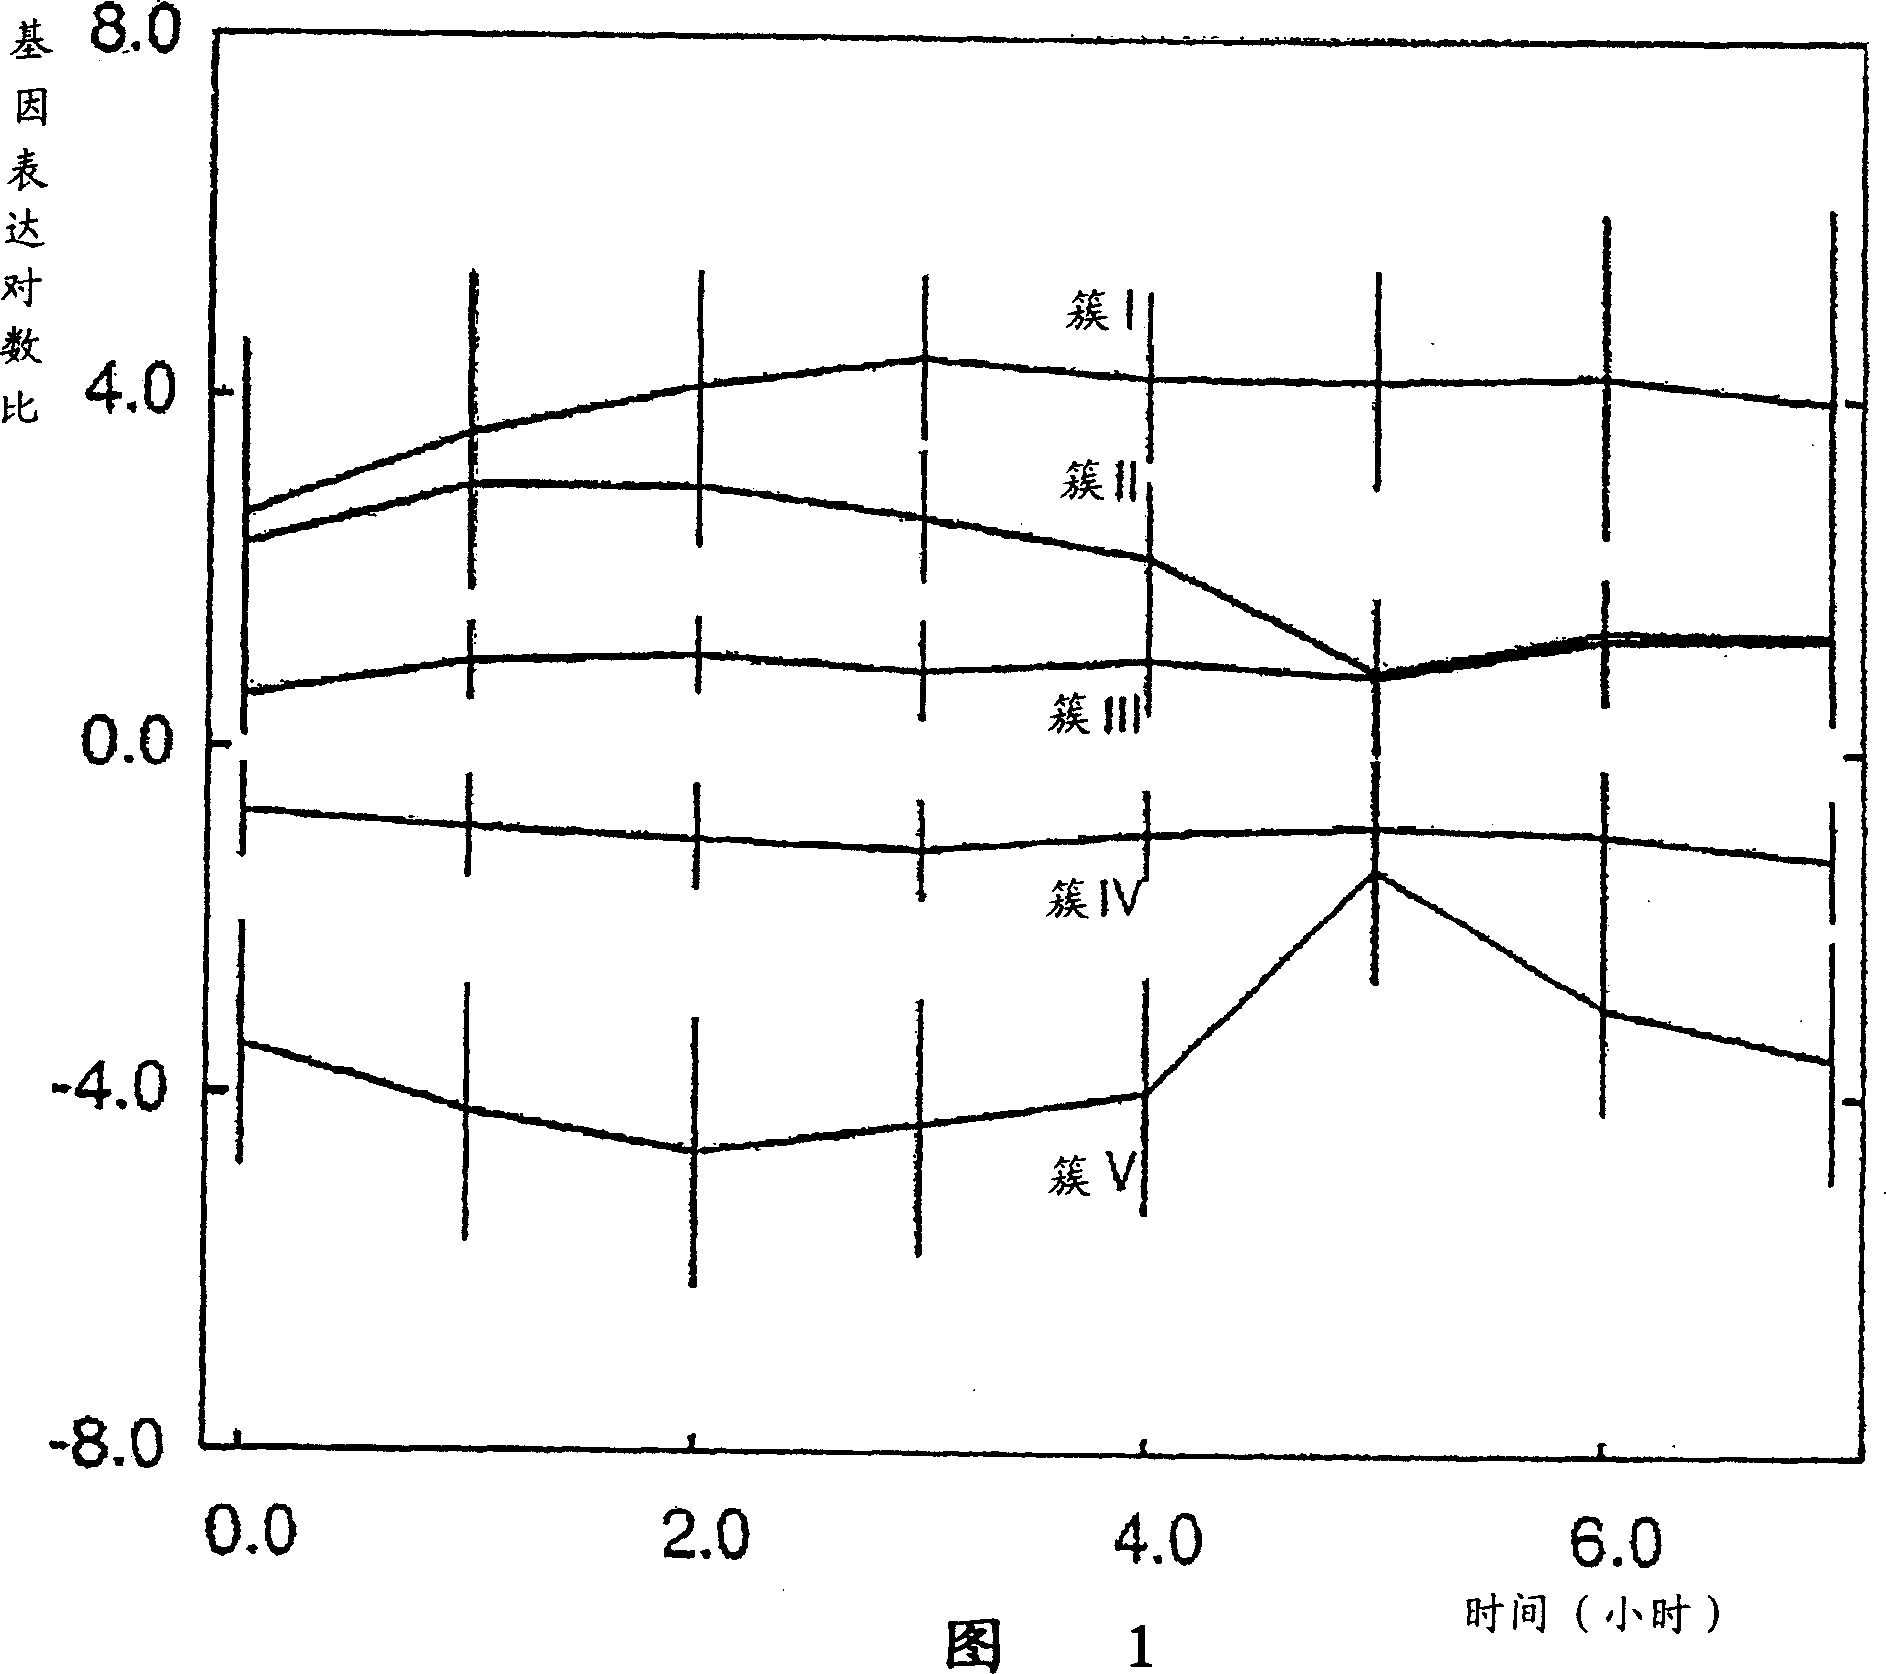
[0103] To determine the biological function of the created clusters, we considered the functional categories of all genes in each cluster in the Bacillus subtilis database. Table 1 lists the main functional categories of the five clusters formed.

[0104] Figure 1 represents the log ratio of gene expr...


PUM


Abstract

Embodiments of methods are provided that can be used to estimate network relationships between genes of an organism using time course expression data and a set of linear differential equations. Aikaike's Information Criterion and mask tools can be used to reduce the number of elements in a matrix by determining which elements are zero or not significantly changed under the conditions of the study. Maximum likelihood estimation and new statistical methods are used to evaluate the significance of a proposed network relationship.

Description

[0001] Related applications: [0002] This application claims priority to US Provisional Patent Application No. 60 / 428,827 filed November 25, 2002 at 35 U.S.C §119(e). Its entire contents are hereby incorporated by reference. technical field [0003] The present invention relates to methods for determining the relationship between genes of an organism. In particular, the present invention includes novel methods for inferring gene regulatory networks from time course gene expression data using linear systems of differential equations. Background technique [0004] One of the most important aspects of current research and development in life sciences, medicine, drug discovery and development, and the pharmaceutical industry is the development of methods and devices for interpreting large amounts of primary data and drawing conclusions based on these data demand. Bioinformatics has made significant contributions to the understanding of systems biology and promises to lead to...

Claims


Application Information

Patent Timeline
IPC IPC(8): G01N33/48G16B5/20C12NC12Q1/68G01N33/50G06F17/13G06F17/18G16B5/10G16B25/10G16B40/00
CPCG06F19/24G06F19/20G06F19/12G16B5/00G16B25/00G16B40/00G16B5/10G16B25/10G16B5/20
Inventor 宫野悟井元清哉米歇尔·J·L·德胡恩
Owner GNI USA
Why Eureka
Try Eureka