
System and methods for user-configurable virtual appliance for advanced analytics using streaming/IoT/big data

a virtual appliance and analytics technology, applied in database management systems, instruments, computing models, etc., can solve the problems of unsatisfactory standardized and easy passing of input and output parameters, no single software tool, for the end user, that can handle “composite data” and other problems

Active Publication Date: 2021-05-04
OPENMETRIK INC
View PDF3 Cites 8 Cited by
  • Summary
  • Abstract
  • Description
  • Claims
  • Application Information

AI Technical Summary

Benefits of technology

The invention is a system that integrates performance measurement from multiple sources of data, including structured, unstructured, and signal data. The system extracts and transforms the data, and stores it in a database. The system also allows users to perform various operations on the data, such as metrics analysis and business intelligence. The technical effects of the invention include improved data accuracy and consistency, improved data utilization, and improved data analysis and reporting. The system can be used in various fields such as manufacturing, logistics, and other fields where performance measurement is important.

Problems solved by technology

It is important to note that, in every advanced analytics application, the end user has to unavoidably deal with “composite data”.
A standardized and easy way to pass such input and output parameters has so far not been achieved.
Second, each of those developer tools are used by trained developers who are certified in the respective languages or tools—and not the end users.
Today, there is NO single software tool, for the end users, that can handle “composite data”.
These tools are not meant for end-users, who wish they could write metrics formulas on their own, like excel formulas for example.
This creates another huge overhead to manage such subsets of data, for different business purposes.
There is no tool today that would help accomplish this step.
In the case of streaming real-time data, dashboards have to display changing trends in real-time, of course with some processing delays.
All these tools are developer tools and APIs, most of which may not readily cater to the needs of big data in real-time.
Even this requires extensive programming.
The unavoidable use of these seven layers of developer tools is not without a reason.
So far, the industry has not been able to arrive at a unified general-purpose appliance, because of these reasons: a) In every case, the underlying source data structures are very different.
And it results in denormalization of the data model or “flattening out the logical schema”- to achieve such optimization needs.
Today there is no standardized way to send control signals as a result of the execution of the AI / ML algorithm that can be readily used by end users i) As the data sets change and as the need for different charts arise, there is no direct way for end users to create new visualizers on their own, without the help of certified BI tool developers like Tableau, Qlik, Power BI etc., j) Such charts, even though they yield very attractive visualization, there is no standardized way to collaborate with comments, issues, action items and meetings or initiate a formal root cause analysis process.
There is no formal collaboration module exclusively meant for analyzing the impact of metrics and insights coming out of advanced analytics applications.
It all involves a lot of custom application development code in many languages, and it creates a huge burden on IT (Information Technology) SMEs for software development, ongoing support and enhancements.
A single tool has not emerged that can handle “composite data” for advanced analytics applications.

Method used


Image

  • System and methods for user-configurable virtual appliance for advanced analytics using streaming/IoT/big data
  • System and methods for user-configurable virtual appliance for advanced analytics using streaming/IoT/big data
  • System and methods for user-configurable virtual appliance for advanced analytics using streaming/IoT/big data

Examples


Embodiment Construction

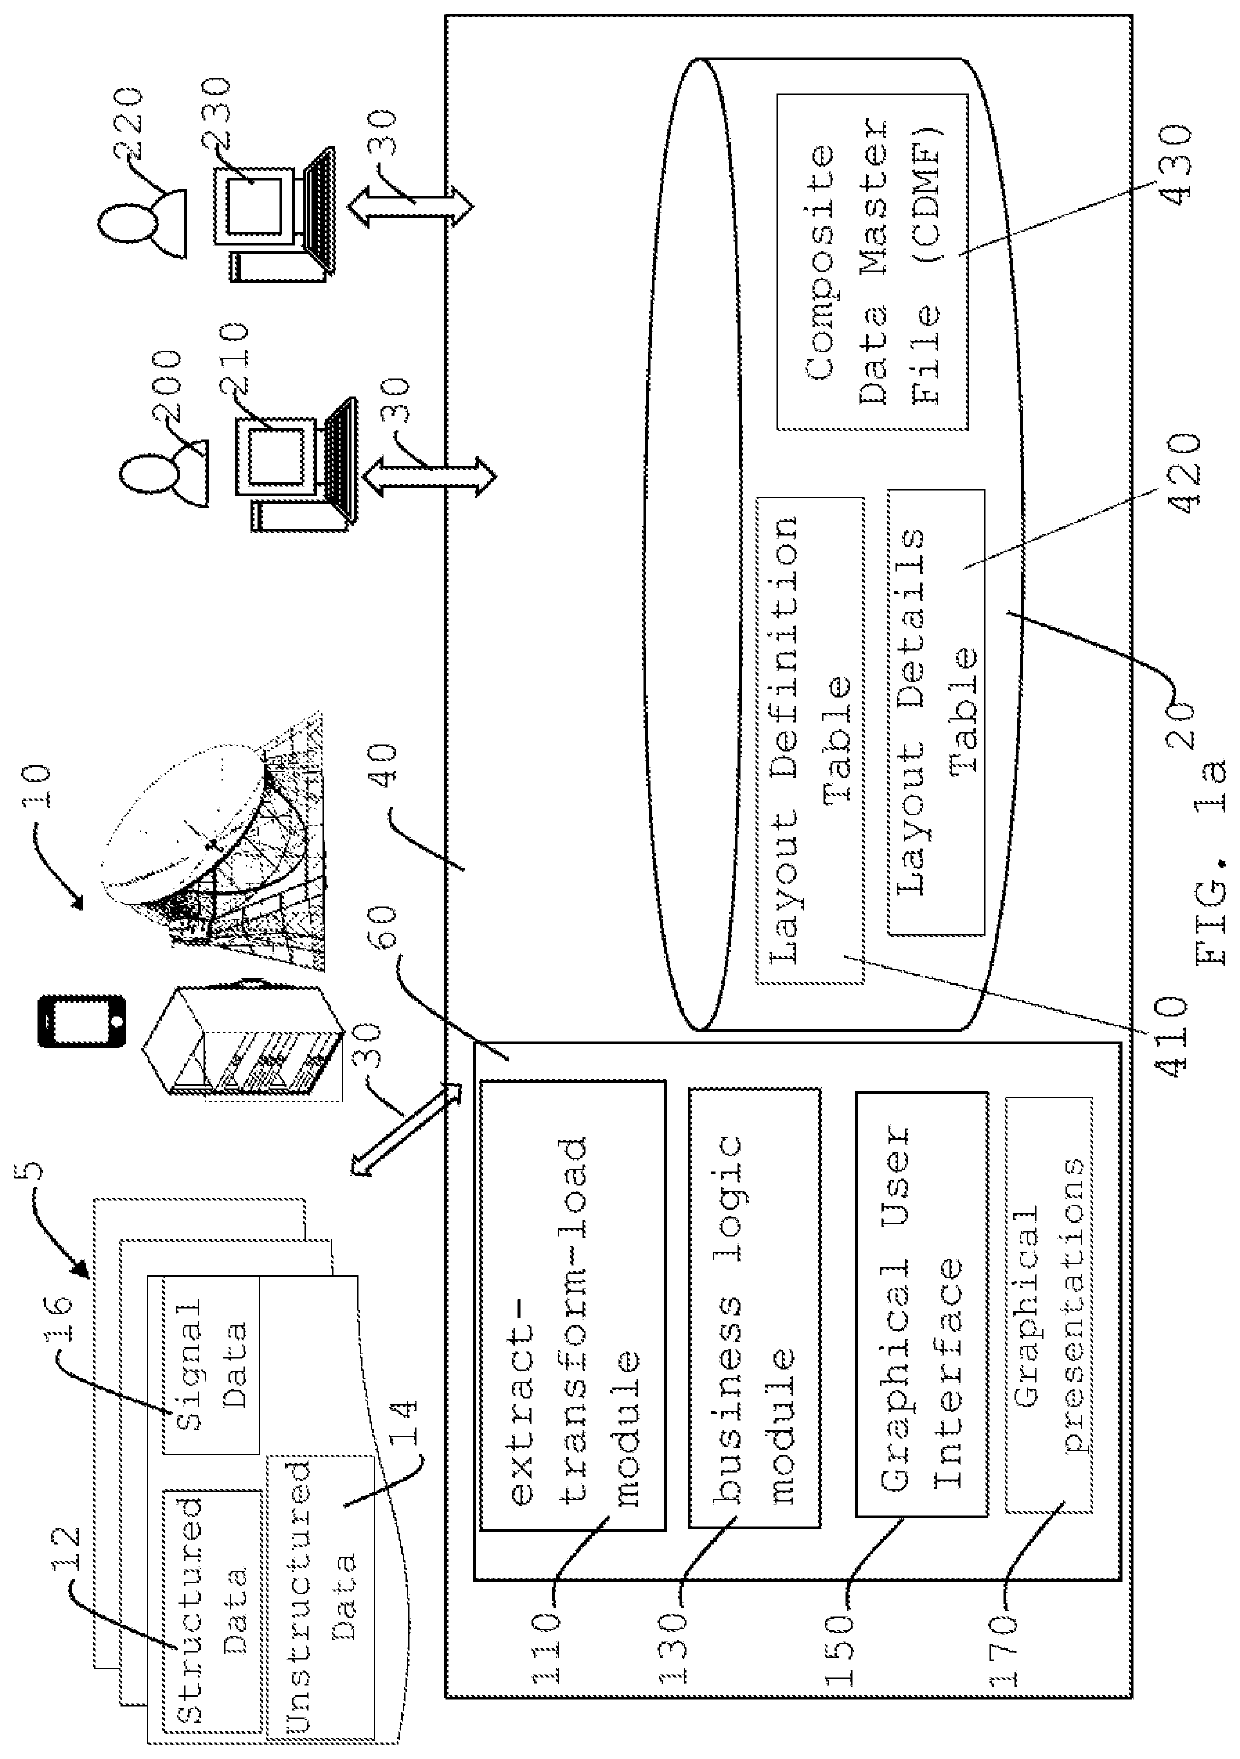
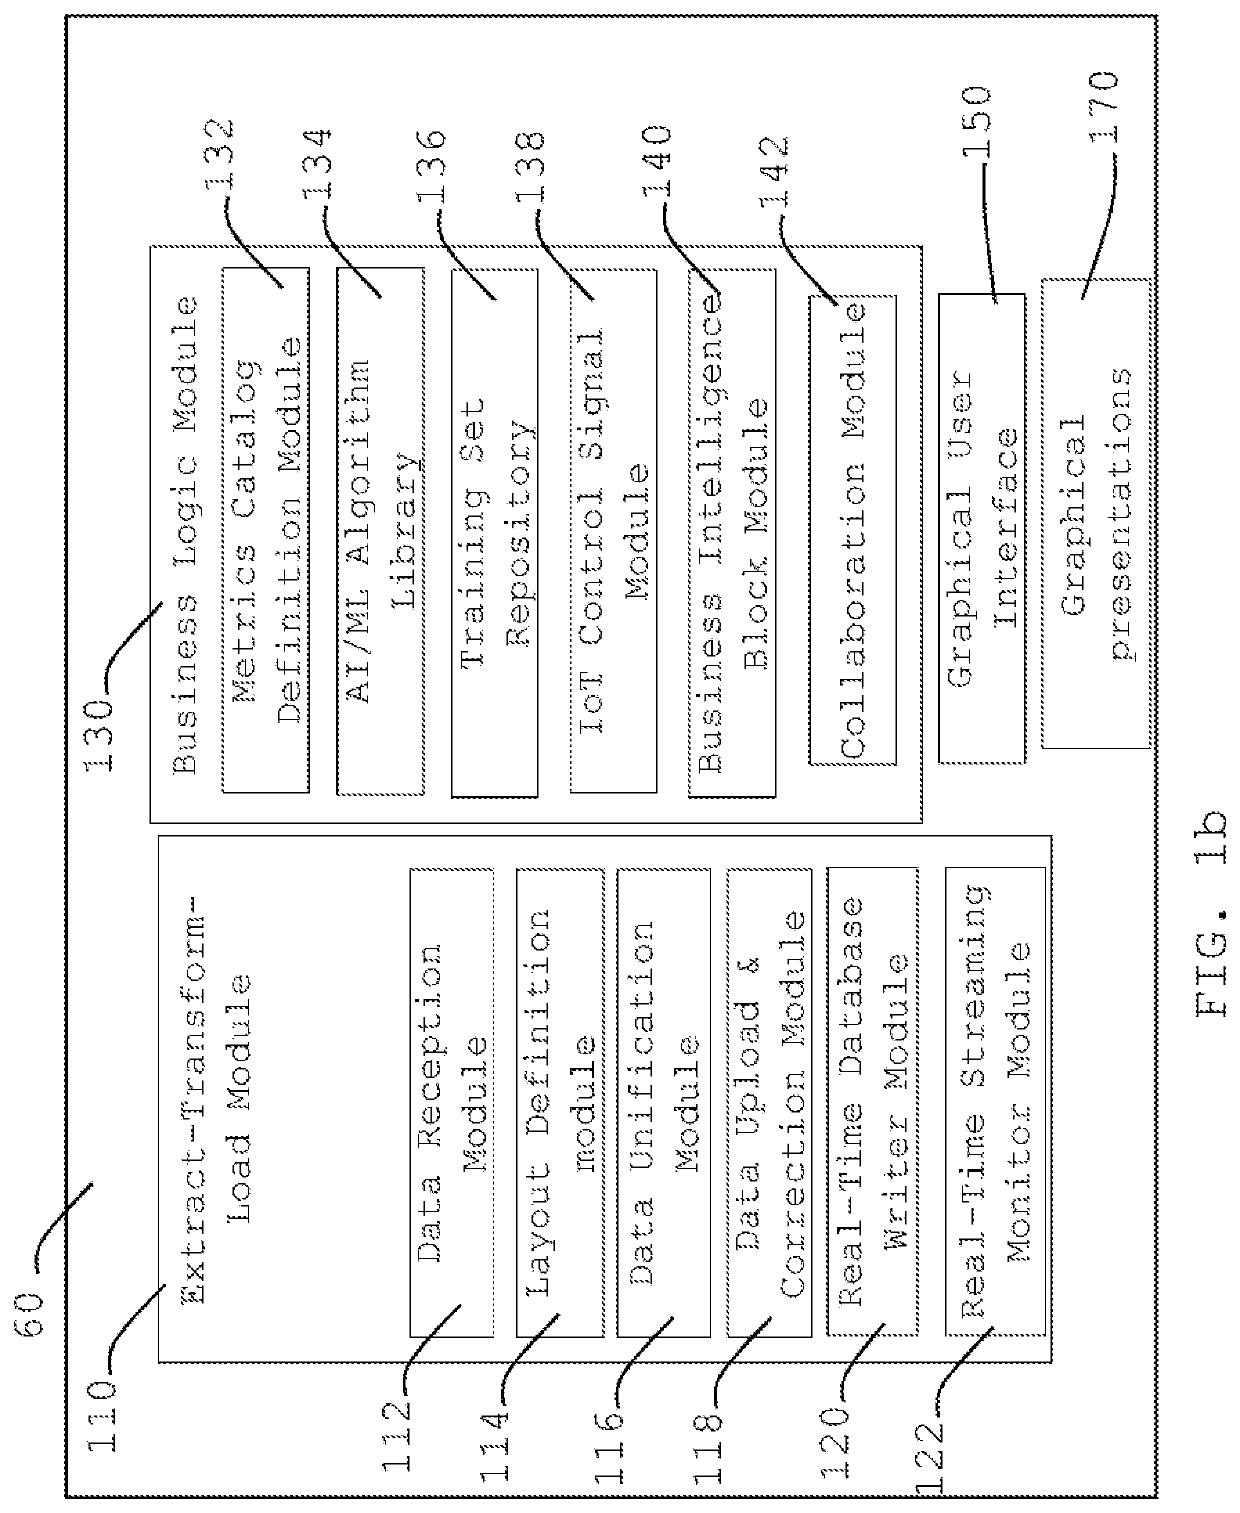
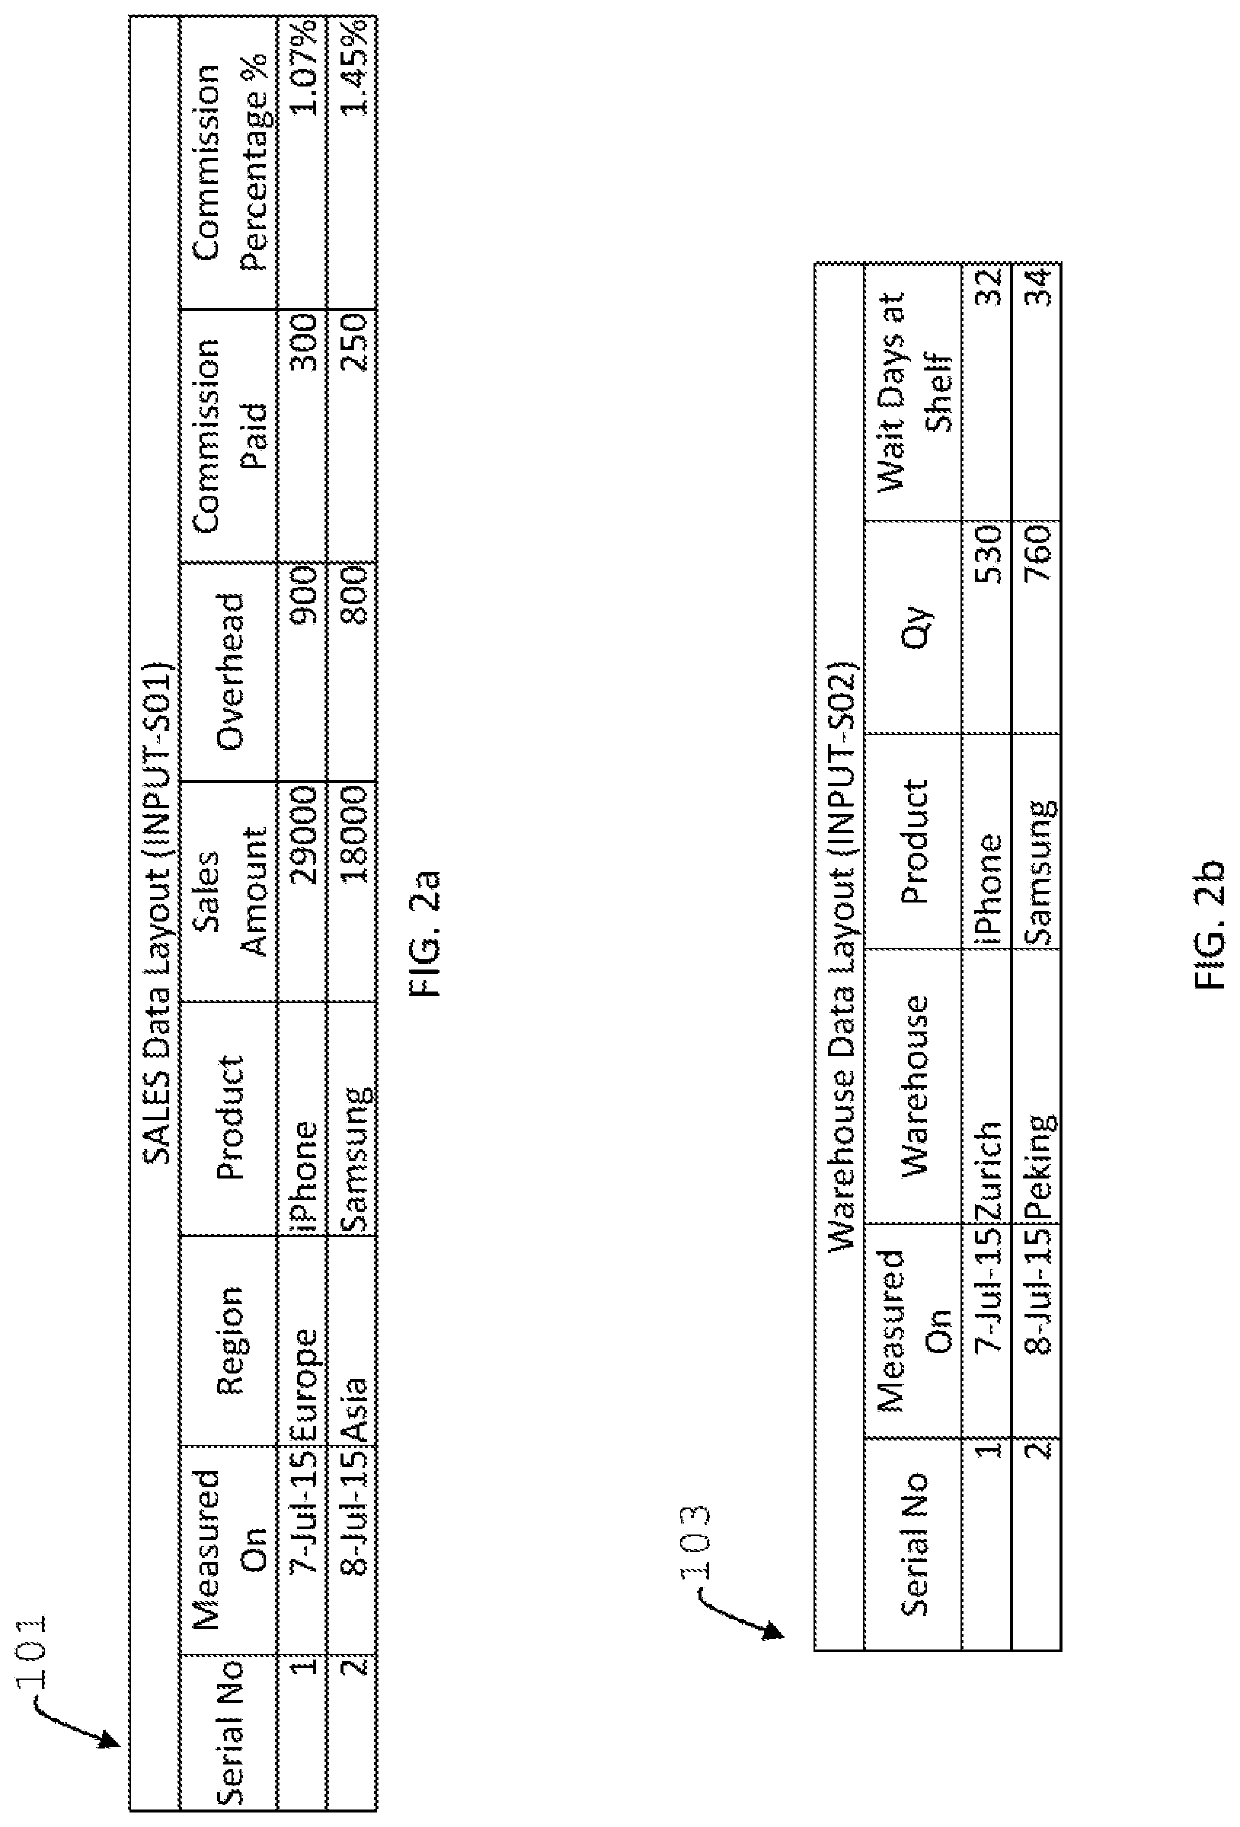
[0058]Referring to FIGS. 1a, 1b, 2a, 2b, 2c, 2d, a preferred embodiment of a system for integrated performance measurement environment, which comprises a plurality of composite data 5 from a plurality of composite data sources 10, wherein the plurality of composite data 5 further comprises a plurality of structured data 12, a plurality of unstructured data 14, and a plurality of IoT signal data 16; an extract transform load module 100 in a memory 60 of the process device 40, extracting, transforming, and loading the plurality of composite data 5 from the plurality of composite data sources 10; a database 20 receiving the plurality of composite data 5 from extract transform load module 100 and storing the plurality of composite data 5 as the plurality of stored data 22 in a Composite Data Mater File table (FIGS. 5a and 5b), wherein the database 20 further comprises a layout details table 420, a layout definition table 410, and a composite data master file 430; a business logic module...


PUM


Abstract

A system for integrated performance measurement environment comprises a plurality of composite data from a plurality of composite data sources, wherein the plurality of composite data further comprises a plurality of structured data, a plurality of unstructured data, and a plurality of signal data; an extract transform load module; a database receiving the plurality of composite data from extract transform load module and storing the plurality of composite data as the plurality of stored data; a business logic module; at least one graphical user interface; a set of graphical presentations of a plurality of processed data comprising charts, graphs, reports, and tables, and a combination thereof on a computer device; and at least one network; and methods performing the same including extracting, transforming, and loading composite data into the system, retrieving data in accordance with rules in metrics catalog and business intelligence blocks, drilling down the metrics catalog and business intelligence blocks, and collaborating over the system and method thereof.

Description

CROSS-REFERENCE RELATED TO RELATED APPLICATIONS[0001]None.BACKGROUND[0002]For decades, senior business executives have been collecting and monitoring their metrics aka KPI (Key Performance Indicators) and making decisions using metrics. Until recently, all such metrics have been operational metrics, which give information about daily / weekly / monthly business performance—typically what has “happened in the past”. Operational metrics are computed using the plurality of composite data in structured format, having fixed columns, fixed width and well-defined data types (ex: CSV files, having comma separated values) collected from various source systems. Such source systems typically track transactions in sales, marketing, finance, supply chain, manufacturing, project management and quality etc., But in the past few years, the field of advanced analytics has emerged, which involves two distinctions from the operational metrics mentioned above. One, the source data may not always be in a st...

Claims


Application Information

Patent Timeline
Patent Type & Authority Patents(United States)
IPC IPC(8): G06F16/00G06F16/25G06F16/22G06N20/00
CPCG06F16/254G06F16/2282G06N20/00
Inventor SEKAR, CHANDRA
Owner OPENMETRIK INC
Learn More