System and method for phytomonitoring

a phytomonitoring and system technology, applied in the field of phytomonitoring system and method, can solve the problems of unavoidable crop loss, inability to accurately use information obtained from individual plants by such systems for predicting, and laborious and time-consuming visual inspection

Inactive Publication Date: 2002-11-21
PHYTECH
View PDF0 Cites 107 Cited by
  • Summary
  • Abstract
  • Description
  • Claims
  • Application Information

AI Technical Summary

Problems solved by technology

Although theoretically, the use of automated phytomonitoring systems can increase phytomonitoring accuracy, the information obtained from individual plants by such systems cannot be accurately used for predicting the state of an entire crop since parameter values which are obtained from a single plant or it's environment are not always indicative of the state of an entire crop.
Such visual inspection is a tedious and time consuming task which is oftentimes performed after a crop is severely under-hydrated or diseased to a point leading to unavoidable crop loss.
In general, there are guidelines commonly used by growers for crop cultivation, however, they are too broad and can not include sufficient specifications regarding native factors such as local climate fluctuations, soil or substrate types, distinct characteristic of fertilizers, pollutants, phenotypic variation of plants, infectious and non-infectious disorders in plants and the like.
This approach, however, was not successful due to the difficulty in coordinating short and long-term responses of plants.
Moreover, several outstanding experts believe that it is practically impossible to develop sensors that can be used to directly evaluate crop performance (Challa H. and J. C. Bakker, 1995.
In addition, since such data is presented to the grower as absolute numerical data it can oftentimes be difficult to perceive and analyze.
Although the methodology of the present invention can be applied to a large number of plants of a single crop, such application is not preferred, since it requires the monitoring of a plurality of plants, which monitoring can be both time consuming and expensive to implement.
Individual control regimes cannot ensue from individual characteristics of plants, even if they are available.

Method used


Image

  • System and method for phytomonitoring
  • System and method for phytomonitoring
  • System and method for phytomonitoring

Examples


example 1

[0117] Plant Phytomonitoring

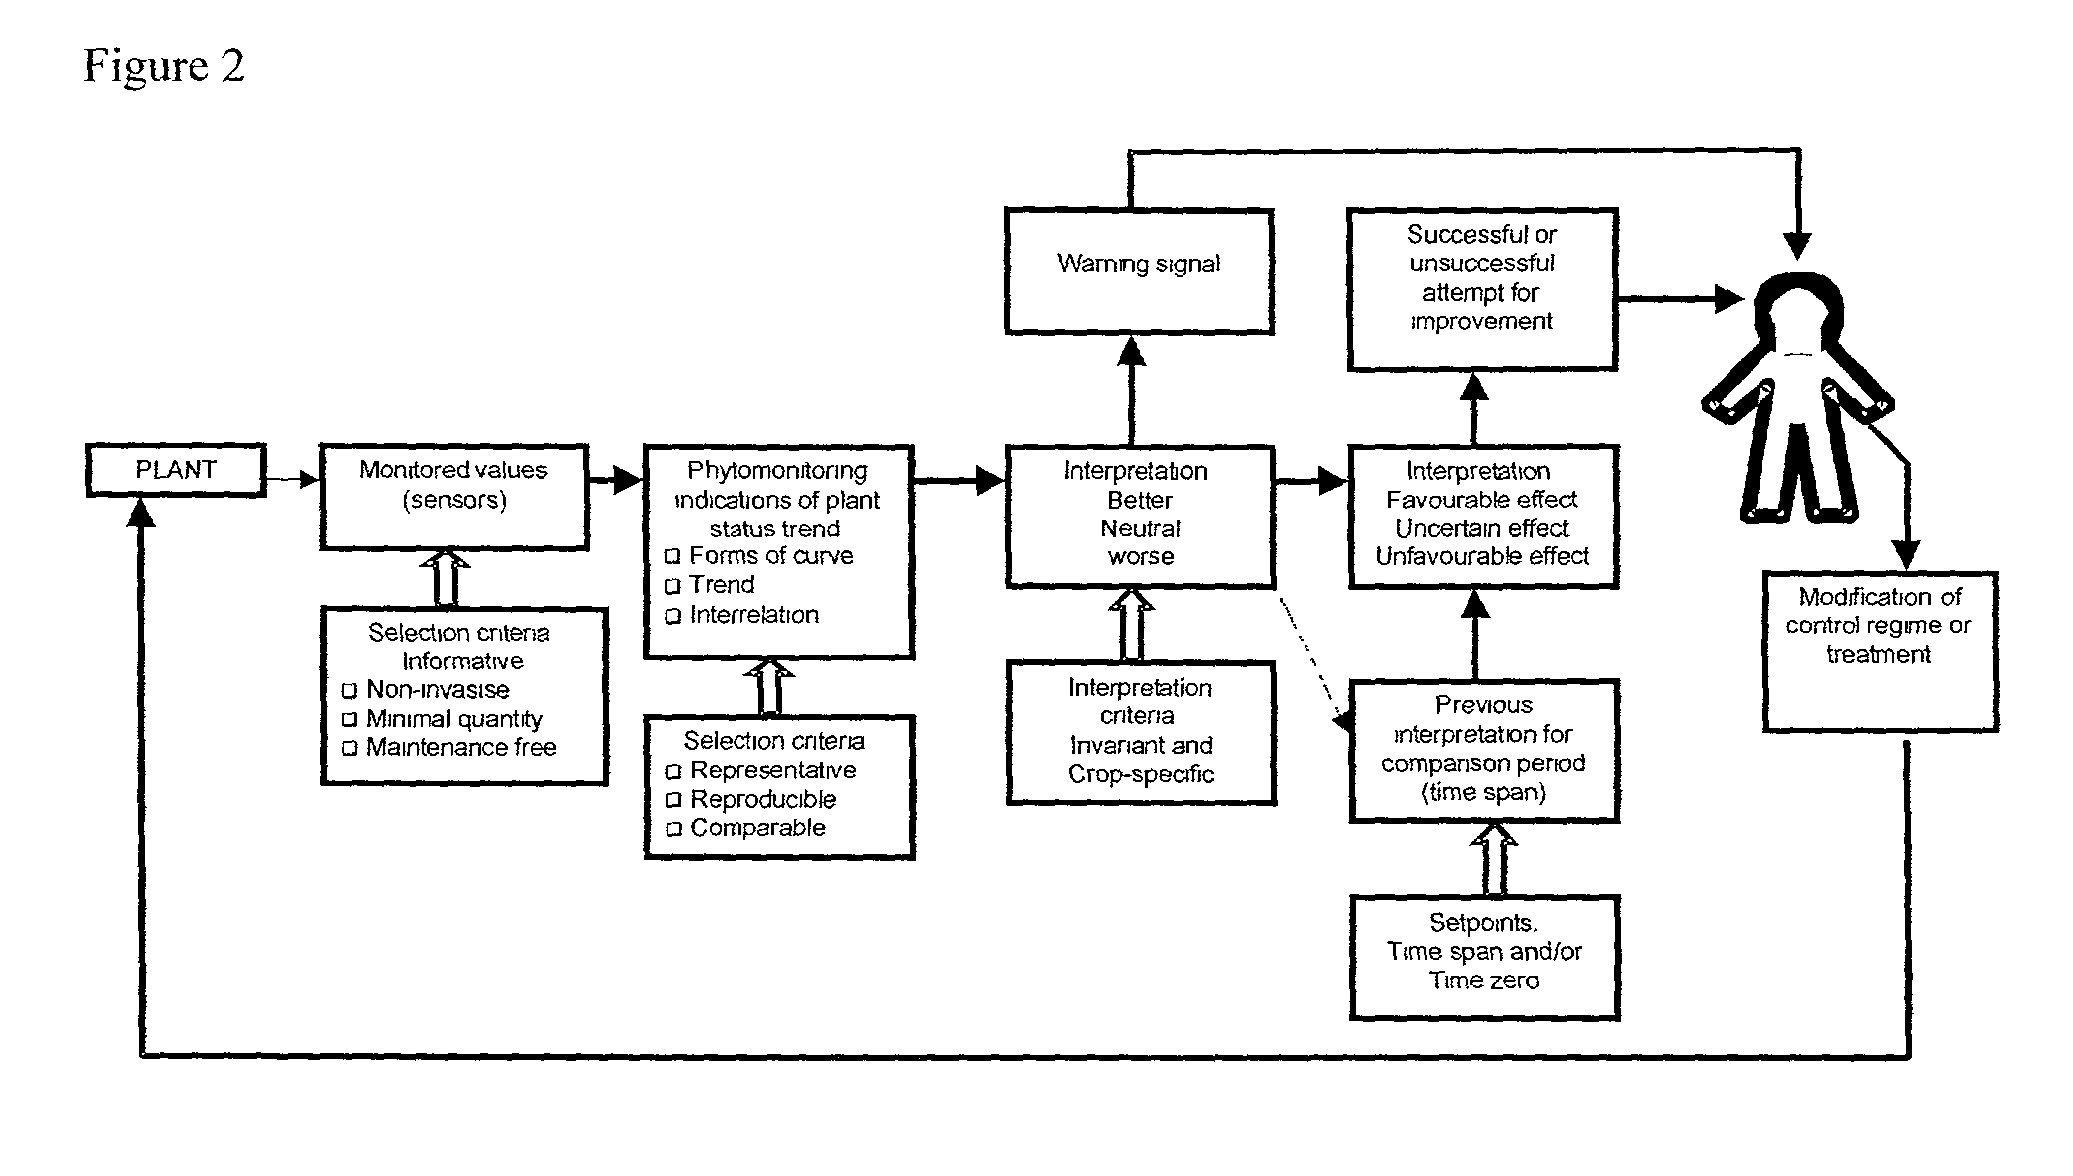
[0118] The phytomonitoring method of the present invention is effected by recognizing trend(s) in data collected from a plant and it's environment over a period of time.

[0119] As shown in FIG. 2, such a trend or trends can be graphically presented and used either individually or in combination to assess the plant condition in terms of "better", "worse" or "no change" (neutral) along a growth period of the plant.

[0120] Thus, the present invention allows to express plant and crop performance in relative, qualitative values, rather than absolute values which may not be available or which are difficult to interpret and / or correlate to an actual plant state and which, when collected from a representative plant or plants cannot be accurately utilized to asses the state of a crop.

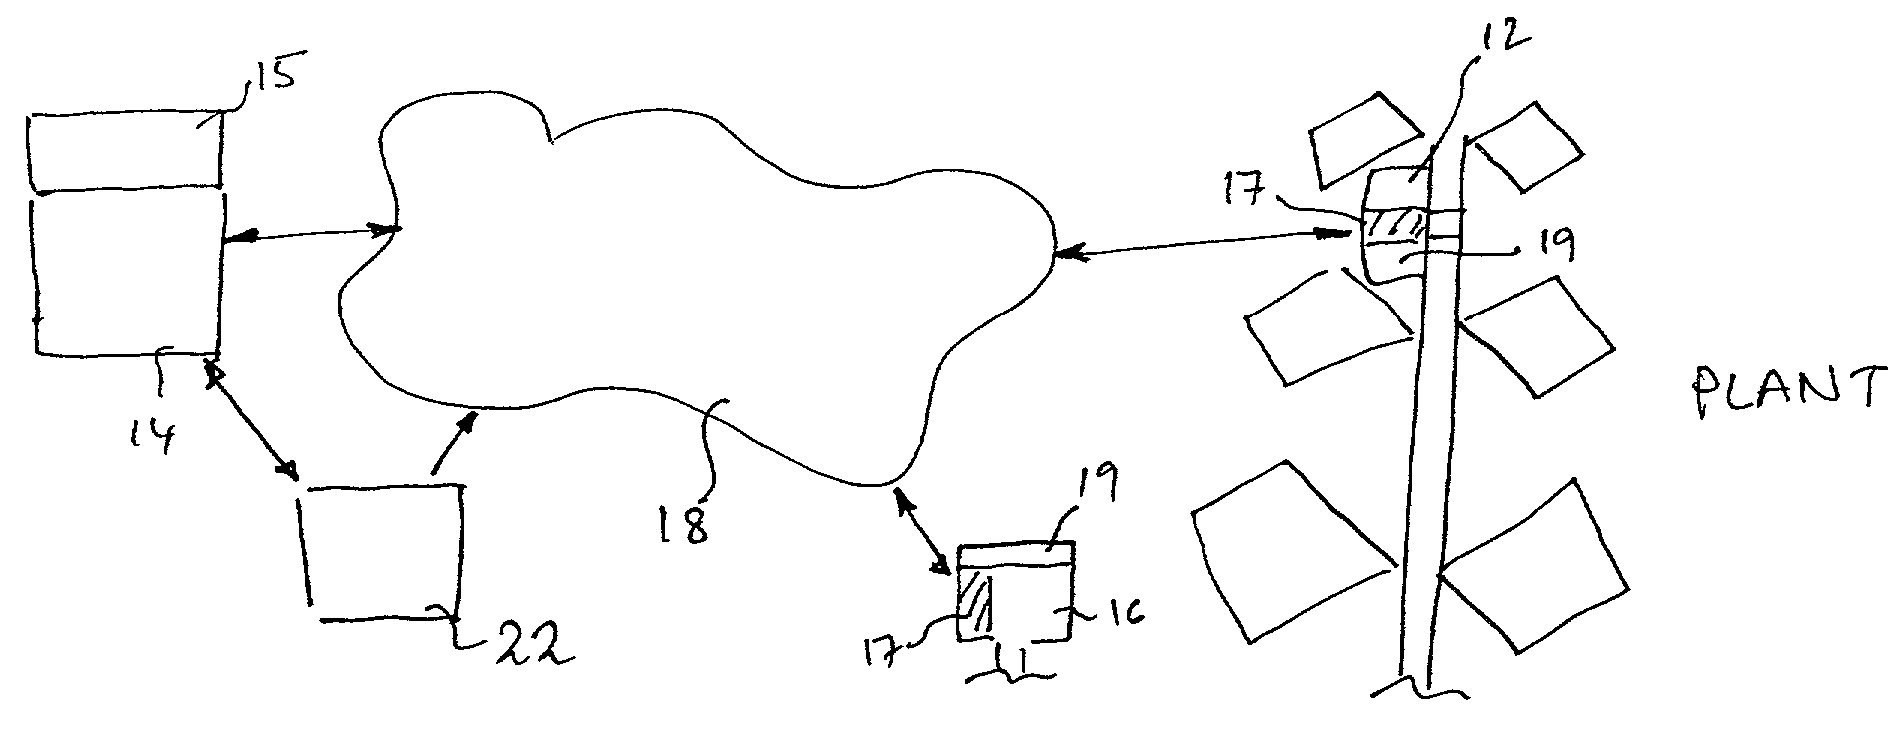
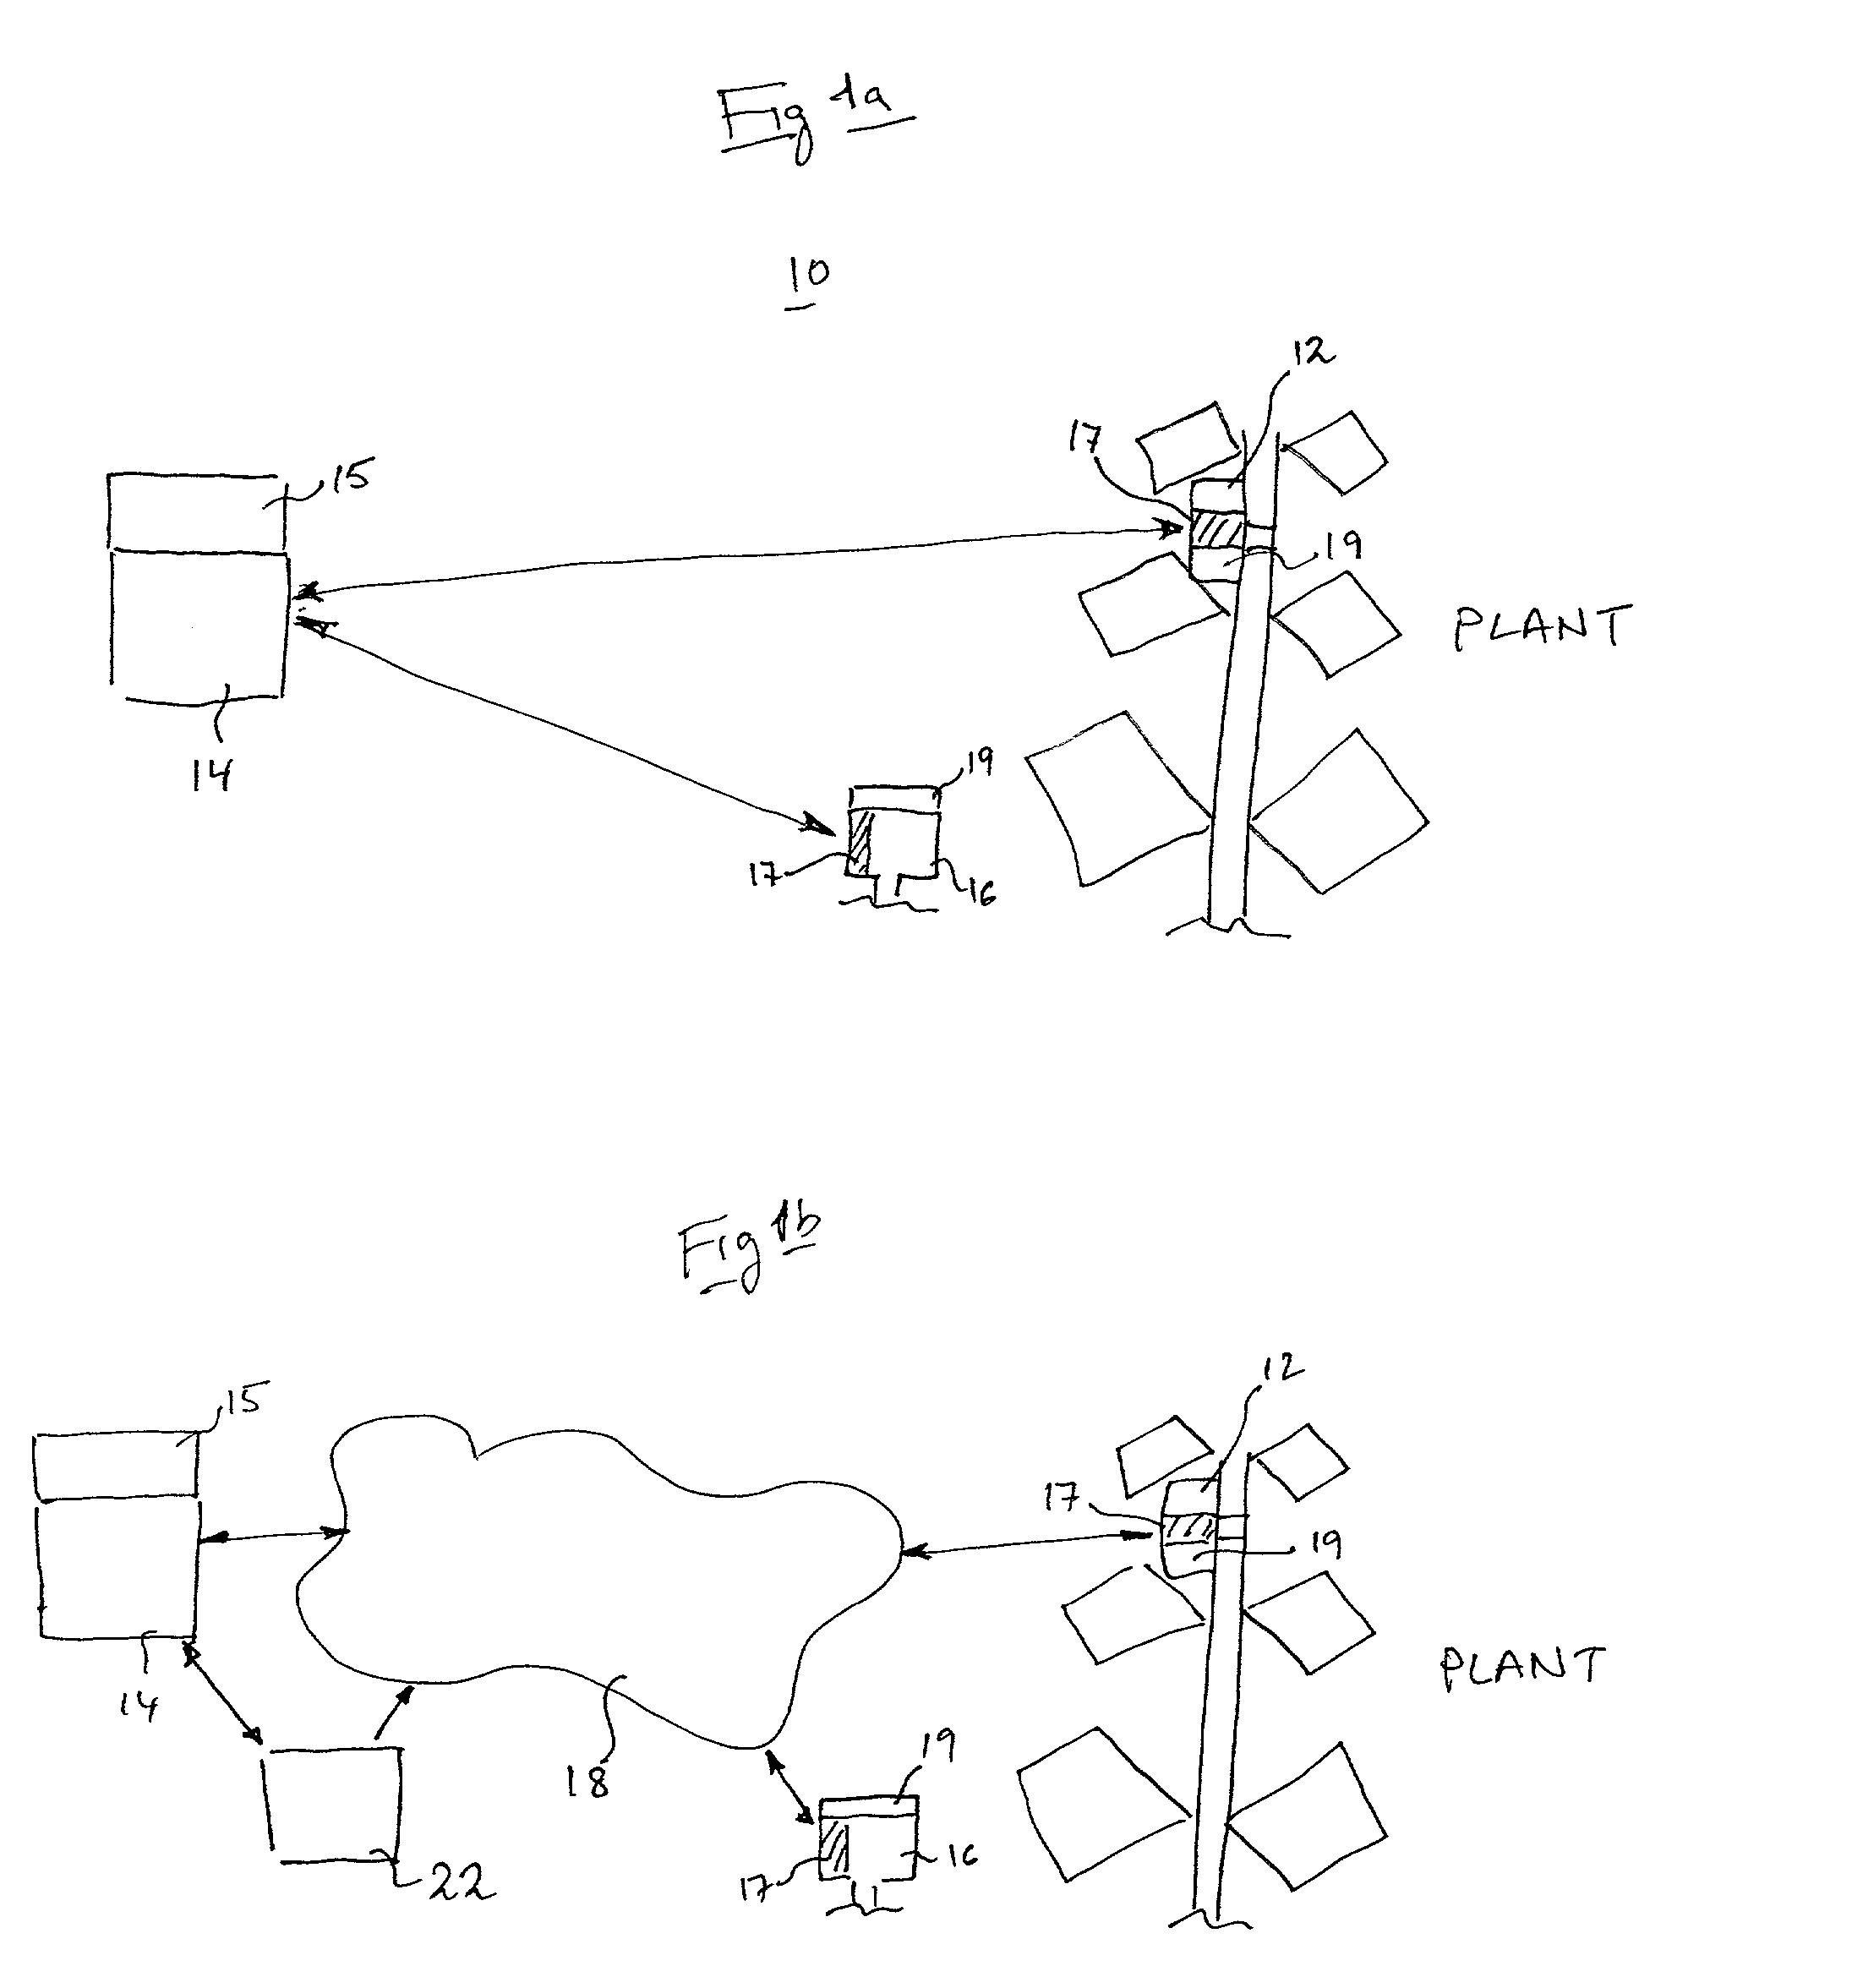
[0121] As shown in FIG. 3, data is collected by a set of sensors positioned on a plant and in the environment thereof. The sensors used are selected such that the plant and environmenta...

example 2

Plant and Environmental Sensor Positioning

[0127] The sensors utilized by the present invention are positioned according to the following considerations:

[0128] Plant sensors:

[0129] (i) All of the sensors used are placed on various components of a single plant stem and their power and communications cables are attached to the shoot by an adhesive tape . . .

[0130] (ii) The leaf temperature sensor (e.g., LT-1, Phytech Ltd.) is placed on sunlit fully expanded leaf forming a part of the canopy top.

[0131] (iii) The sap flow rate sensor (e.g., SF-4, Phytech Ltd.) is placed at the leaf petiole in a position such that the total leaf area above the sensor is less than 50 cm.sup.2.

[0132] (iv) The stem diameter sensor (e.g., SD-5, Phytech Ltd.) is placed upon the lowest internode of the main stem.

[0133] Environmental sensors:

[0134] (i) The solar radiation sensor (e.g., TIR-4, Phytech Ltd.) is placed over the top of the leaf canopy.

[0135] (ii) The combined air temperature and humidity sensor (e.g...

example 3

Collection and Analysis of Sensor Data

[0137] Data pertaining to daily stem variations of a tomato plant was collected over a period of 3 days (FIG. 5).

[0138] Stem diameter change is caused by turgidity variations, which are influenced by water balance and osmotic regulation. As shown in FIG. 5, daily changes in stem diameter were observed over the measured time period, which resulted in a net increase in stem diameter. A daily stem diameter maximum is usually measured at predawn value; a daily change in stem diameter is calculated according to a subtraction of two sequential maximums.

[0139] FIG. 6 represents a stem diameter line graph generated from data collected from a tomato plant over a period of 2 days. Variations between maximums of the graph represent positive, neutral or negative trends in stem diameter changes.

[0140] Such trends are indicative of a plant state and can serve as objective assessment of crop disorders; this enables a grower to undertake certain cultivation ste...


PUM


Abstract

A method of assessing a state of a plant is provided. The method includes: (a) collecting data pertaining to at least one plant related parameter over a predetermined time period; and (b) analyzing the data collected over the predetermined time period to thereby identify a trend in the data over at least a portion of the predetermined time period, the trend being indicative of the state of the plant.

Description

FIELD AND BACKGROUND OF THE INVENTION[0001] The present invention relates to a system and method useful for phytomonitoring and, more particularly, to a system which enables a grower to monitor, assess and optionally control crop growth, either on-site or from a remote location.[0002] Cultivation of commercial crops depends on the monitoring of various parameters of a plant, a field or a greenhouse. Such parameters include, for example a degree of soil or substrate hydration, sun or light radiation, air temperature, humidity and the like. Monitoring of such parameters provides a grower with data with which a crop state can be assessed and corrected, if necessary, by altering climate conditions, irrigation or fertigation in a greenhouse, or by altering irrigation and fertigation in the field.[0003] In the past, growers have relied primarily on intuition and expertise in the assessment of crop related parameters and thus of a crop's condition. This expertise was based mainly on crop a...

Claims


Application Information

Patent Timeline
Patent Type & Authority Applications(United States)
IPC IPC(8): A01G1/00A01G7/00
CPCA01G7/00A01G1/00
Inventor TON, YURIKOPYT, MICHAELNILOV, NIKOLAI
Owner PHYTECH
Why Eureka
Try Eureka