System and method for automatically identifying sub-grids in a microarray

a gene expression and microarray technology, applied in the field of automatic identification of sub-grids in gene expression microarrays, can solve the problems of the transcriptional state of a large number of genes, and the inability to perform studies, etc., to achieve the effect of reducing the number of genes and reducing the number of errors

Inactive Publication Date: 2005-02-10
BIODISCOVERY INC
View PDF9 Cites 22 Cited by
  • Summary
  • Abstract
  • Description
  • Claims
  • Application Information

AI Technical Summary

Problems solved by technology

The ability to perform studies that determine the transcriptional state of a large number of genes has, however, until recently, been severely inhibited by limitations on the ability to survey cells for the presence and abundance of a large number of gene transcripts in a single experiment.
A primary limitation has been the small number of identified genes.
Another significant limitation has been the cumbersome nature of transcription analysis.
Even a large experiment on human cells can track expression of only a dozen genes, clearly an inadequate sampling to make any meaningful inferences about so complex a control system.
For this level of analysis, a visual inspection-based methodology is generally inadequate.
Moreover, advances in microarray technology have made using a visual inspection-based methodology even more impractical.
Thus, these systems produce massive amounts of information.
Using visual inspection to quantitate the expression levels, however, is far too cumbersome, time-consuming and imprecise to effectively analyze these data-rich slides.
Thus, along with the opportunities created by the rapid advancement in microarray generation technology, a management of information or “informatics” problem has arisen.
However, because of inherent limitations in the microarray generation hardware and process, the microarray images rarely, if ever, exhibit these conditions.
The result of these hardware imperfections is that the location of each grid in the microarray can vary from image to image and the spots will not be linearly aligned such that they are centered on grid-line intersections.
Furthermore, some spots will appear to be missing from a grid entirely because of gene expression levels that are too low to be measurable.
Such variations are again due to limitations in the spotting hardware and process.
Second, the concentrations of DNA and salt in the spotting solution vary over time.
During the spotting process, temperature nonuniformities across a slide or between slides, and accidental scrapes by pins during the spotting process can alter the results.
Another issue that causes a microarray image to deviate from ideal conditions is contamination of the slide surface.
Another potential source of contamination is from accidental splashes and drips of DNA solution from the spotting pins.
Because of these issues, previous image processing techniques for automatically processing and analyzing microarray images have been impractical.
This method, however, was prohibitively time-consuming and labor intensive for microarray images, particularly where precise grid alignment was needed before proceeding to a measurement phase for the spot signal.
The obvious problem with this method is that human involvement is still required, making analyzing large microarrays prohibitively expensive.
However, because of the high potential for microarray contamination and spot shape and location irregularity, the space-based signal segmentation method is inadequate.
Pure intensity-based signal segmentation methods have also been ineffective at obtaining accurate signal measurements for the gene expression spots.
While being simple and fast computing, these methods have significant disadvantages.
First, gene expression levels that are low will likely not be adequately characterized because the signal and background pixels cannot be separated based on intensity alone.
Also, microarray images with contamination or noise are easily mischaracterized because the signal and background are not easily separated based on pixel intensity because both exhibit strong signals.
A problem with the method occurs when contamination is observed inside the circle whereby contamination pixels are probably classified as signal pixels.
The method also performs poorly on spots having weak signals and on microarray images that are noisy.
This overlapping of intensity distributions inherently limits the performance of threshold-based segmentation.
A significant problem with this method, however, is the reliance on the precision of the location of the center of the circle and the determination of its radius.
Small errors in either may result in the loss of significant signal information regarding the spot.
Furthermore, the method incorrectly presumes that the spot is always circular.
When the spot not circular, the method again fails to identify significant signal information.

Method used


Image

  • System and method for automatically identifying sub-grids in a microarray
  • System and method for automatically identifying sub-grids in a microarray
  • System and method for automatically identifying sub-grids in a microarray

Examples


Embodiment Construction

[0050] The term “species” as used herein with respect to nucleic acids refers to a group of nucleic acid molecules, all of which comprise the same nucleotide sequence, allowing all to hybridize under stringent conditions to the same probe.

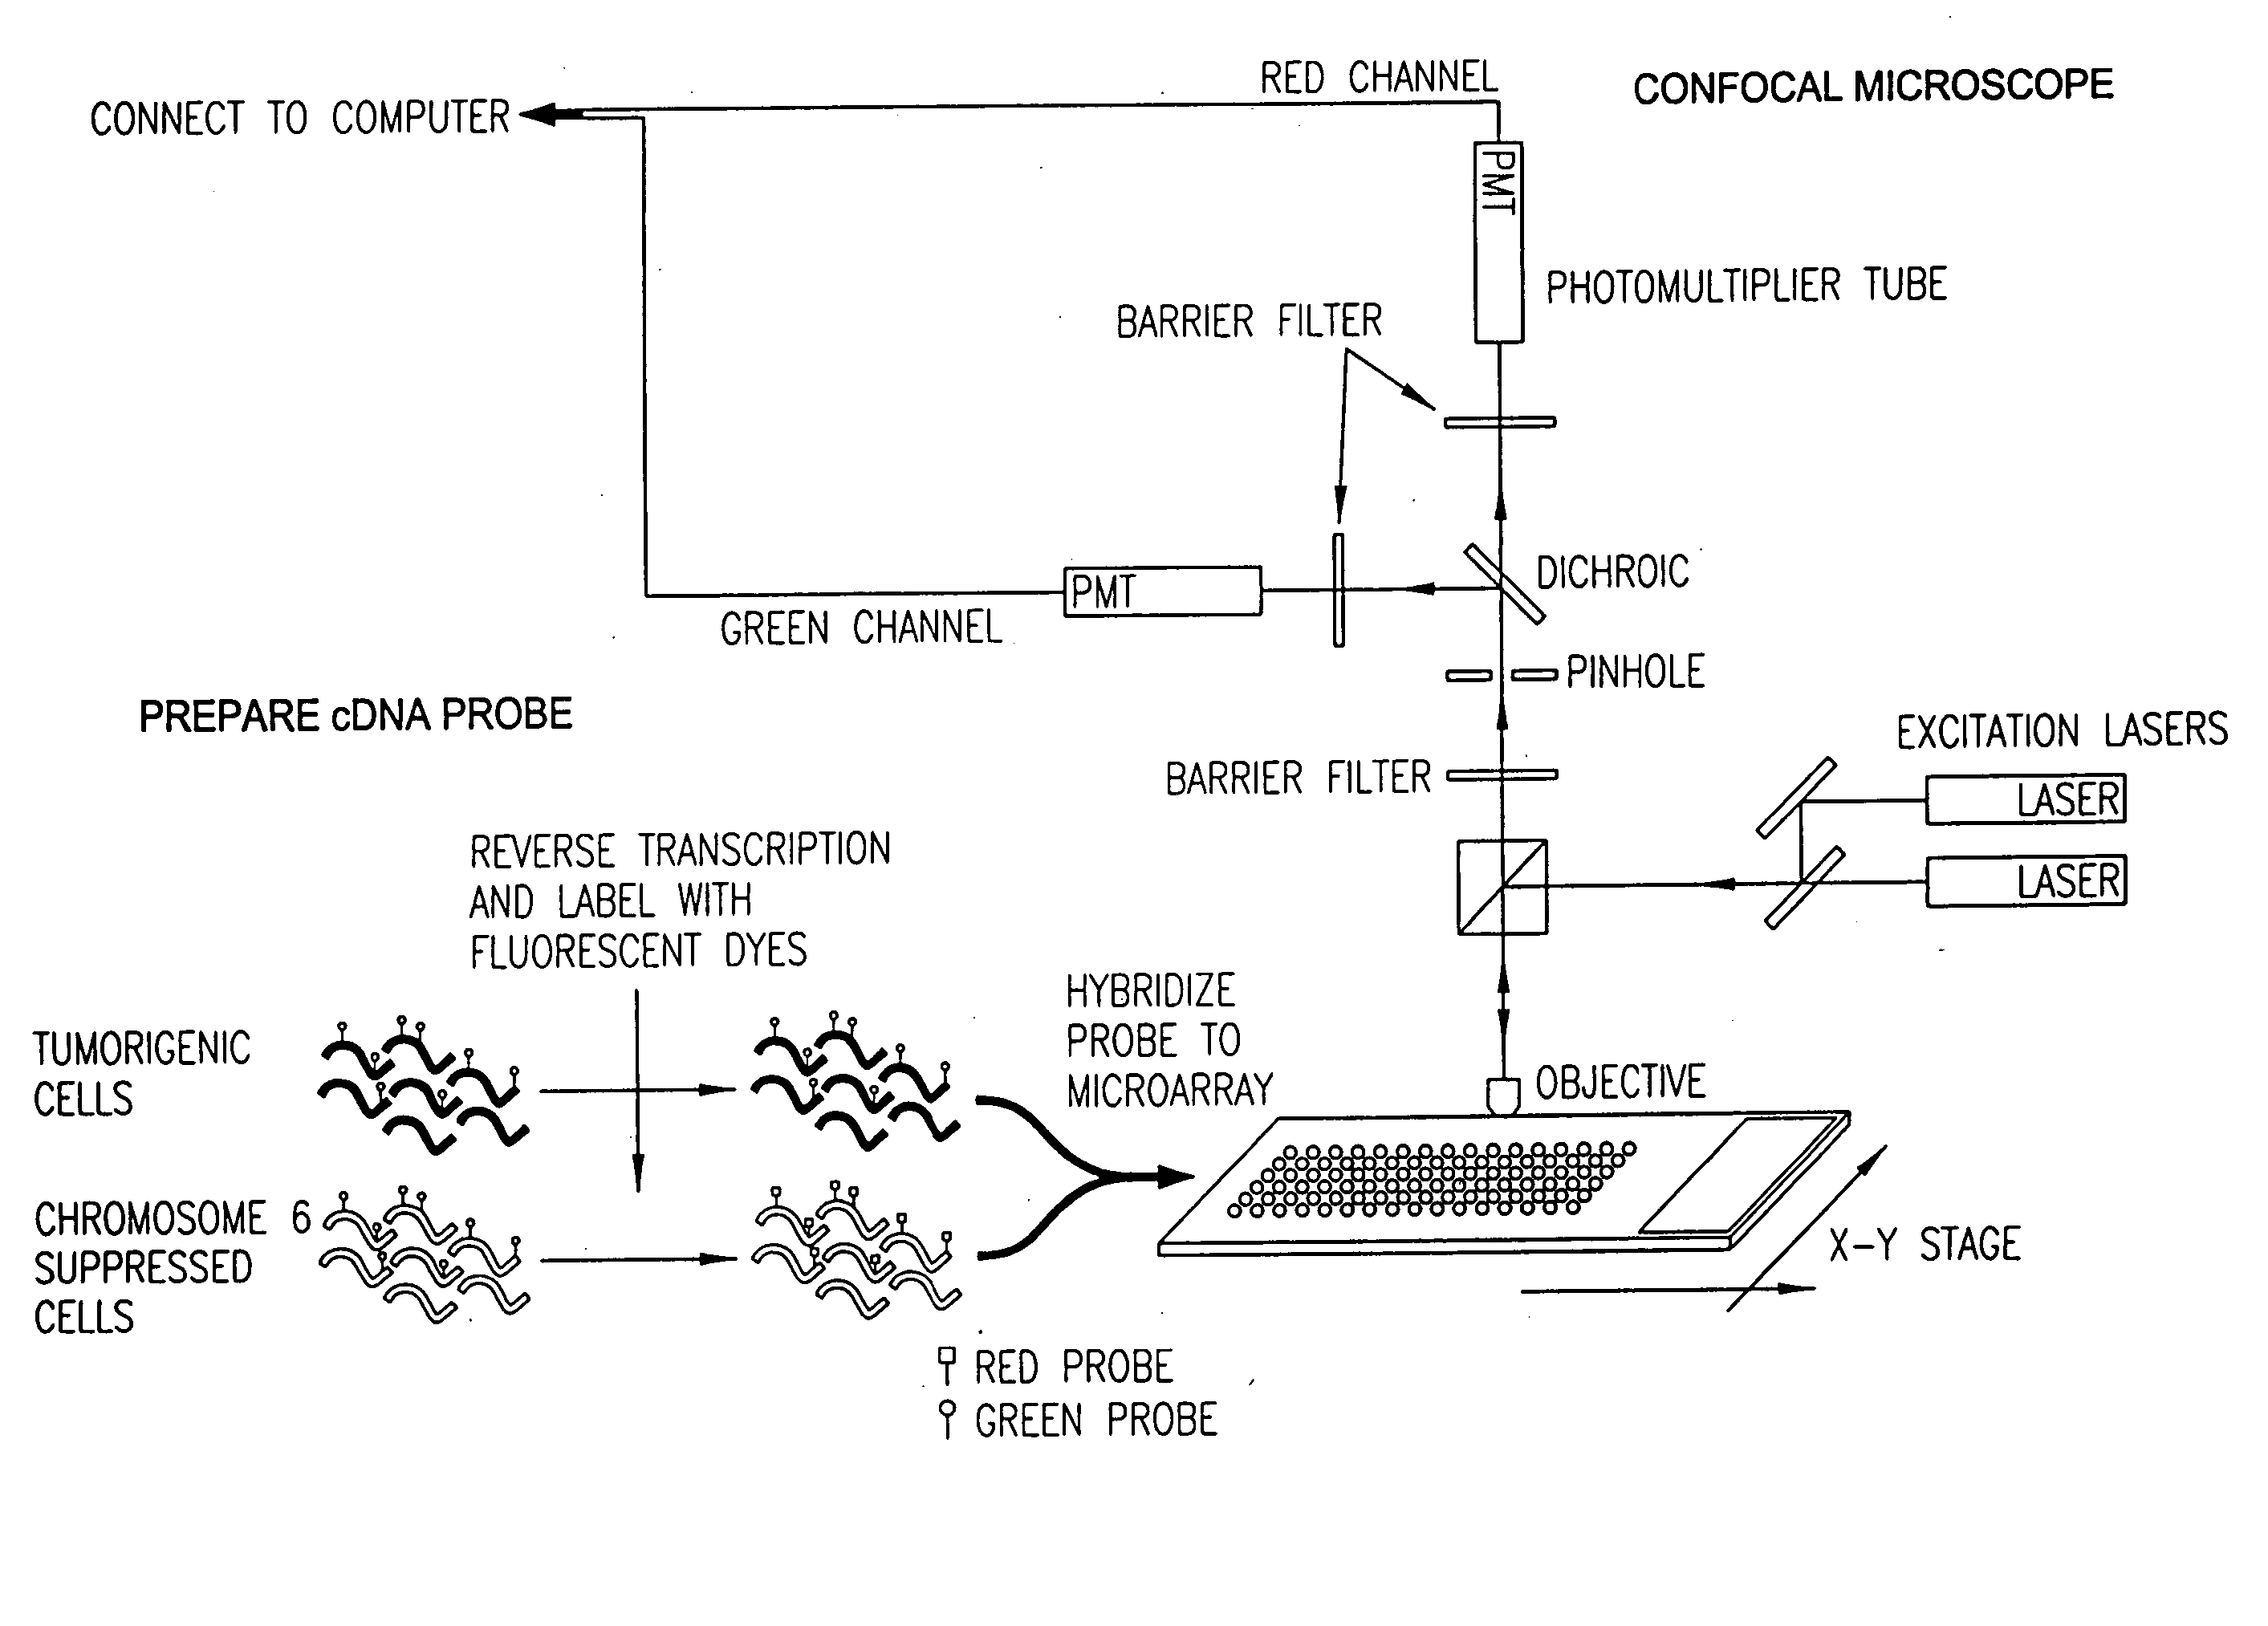
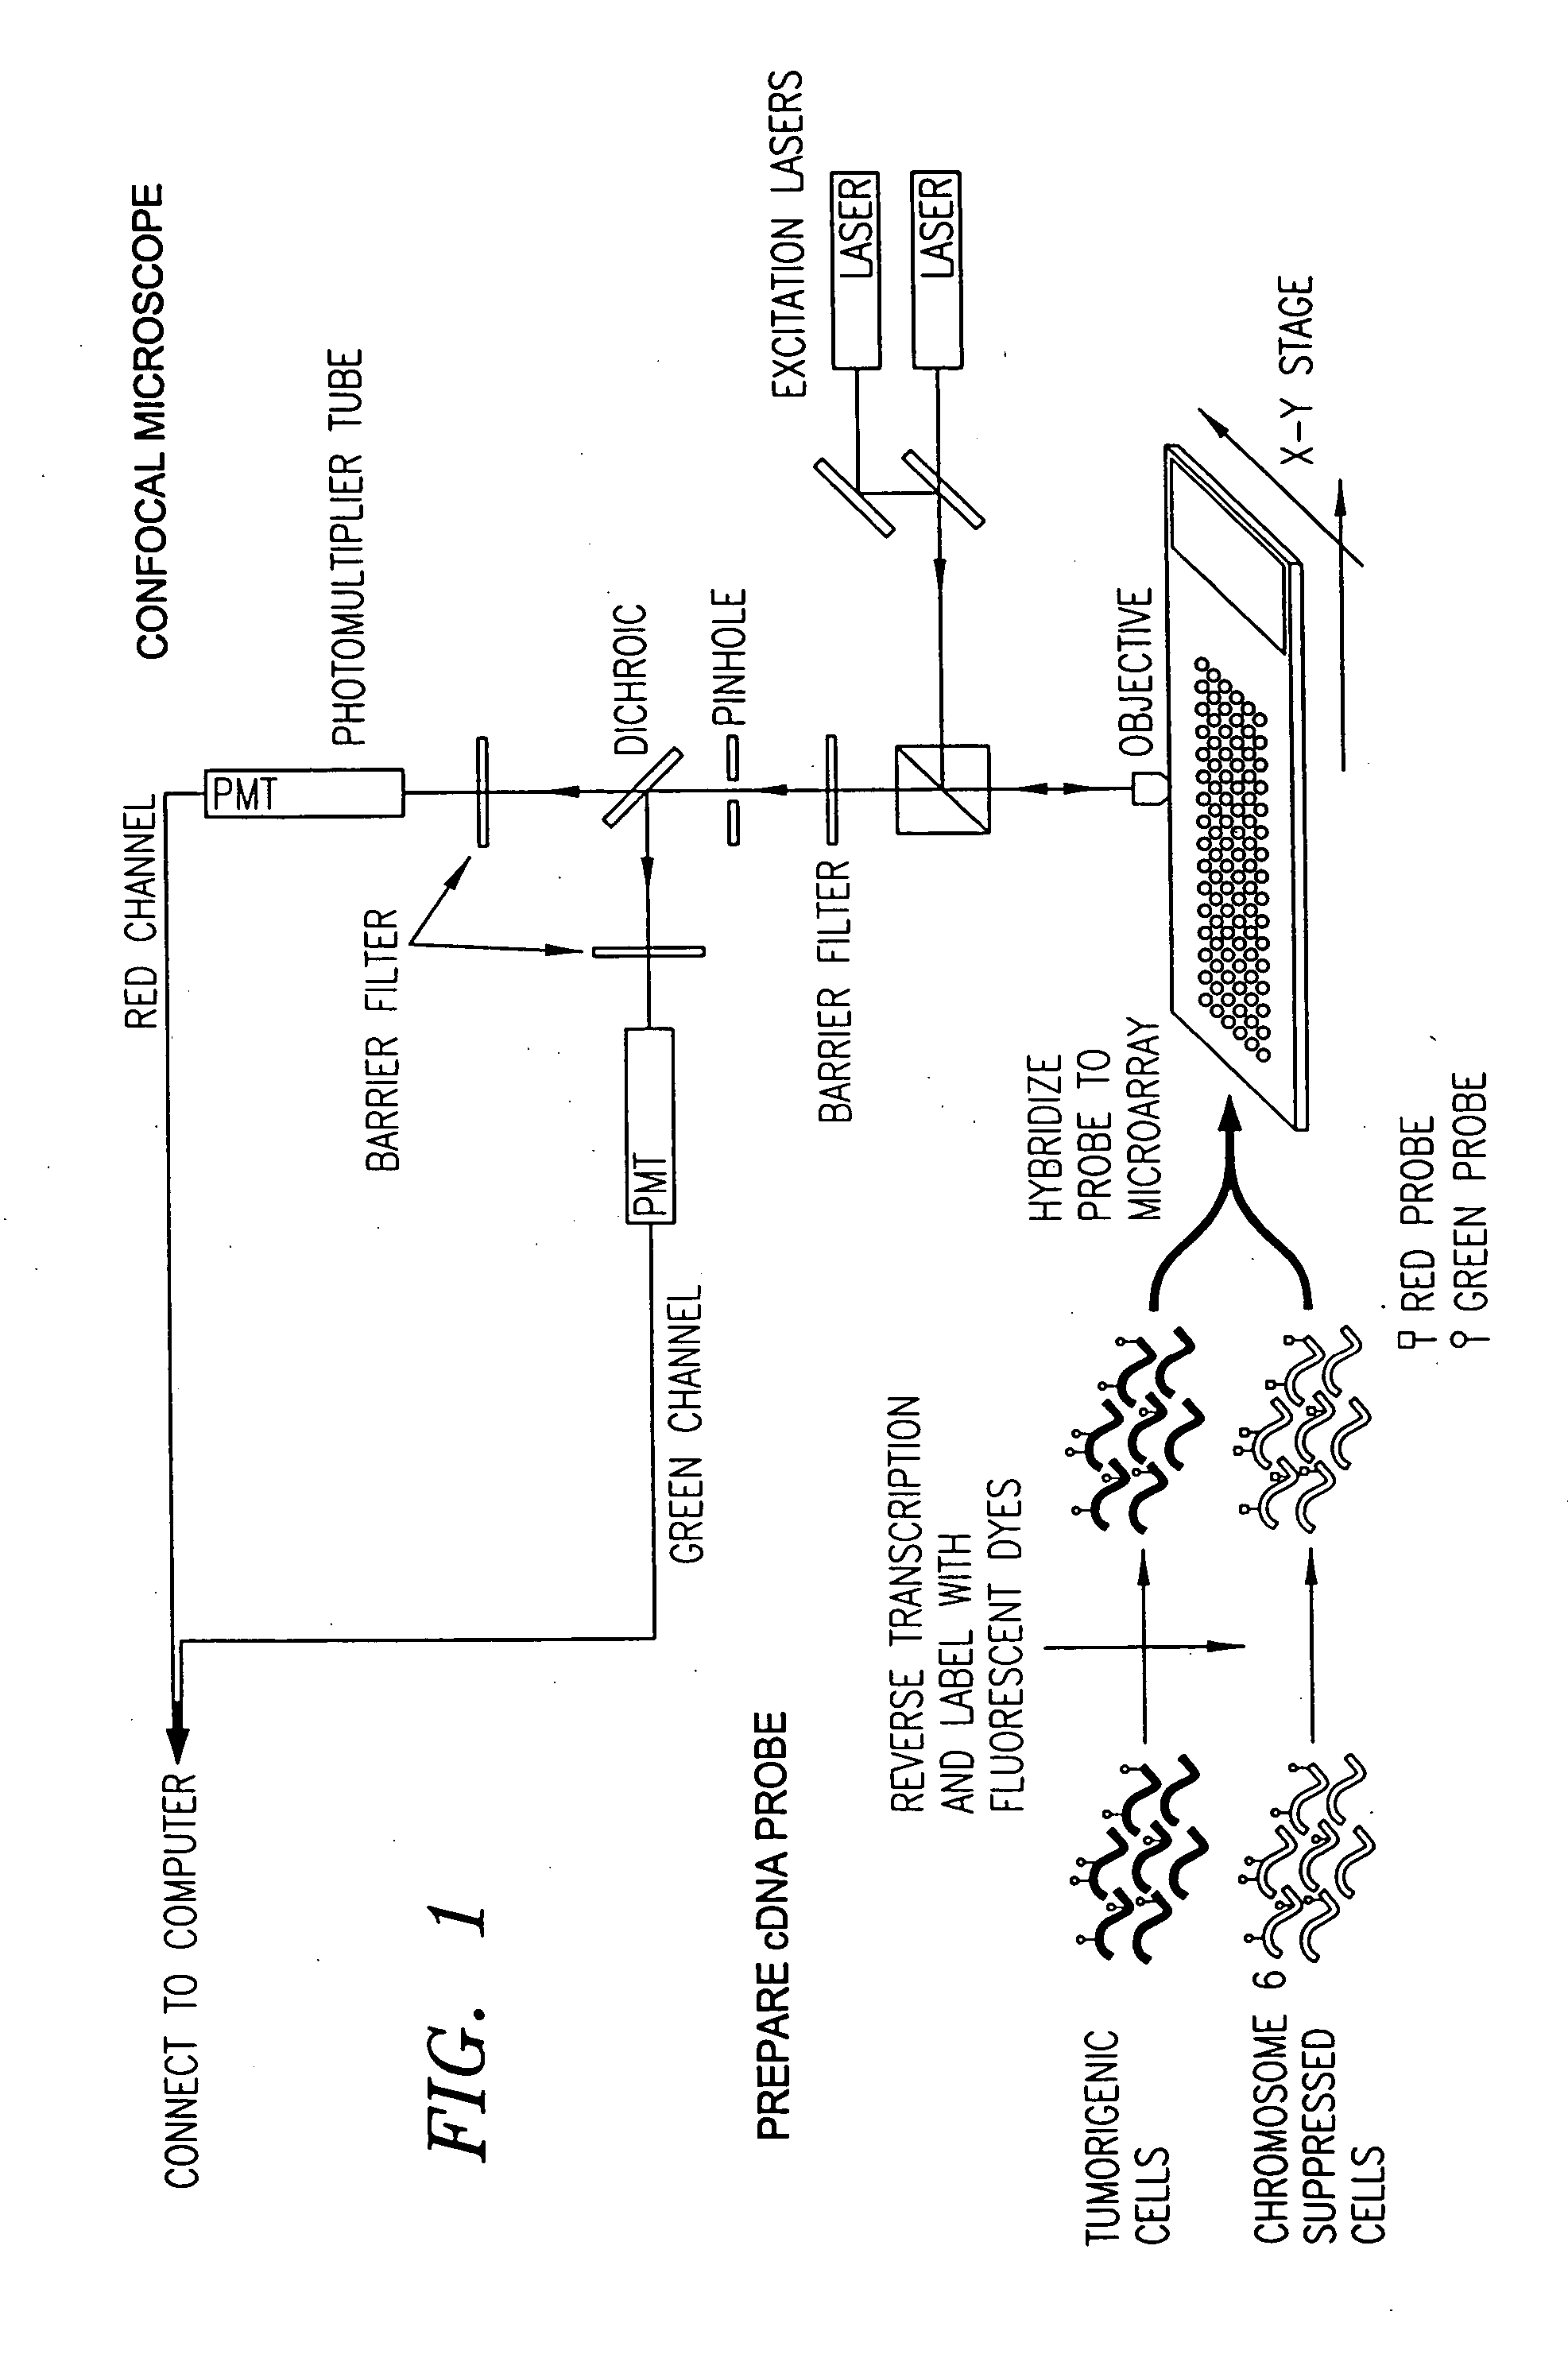
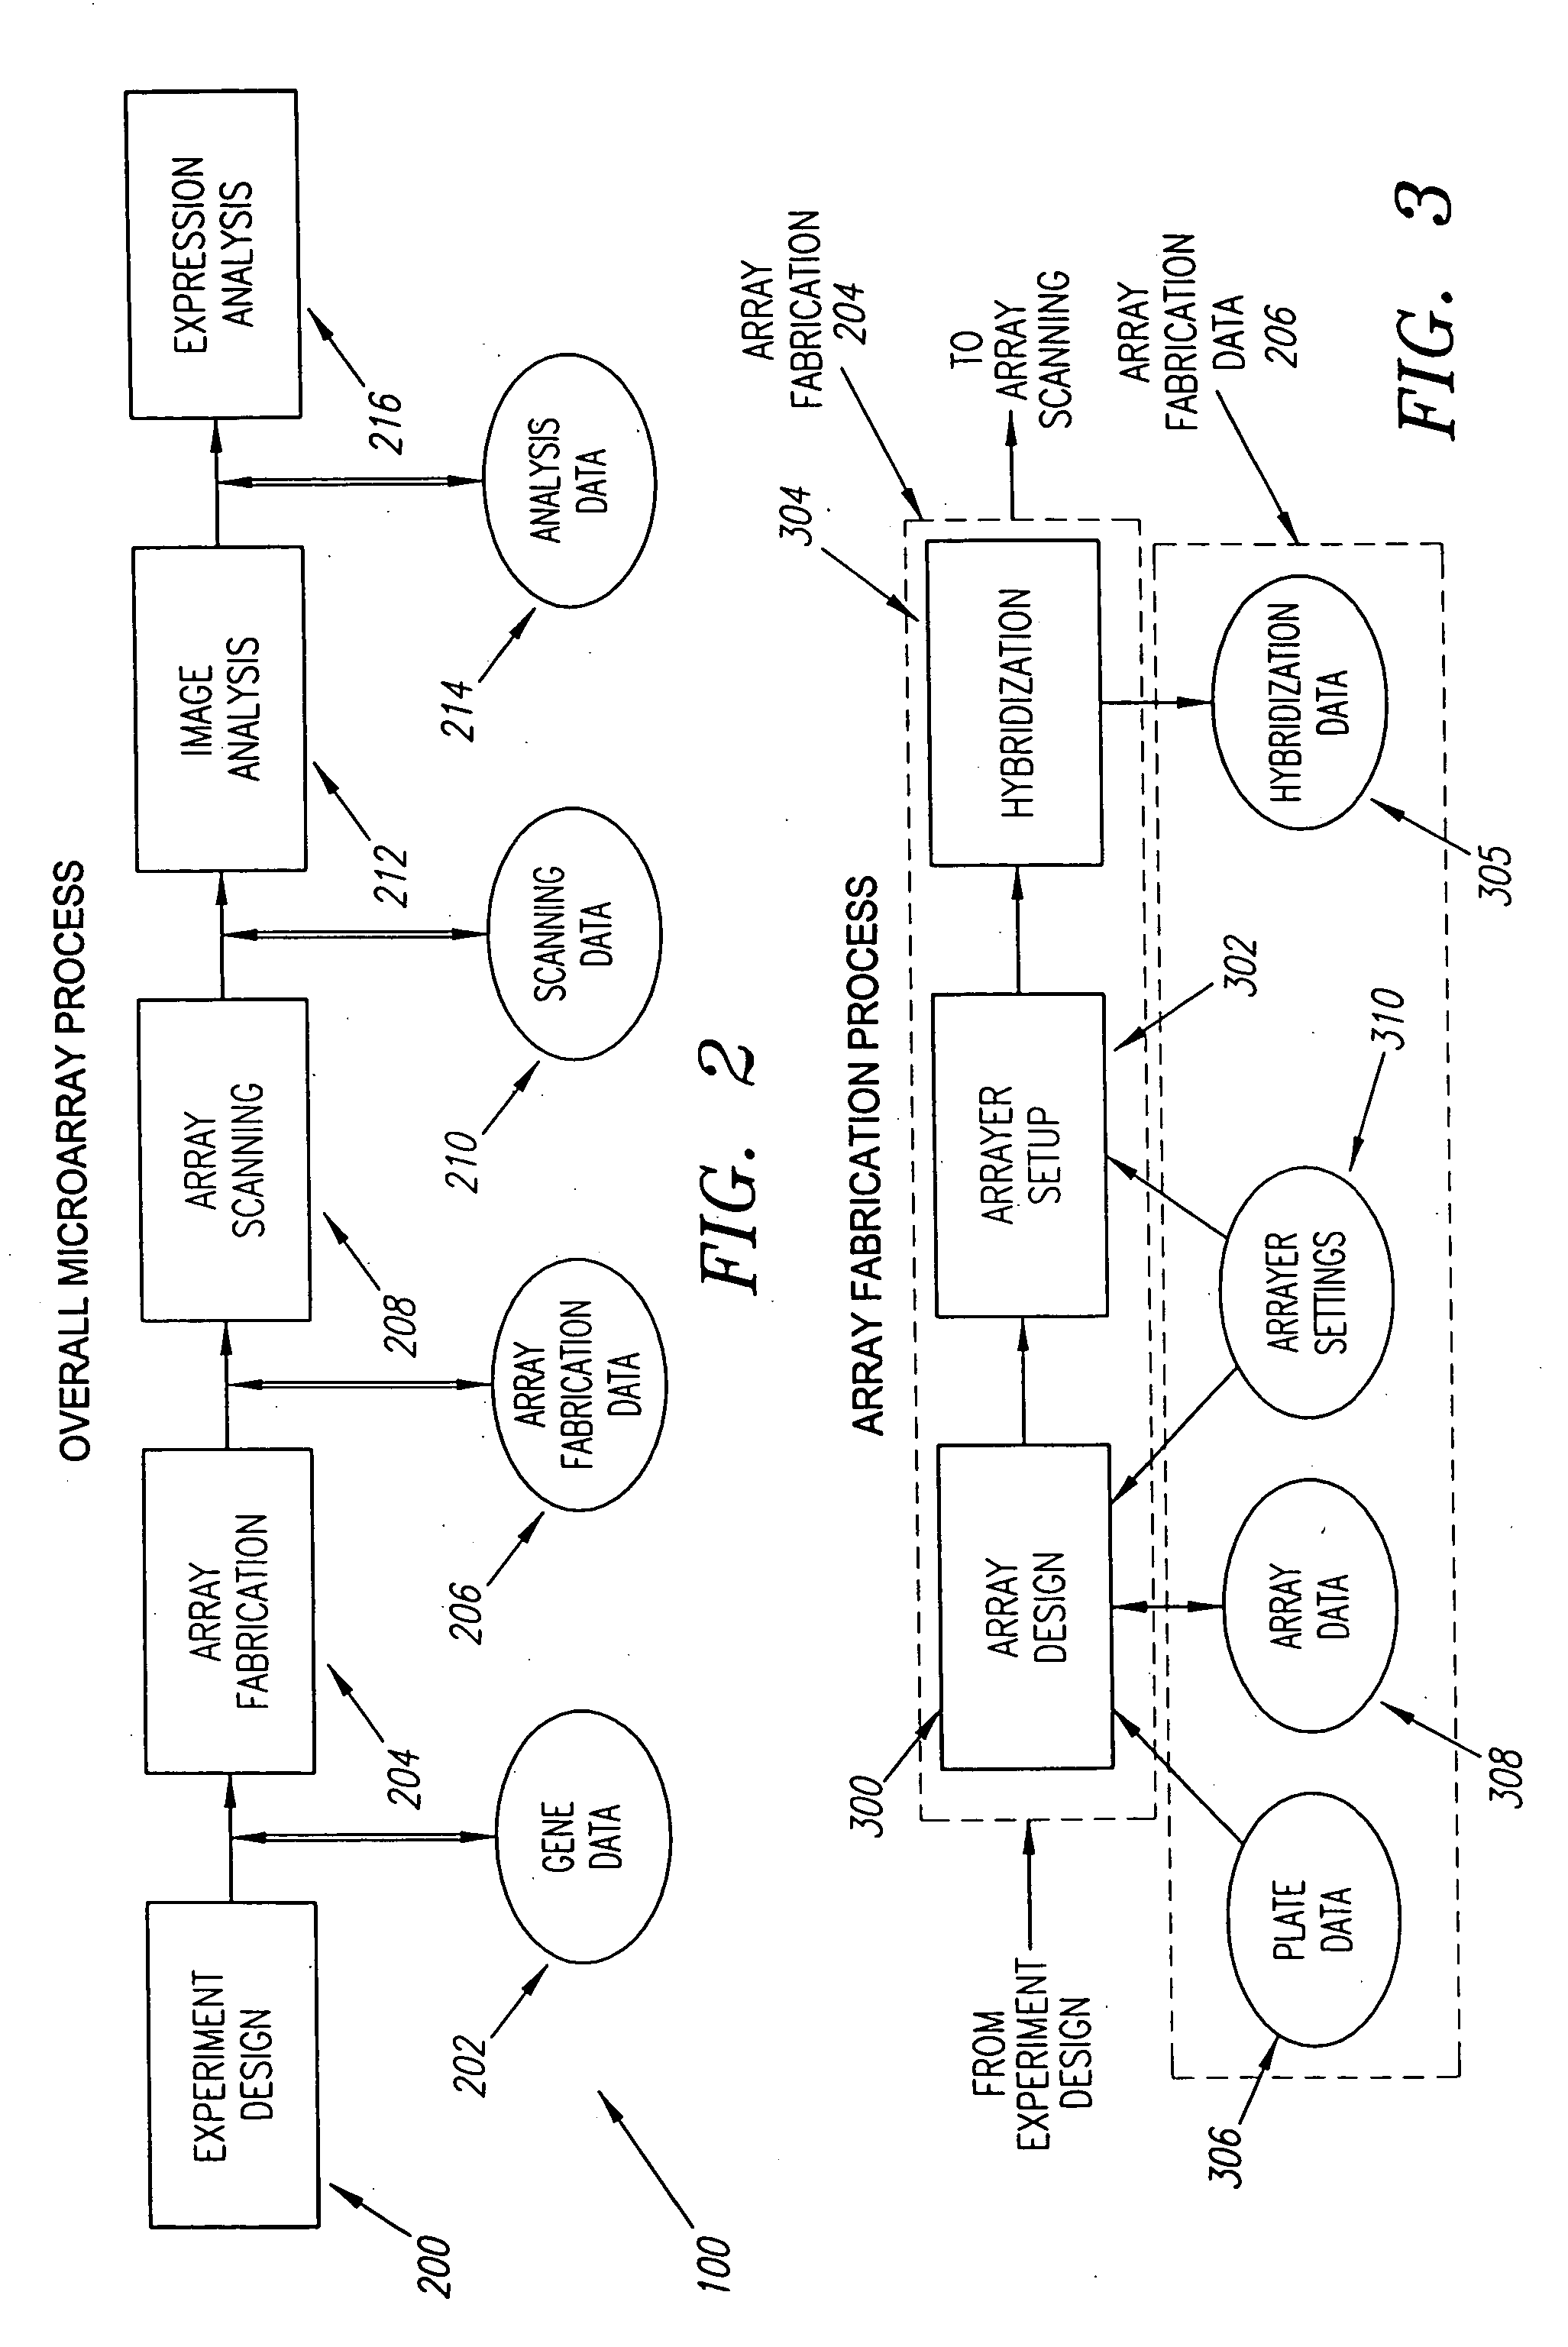
[0051]FIG. 2 depicts basic steps in the overall microarray process 100 according to a preferred embodiment, and the form of the data produced and carried forward during this process. The data is stored in a computerized database system that has memory sufficient to hold the data collected from each step in the microarray process 100, and has the capability of relating the data collected in each step with the other data collected throughout the process 100.

[0052] In the first step 200 of the microarray process 100, the gene expression experiment is designed. In this step 200, the genes to be tested are identified and recorded as data 202 for reference in any of the subsequent steps in the microarray process 100. Also, in this step 200, the basic d...


PUM

PropertyMeasurementUnit
chemical materialsaaaaaaaaaa
sizeaaaaaaaaaa
mode distanceaaaaaaaaaa

Abstract

A digital image processing-based system and method for quantitatively processing a plurality of nucleic acid species expressed in a microarray are disclosed. The microarray is a grid of a plurality of sub-grids of the nucleic acid species. The system includes a scanner that has a digital scanning sensor that scans the microarray and transmits from an output a digital image of the microarray, and a computer that receives the digital image of the microarray from the scanner and then processes the digital image, identifying each of the microarray's sub-grids. The computer identifies the position of each of the sub-grids by (a) identifying regions in the digital image that each contains one of the sub-grids, (b) identifying rows and columns in each region where nucleic acid species are expressed to form a set of candidate sub-grids in each region, (c) selecting for each region a probable sub-grid from the set of candidate sub-grids in each region, and (d) comparing the positions of the probable sub-grids from each region to finalize the sub-grid positions.

Description

[0001] This application claims priority to U.S. Provisional Application Ser. No. ______ filed Sep. 30, 1999 under attorney docket no. 244 / 043 and having the same title and inventorship as the present application.BACKGROUND OF THE INVENTION [0002] The field of the present invention relates to the image processing of gene expression microarrays. In particular, the invention relates to automatically identifying sub-grids in a gene expression microarray. [0003] A cell relies on proteins for a variety of its functions. Producing energy, biosynthesizing all component macromolecules, maintaining cellular architecture, and acting upon intra- and extracellular stimuli are all protein dependent activities. Almost every cell within an organism contains the information necessary to produce the entire repertoire of proteins that that organism can specify. This information is stored as genes within the organism's DNA genome. Different organisms have different numbers of genes to define them. The ...

Claims


Application Information

Patent Timeline
Patent Type & Authority Applications(United States)
IPC IPC(8): G06F19/00G06K9/00G06T7/00
CPCG06K9/00G06K2209/07G06T2207/30072G06T7/0044G06T7/0012G06T7/74G06V2201/04G06F18/00
Inventor PARK, JAMES DARRELL
Owner BIODISCOVERY INC
Why Eureka
Try Eureka