

Method for estimating or predicting the anti-tumor activity of a compound and for estimating or predicting the tumor growth in mammals
- Summary
- Abstract
- Description
- Claims
- Application Information
AI Technical Summary
Benefits of technology
Problems solved by technology
Method used
Image

Examples
experiment-c
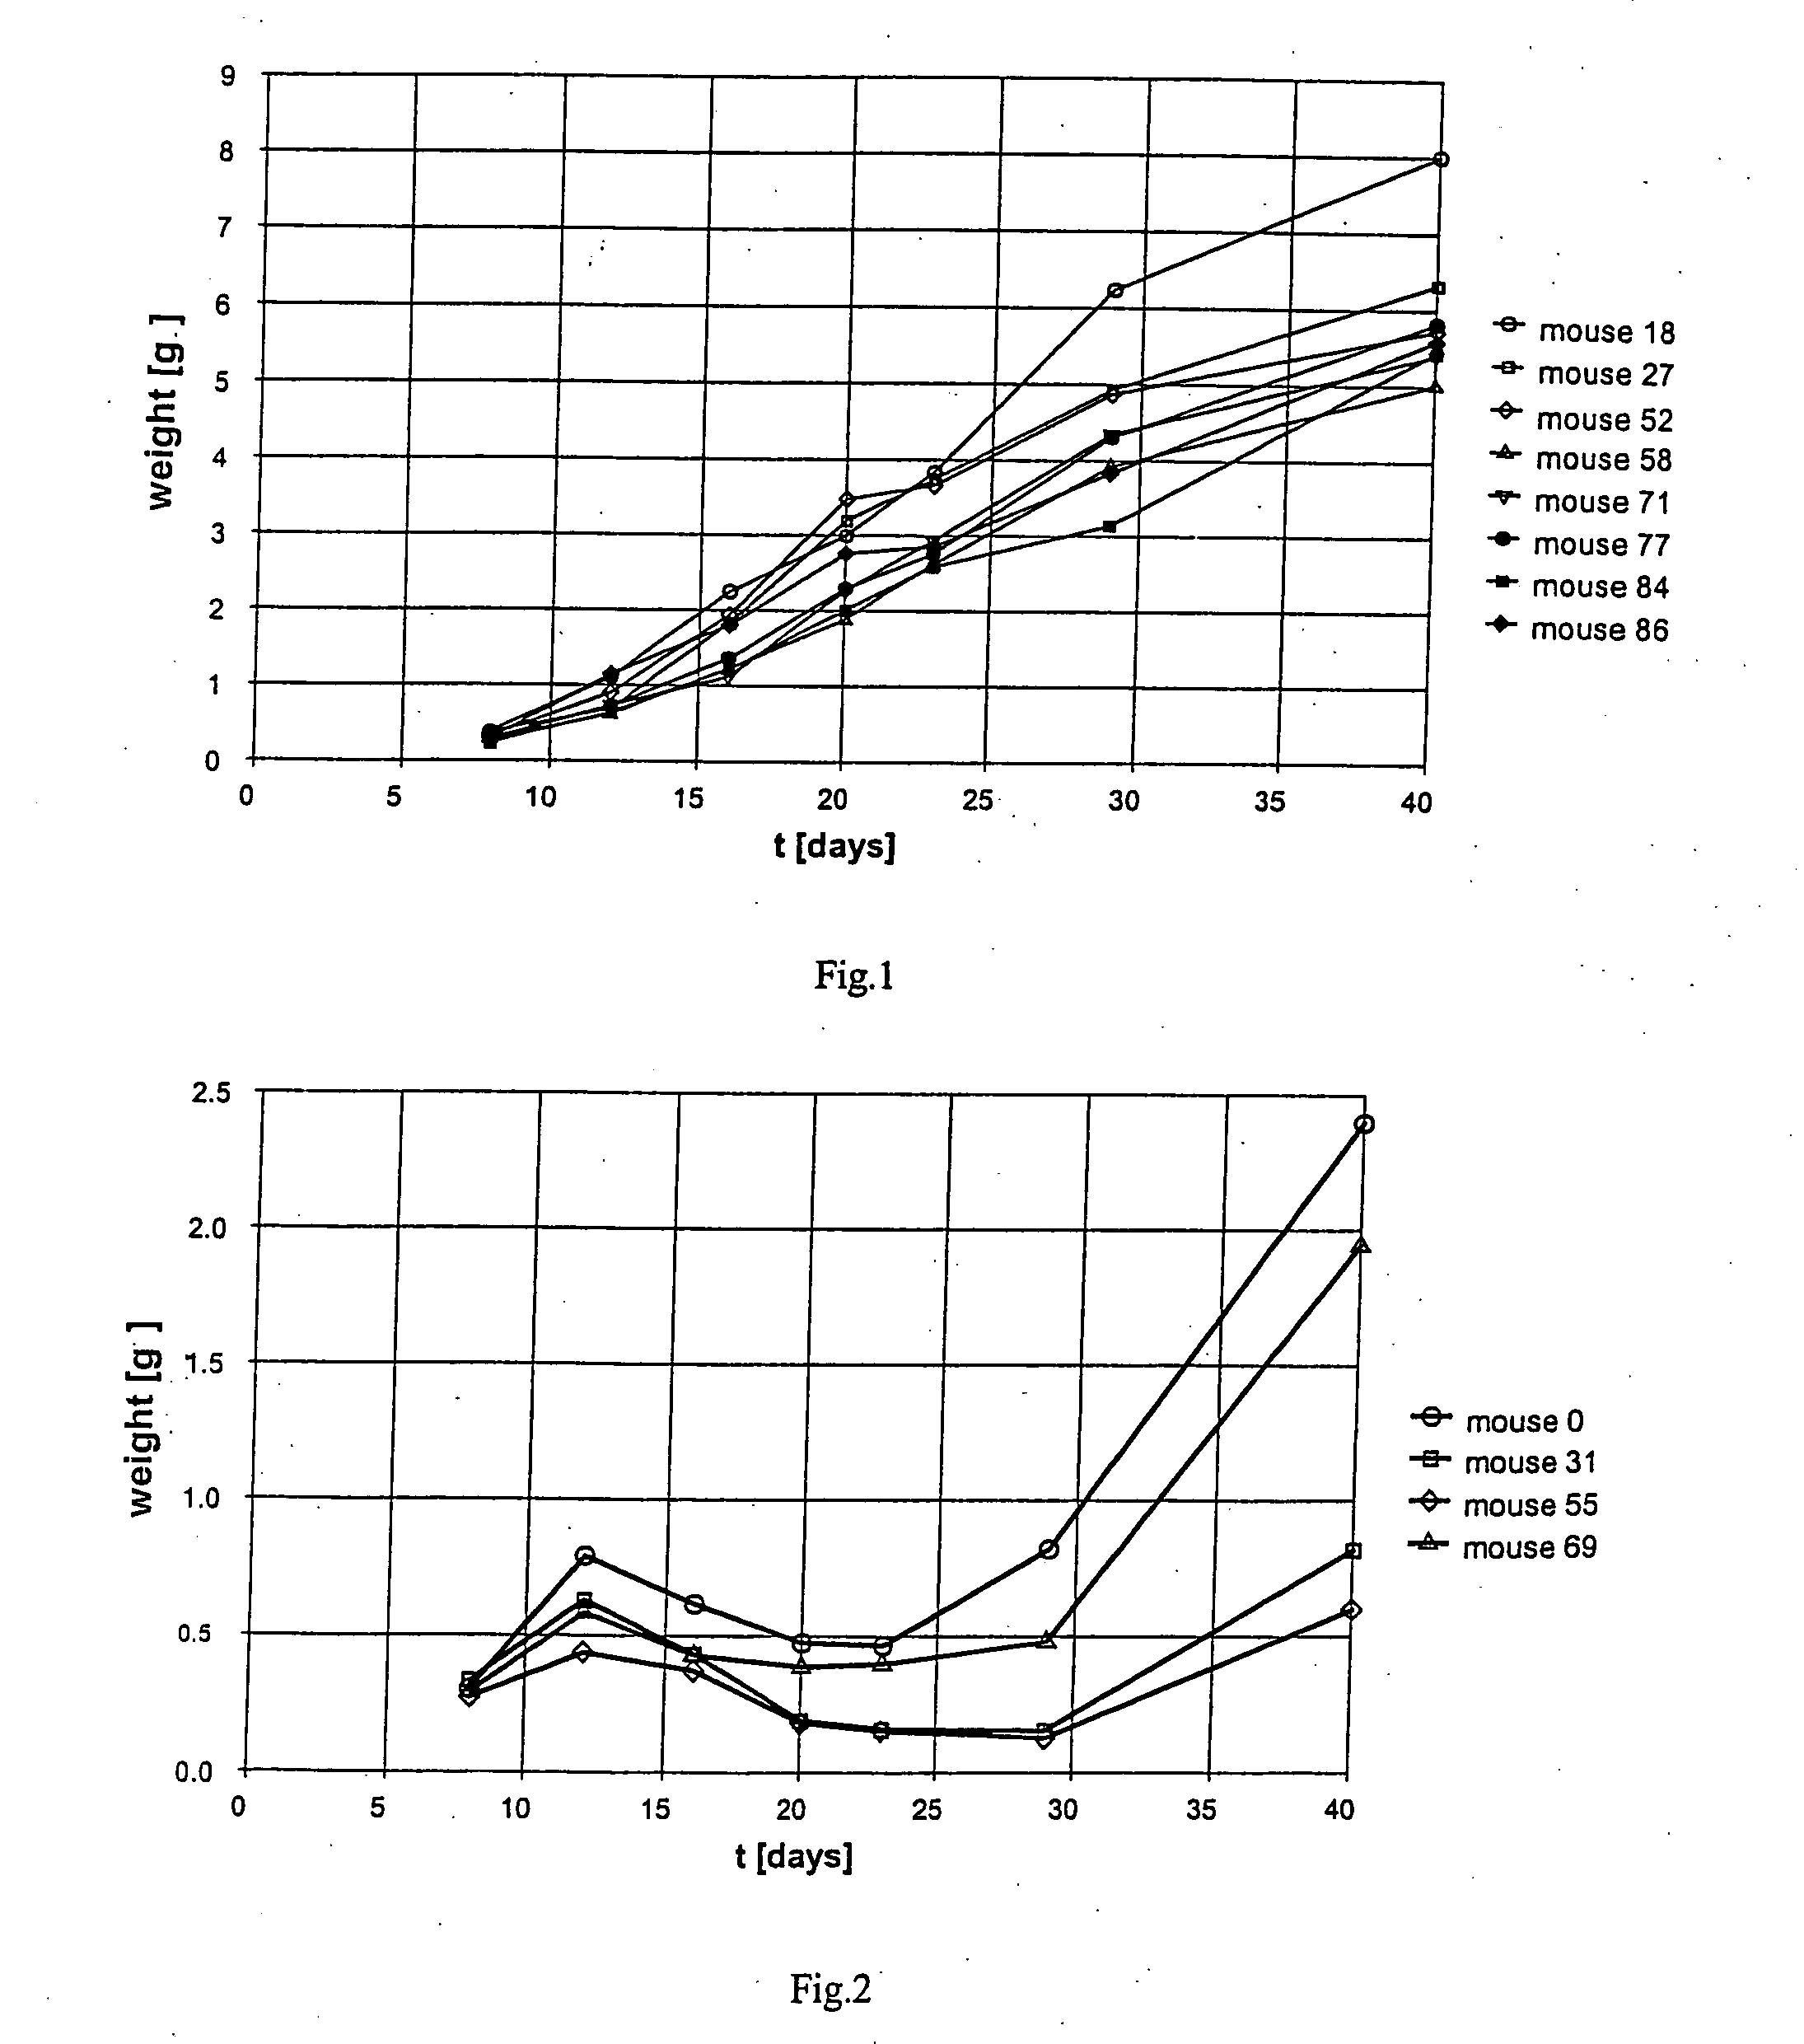
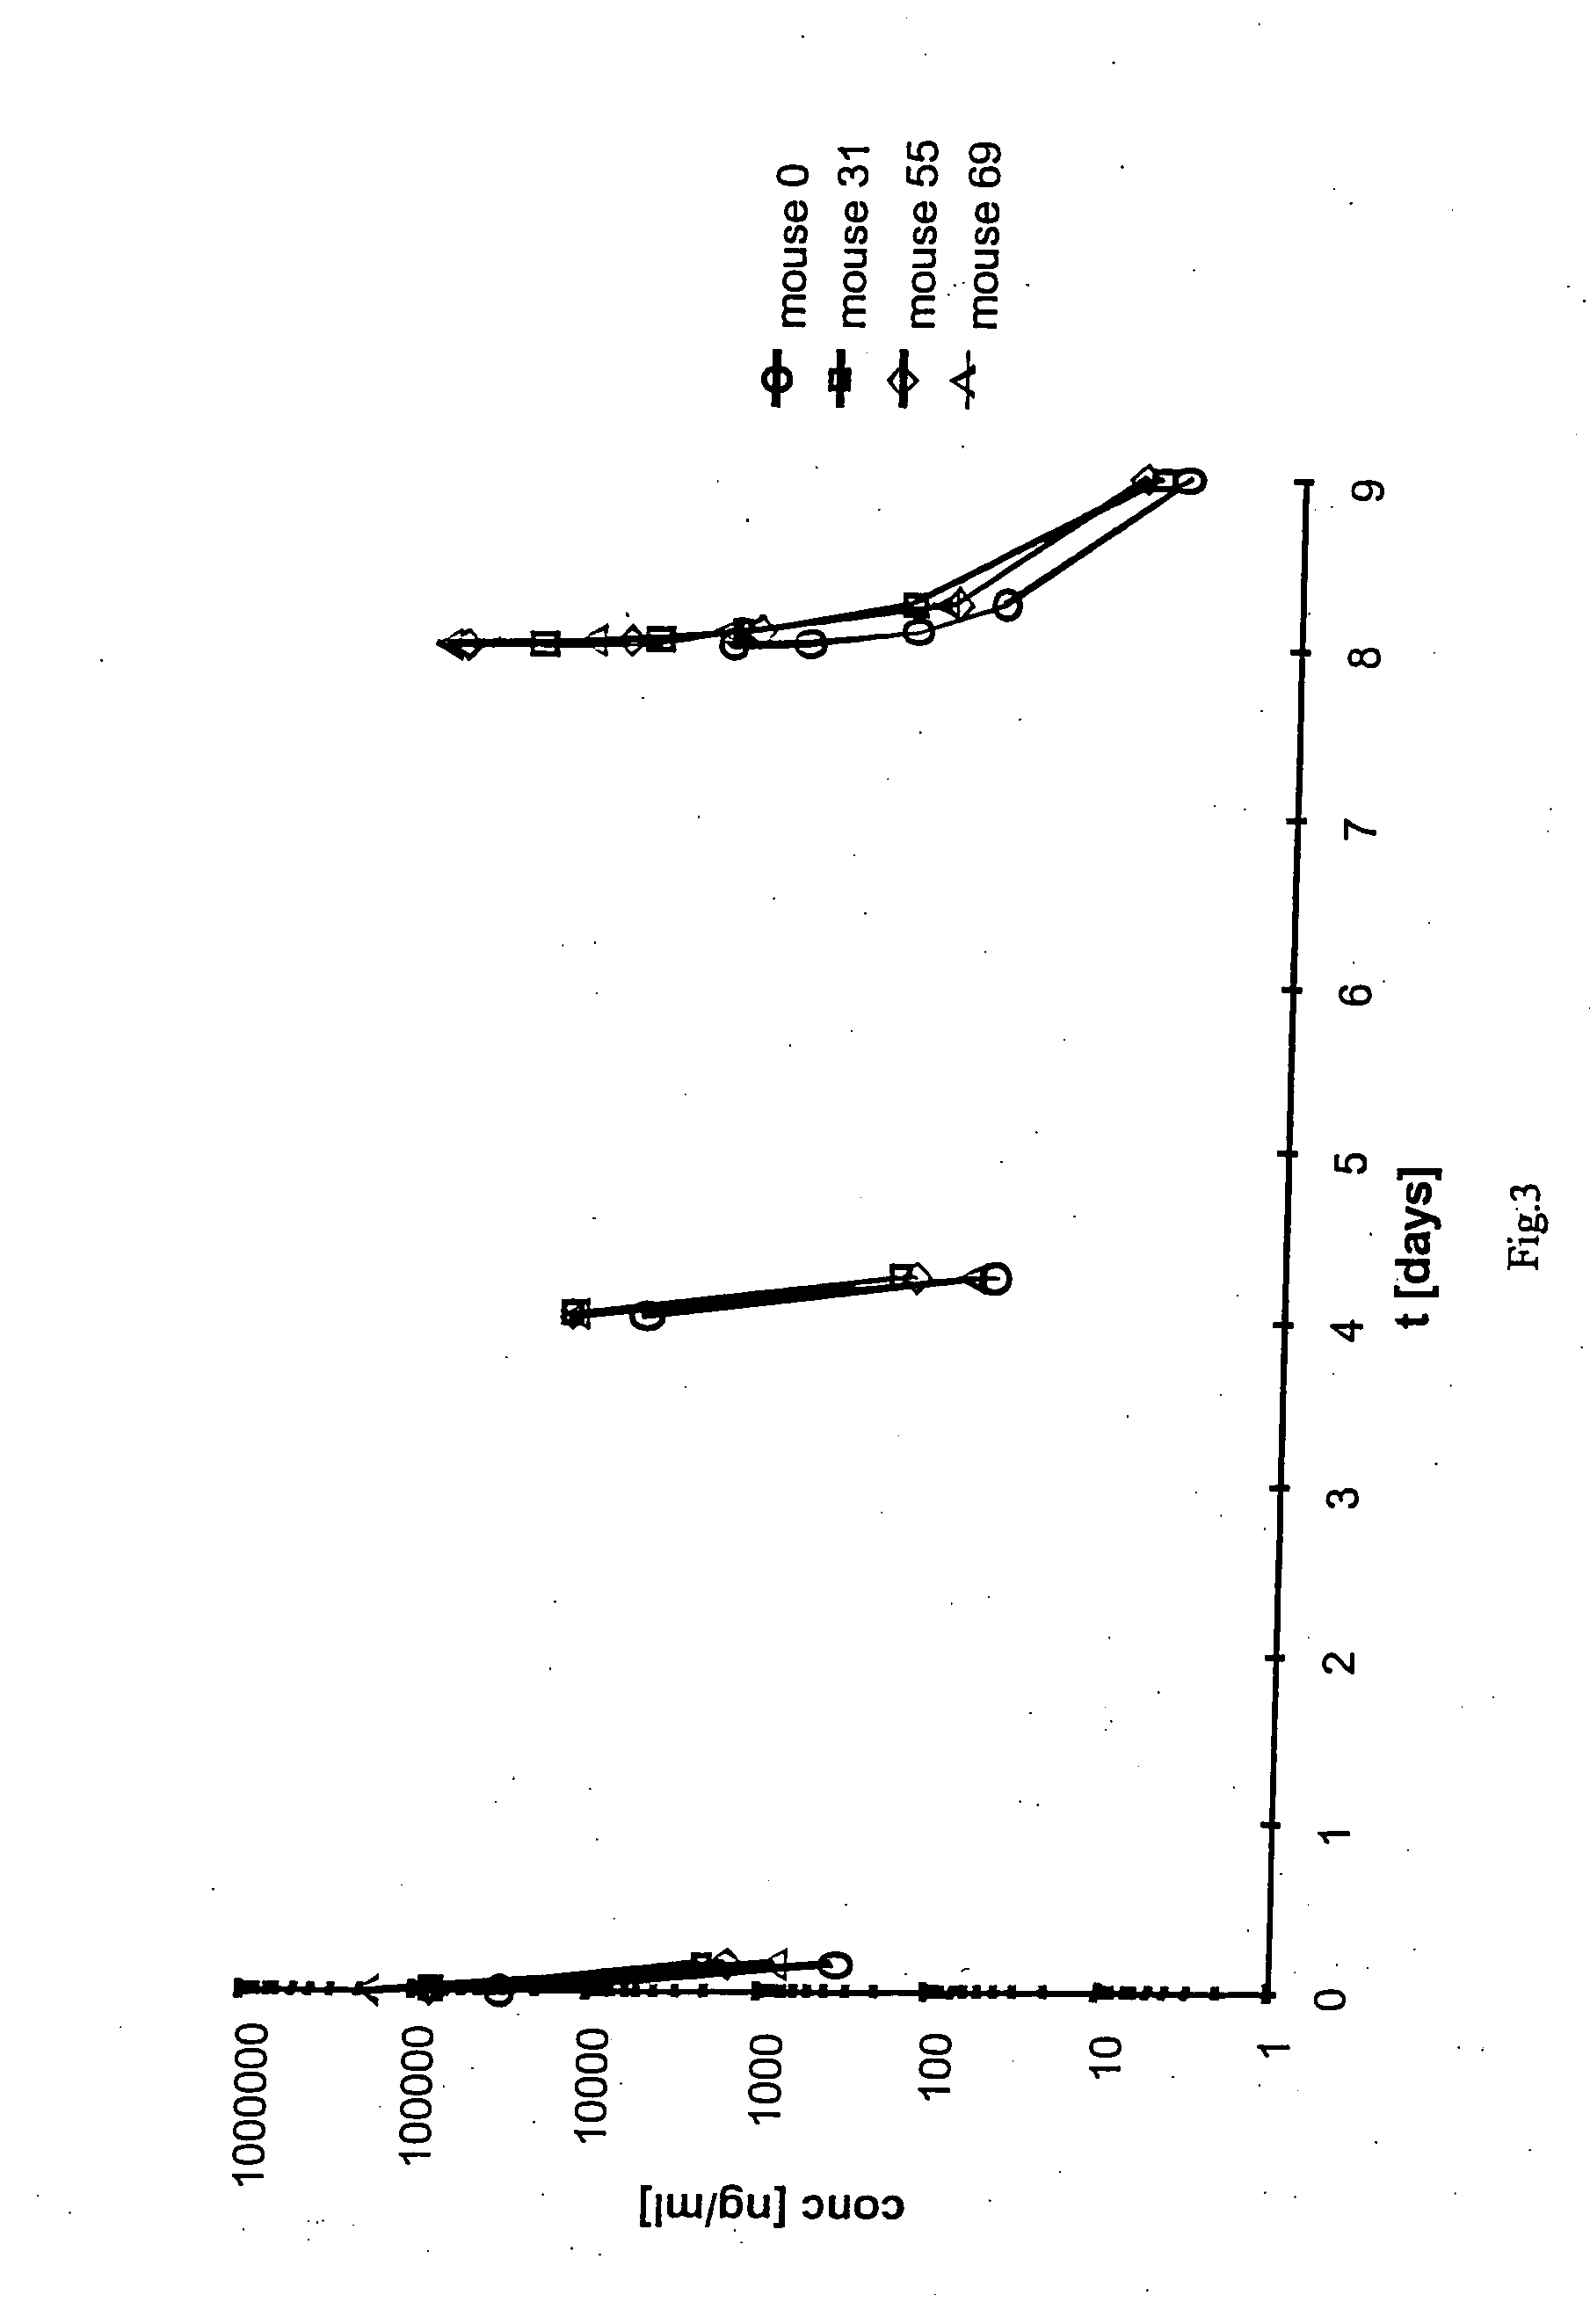
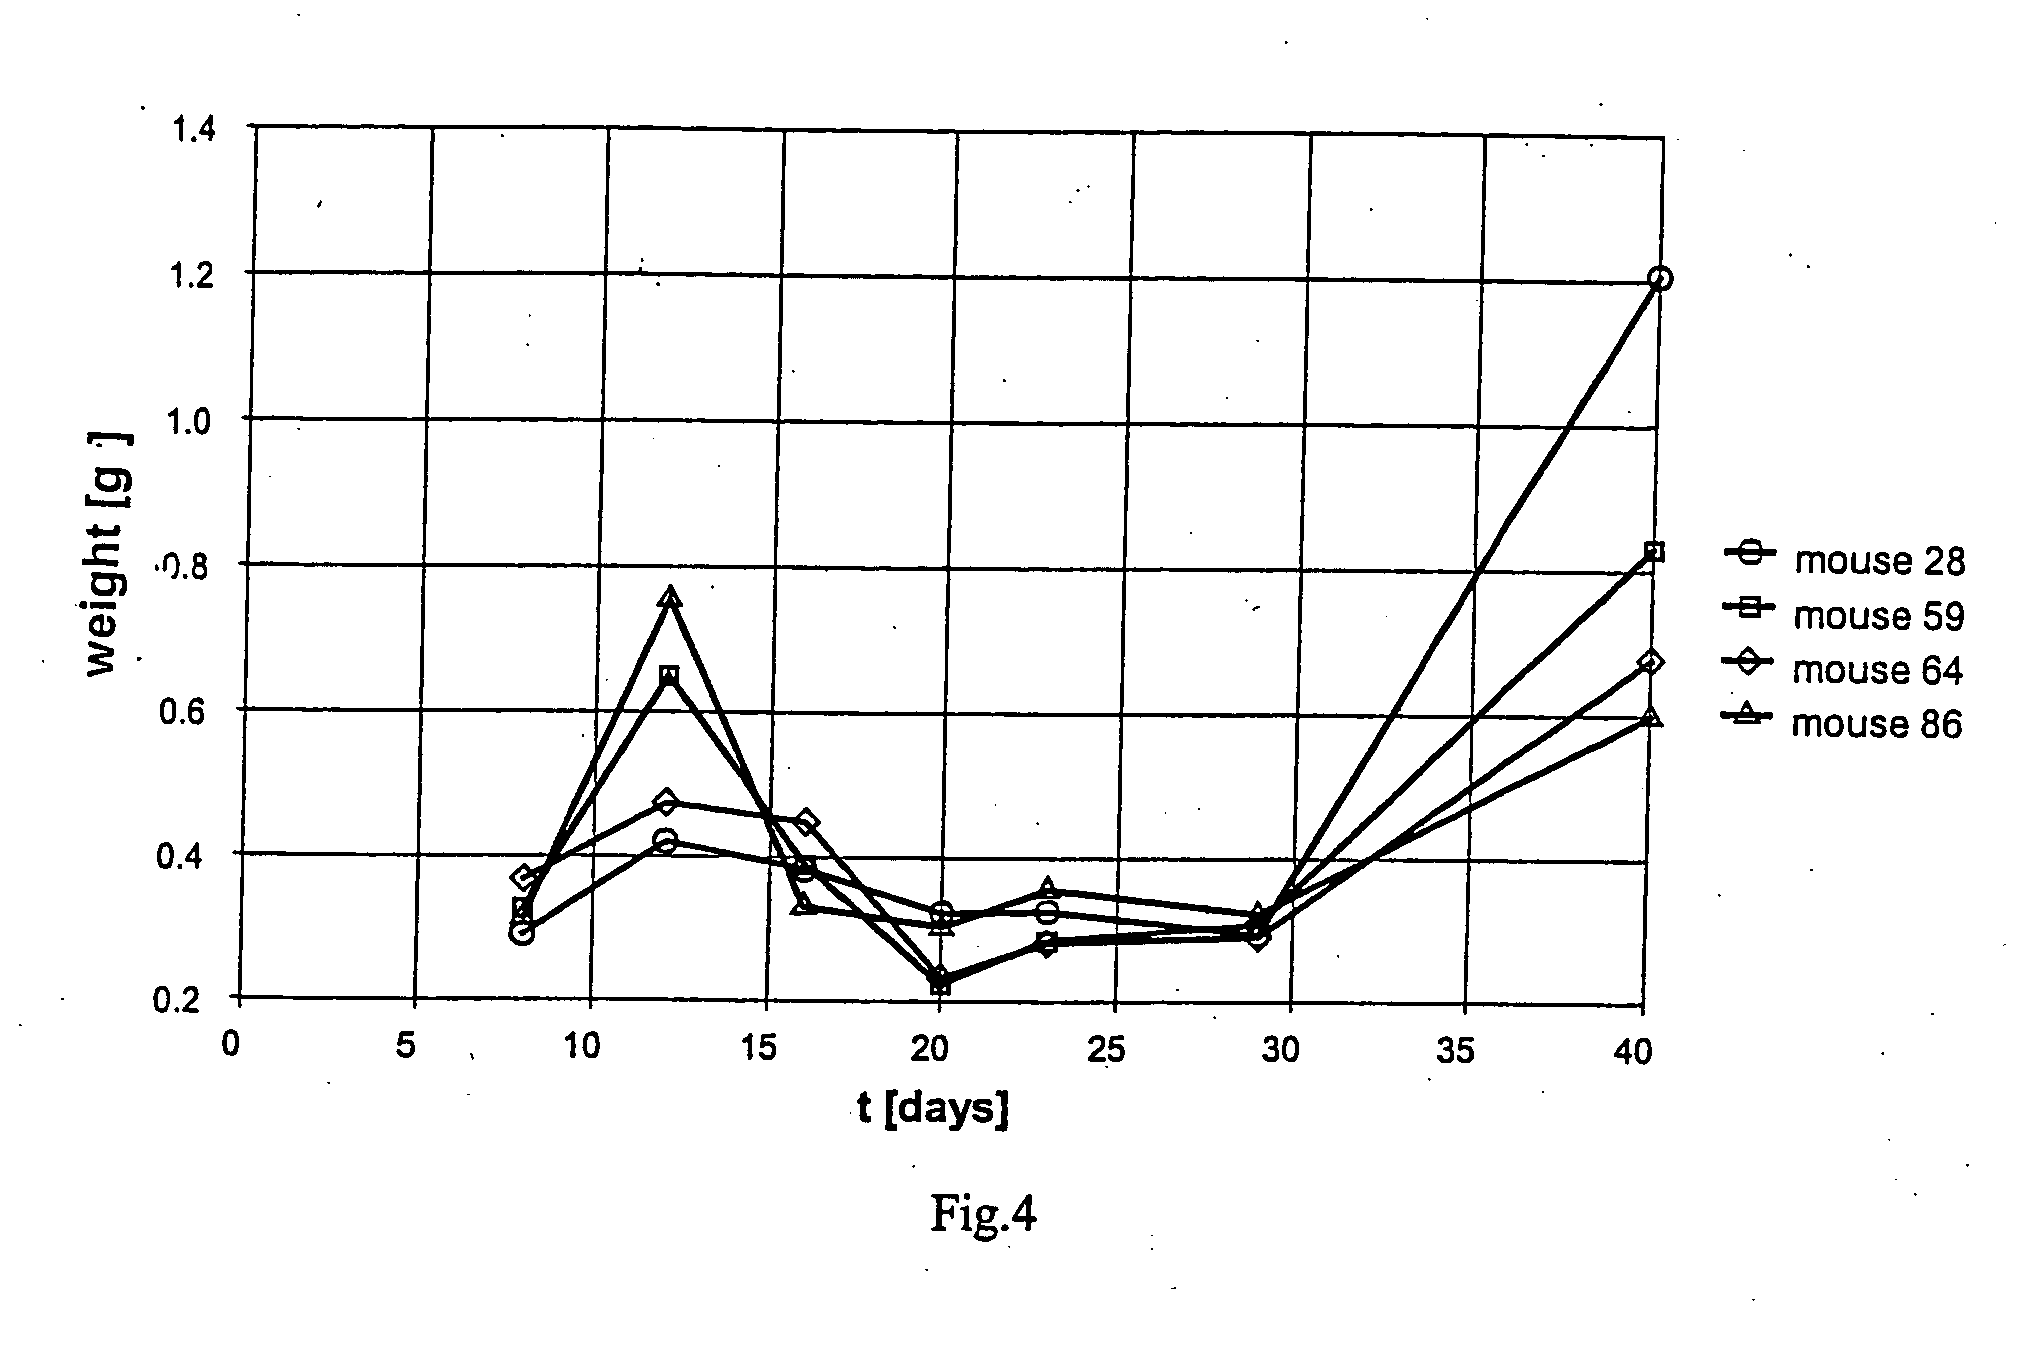
[0150] The cell line H207 (ovarian human carcinoma) was inoculated subcutaneously on the back of 70 female athymic nude mice, initially weighing 17.0-25.0 g. The animals were then subdivided in ten cages: [0151] I. Cage G1: the control group, consisting of 7 mice [0152] II. Cage G2: 7 mice, treated with 3 iv-bolus of Drug-C, repeated every 7 days (therapeutic regimen q7d×3), at a dosing of 0.39 mg / kg. [0153] III. Cage G3: 7 mice, treated with iv-bolus of Drug-C at the therapeutic regimen q7d×3, at a dosing of 0.52 mg / kg. [0154] IV. Cage G4: 7 mice, treated with iv-bolus of Drug-C at the therapeutic regimen q7d×3, at a dosing of 0.78 mg / kg. [0155] V. Cage G5: 7 mice, treated with 3 iv-bolus of Drug-C, repeated every 4 days (therapeutic regimen q4d×3), at a dosing of 0.26 mg / kg. [0156] VI. Cage G6: 7 mice, treated with iv-bolus of Drug-C at the therapeutic regimen q4d×3, at a dosing of 0.39 mg / kg. [0157] VII. Cage G8: 7 mice, treated with iv-bolus of Drug-C at the therapeutic regimen ...
PUM
 Abstract
Description
Claims
Application Information