Methods and apparatus for patient monitoring

a patient monitoring and apparatus technology, applied in the field of medical devices, can solve the problems of poor signal, limited diagnostic value of monitoring snoring as a diagnostic parameter, and inadequacies of finger attachment on subjects, and achieve the effect of reducing the hydrostatic head change effect on the blood oxygen index

Inactive Publication Date: 2005-10-06
PORT A NIRS PTY LTD
View PDF21 Cites 96 Cited by
  • Summary
  • Abstract
  • Description
  • Claims
  • Application Information

AI Technical Summary

Benefits of technology

[0042] Preferably, the calibration factor is determined empirically so as to

Problems solved by technology

During mouth breathing, nasal prongs give false positive apnea events, and generally the signal is poor during periods of snoring, a parameter which in itself is characteristic of sleep apnea.
However, monitoring snoring as a diagnostic parameter has limited diagnostic value unless used in conjunction with other transducers (Hemdndez et al., Chest 2001; 119:442-450).
There are several disadvantages in using oximetry for measuring hypoxia, including:
2) The finger attachment is not appropriate for use on subjects who thrash around during the study, as a consequence of continual arousal (dislodgment of the oximeter probe is one of the most common equipment failures in respiratory monitoring).
Tightly clamping probes, which

Method used


Image

  • Methods and apparatus for patient monitoring
  • Methods and apparatus for patient monitoring
  • Methods and apparatus for patient monitoring

Examples


example 1

Use of NIRS for Measuring Physiological Parameters

(i) Blood Oxygen Saturation (StO2) Index

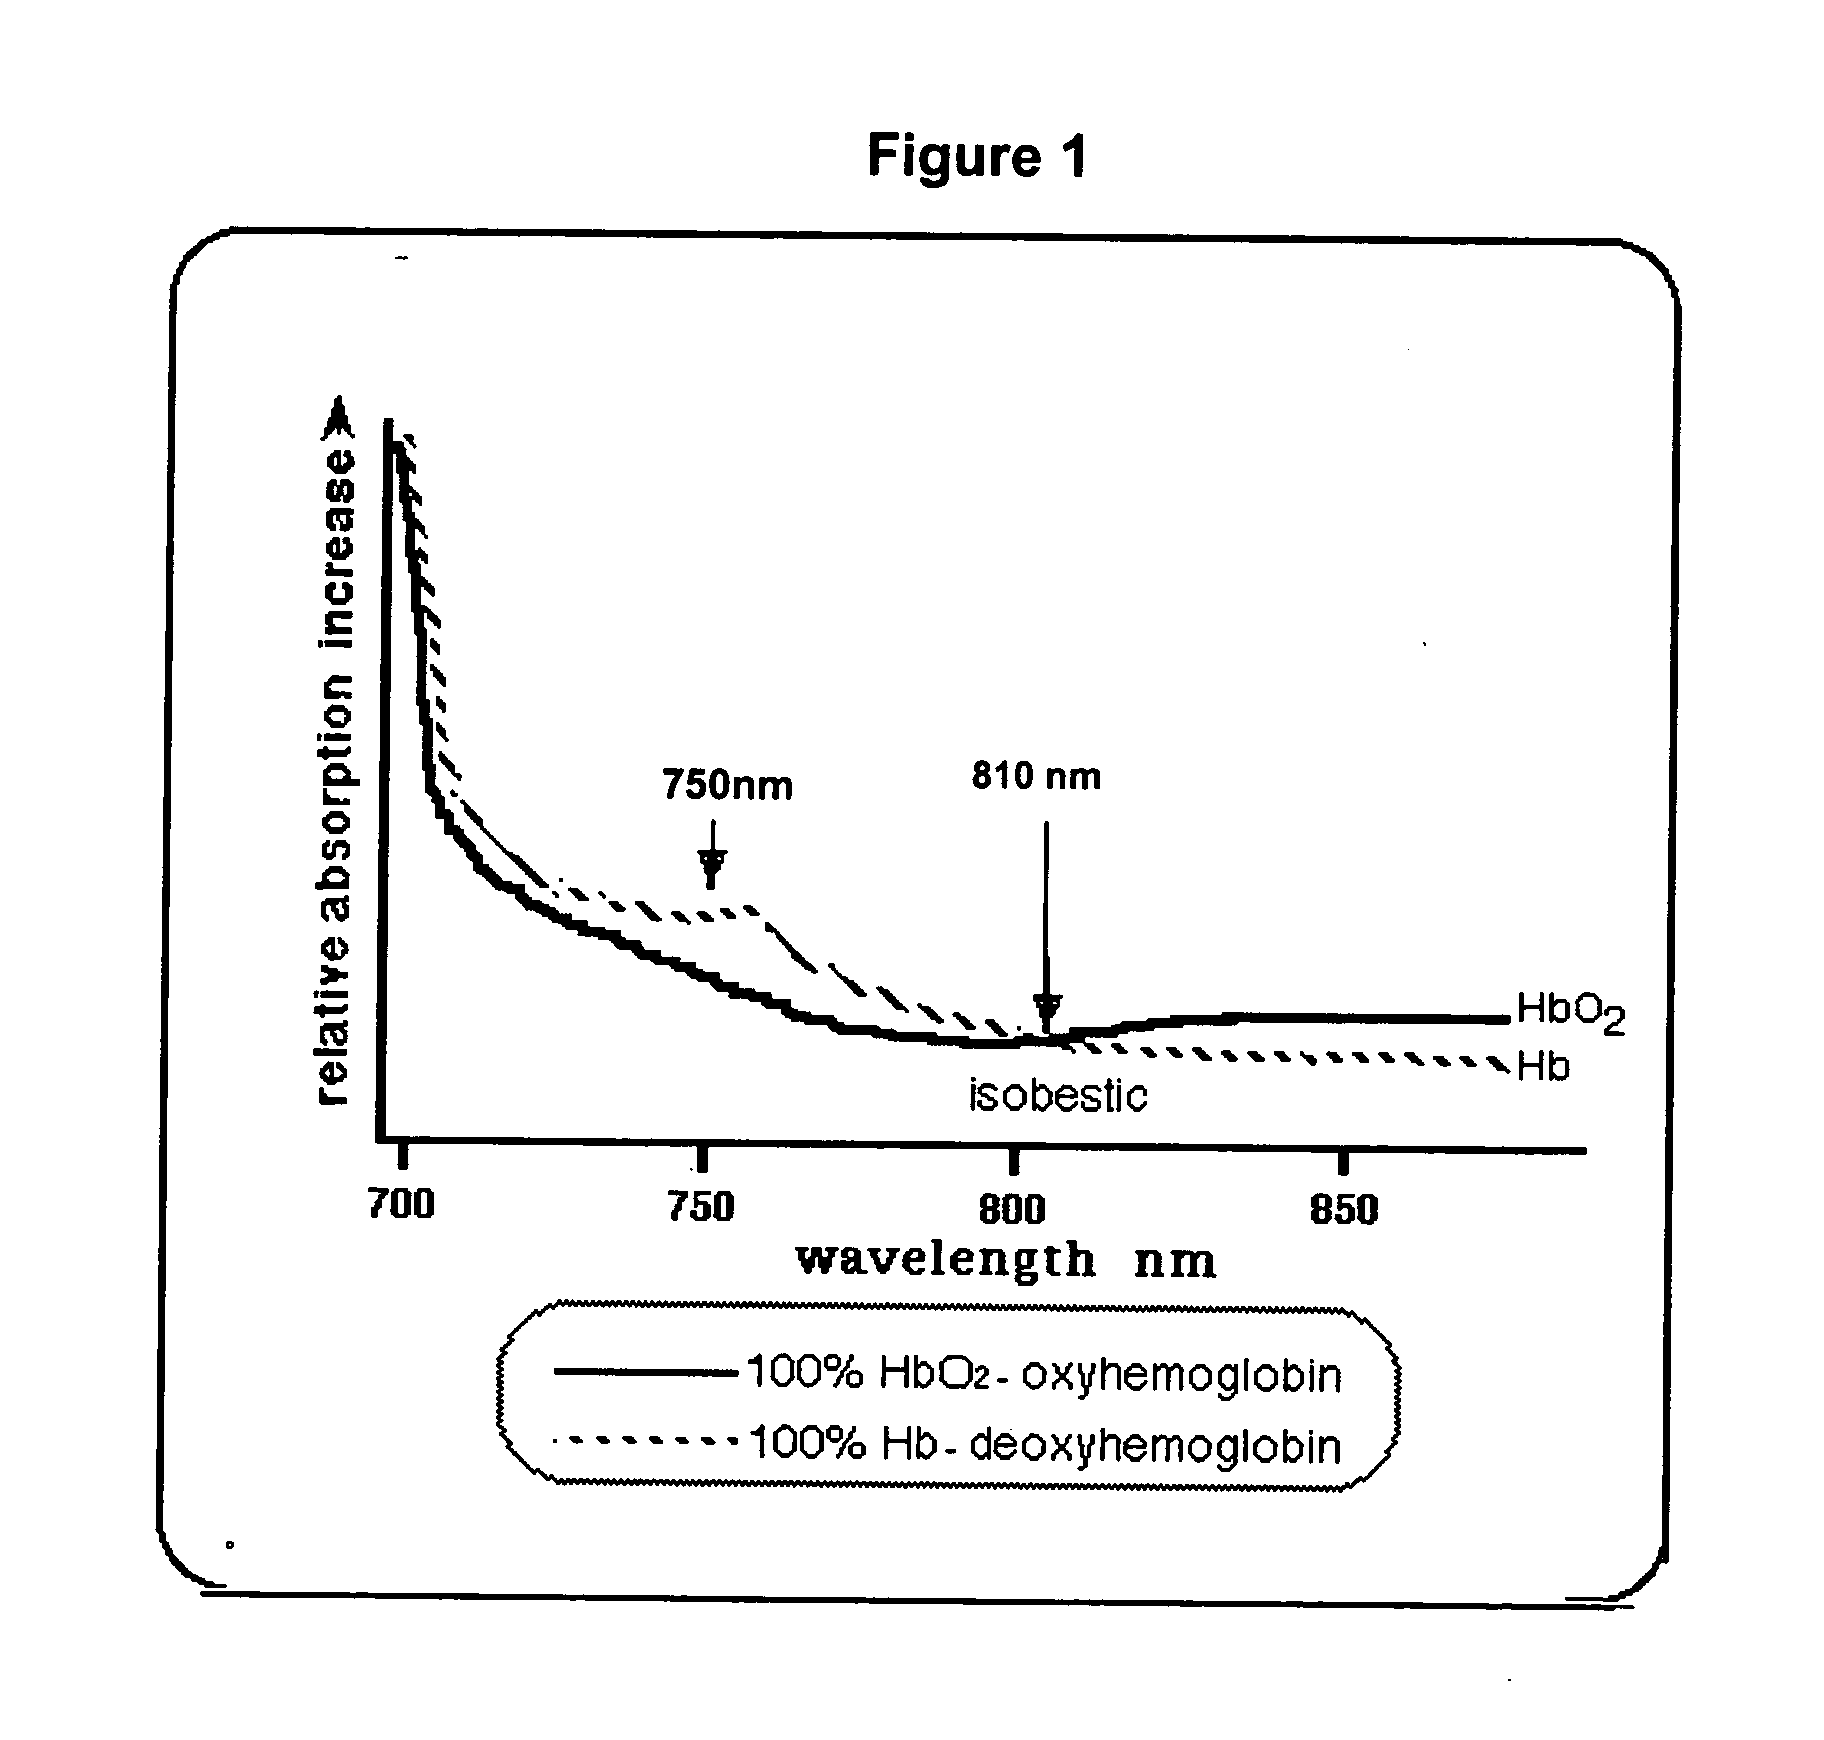
[0140]FIG. 1 illustrates the response of infrared light when transmitted through blood. The relatively low absorption of photons in the infrared part of the spectrum compared to that of the visible part of the spectrum (below 700 nm) is shown, as is an absorption peak centered at ˜760 nm evident with deoxygenated blood compared to oxygenated blood (StO2);

[0141] Finally, the wavelength at which the light absorption is independent of blood oxygen saturation levels, 810±5 nm, called the isosbestic wavelength, is also marked indicated in FIG. 1.

[0142] Above 810 nm, oxyhemoglobin shows a higher absorption than deoxyhemoglobin, the converse occurs below 810 nm.

[0143] A percentage of oxygen saturation of the hemoglobin within a tissue of interest can be calculated using NIRS from the following equation: stO2⁡(%)=100-deoxyhemoglobin×100deoxyhemoglobin+oxyhemoglobin

[0144] The comparison of absor...

example 2

Device Linearity for the Measurement of Blood-Oxygen

Materials and Methods

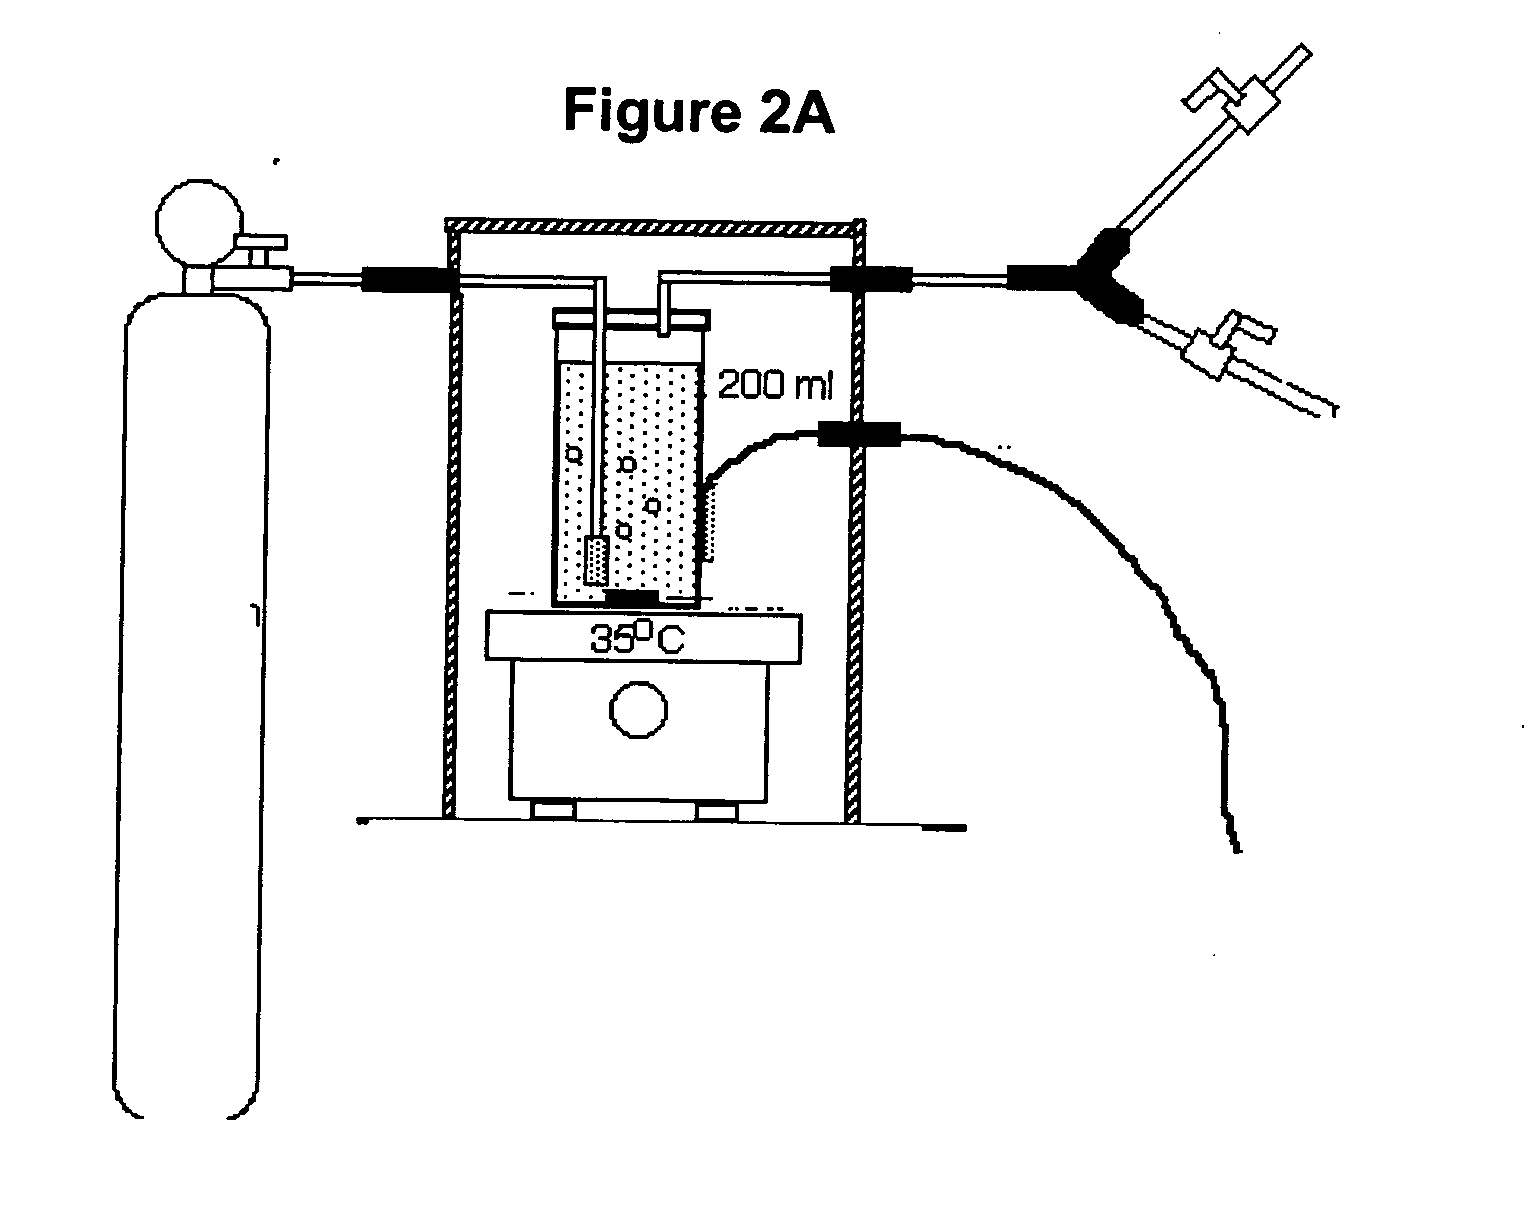
[0149]FIG. 2A shows experimental conditions for testing the response of the device to changes in blood oxygen experimentally in vitro. The equipment in the top of FIG. 2A shows a method for obtaining a 0 to 100% oxygen saturation in blood (ignoring the likely 1% oxidized hemoglobin) in pH-buffered solutions containing a known concentration of hemoglobin (5%, 4%, 3%, 3%, 2%, 1%, 0.5%, 0%) (in sheep red blood cells). Oxygen is stripped from the hemoglobin via competition with activated aerobic yeast, which consume oxygen in their metabolic activity. Increased / decreased pressures above the solution help confirm that total oxygen saturation / desaturation of the hemoglobin has occurred. The hemoglobin is again oxygen saturated by aspirating fine bubbles of oxygen through the solution for some minutes. One hundred percent blood-oxygen saturation was confirmed by pressurizing the vessel to observe any further uptak...

example 3

Interpretation of Spectra Acquired by the Monitoring Apparatus: Analysis of Apnea Events

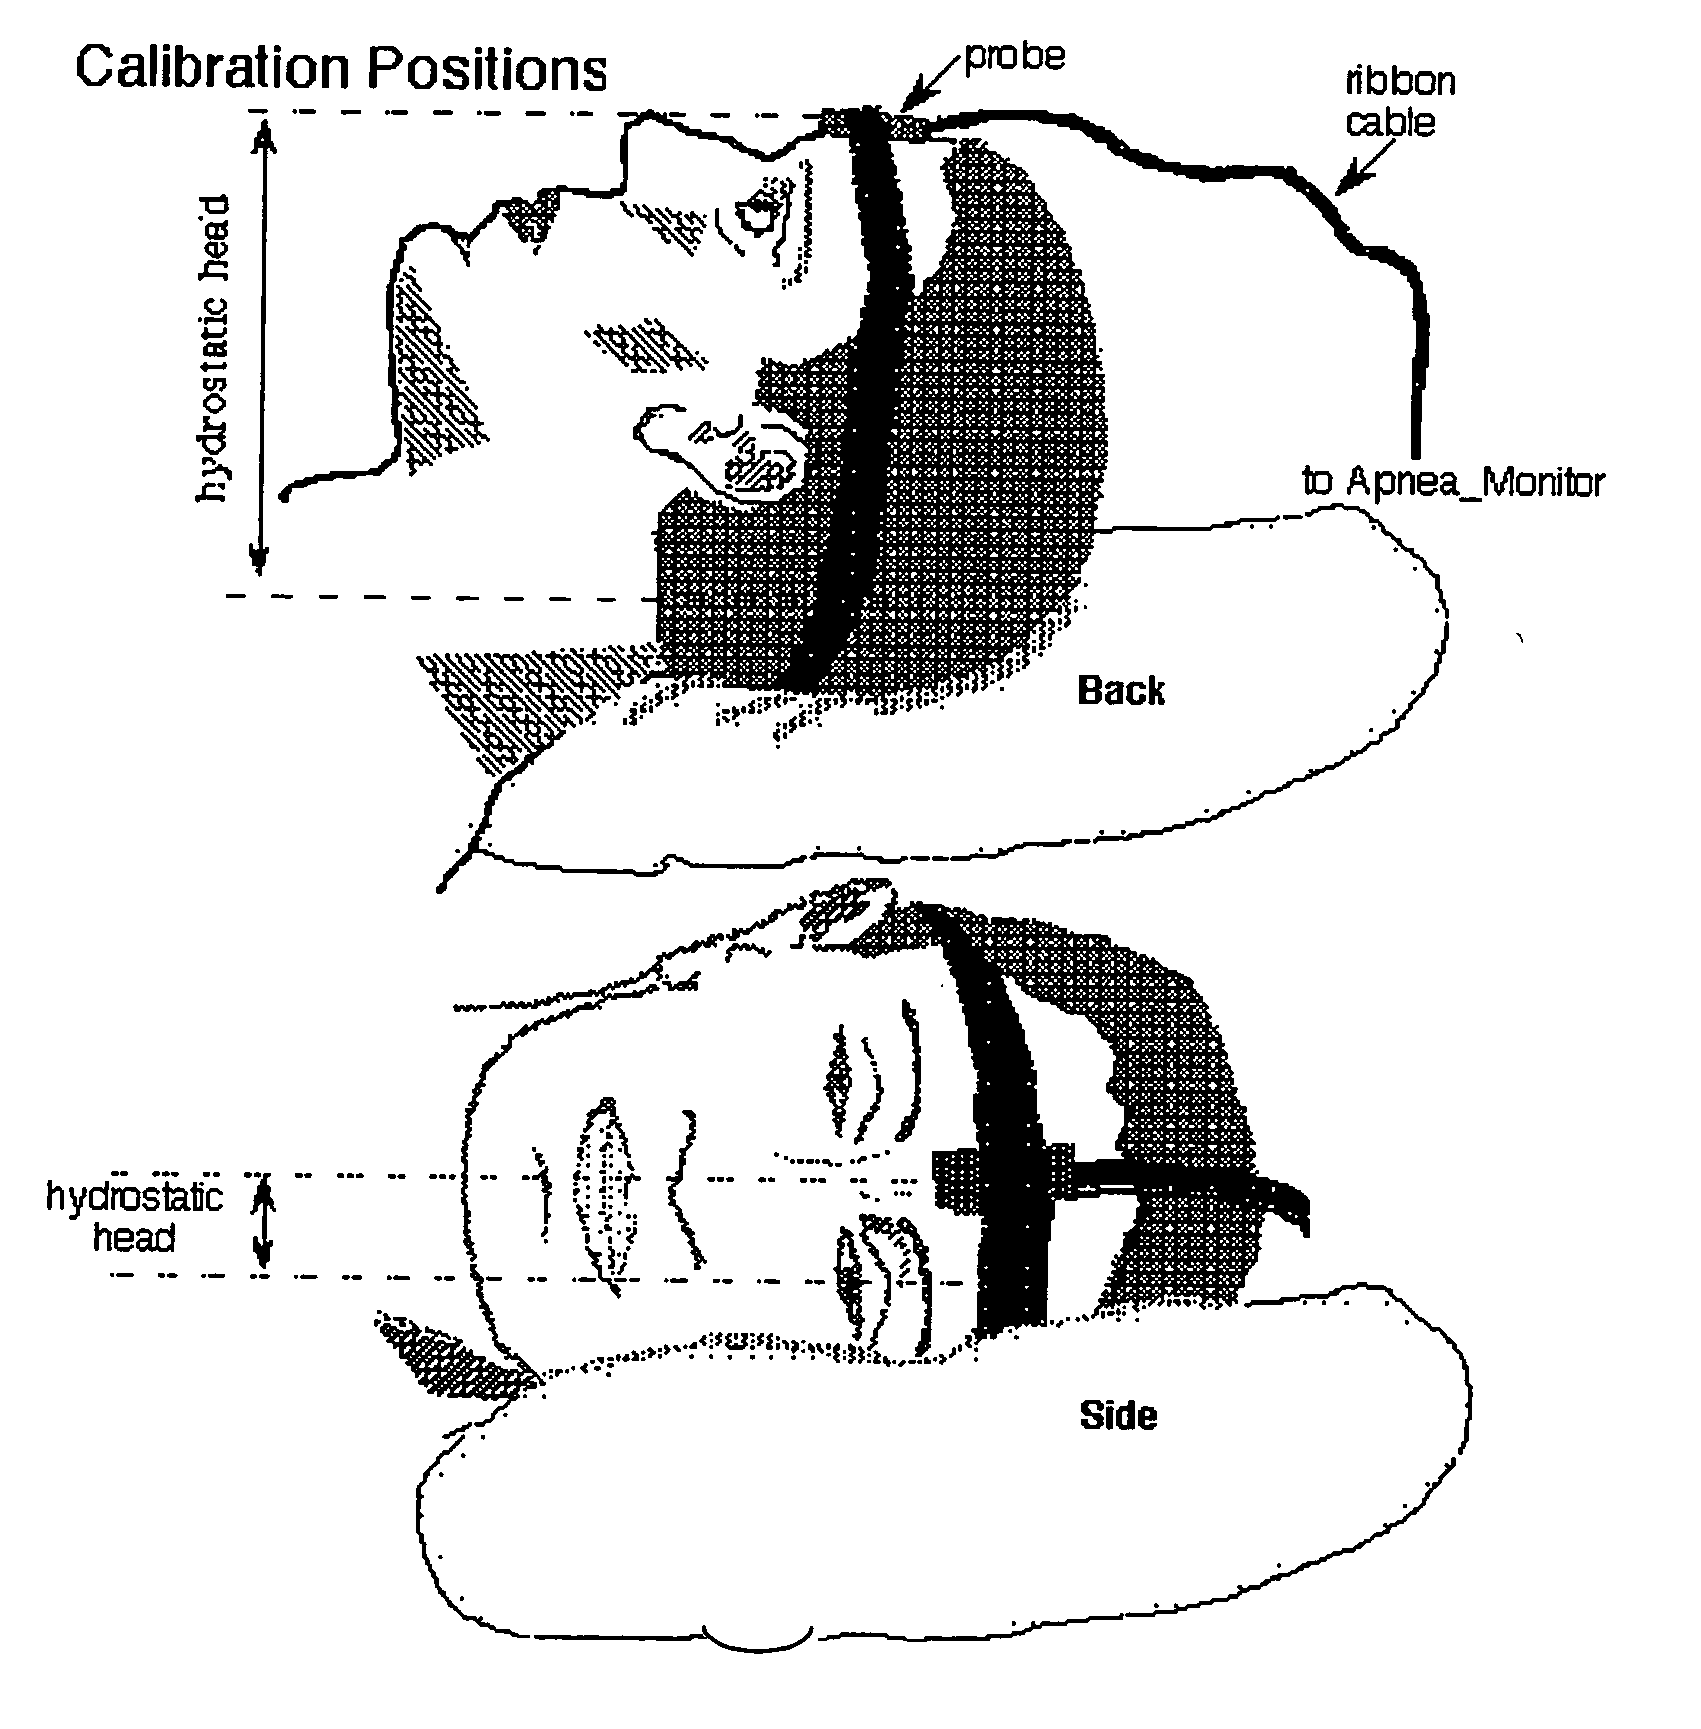
[0154] The apparatus schematically depicted in FIG. 3C was used for detecting respiratory parameters in a patient. FIG. 6 shows multiple peaks in both blood volume and blood oxygen while the subject is on their back. These are multiple mild apnea events, not present when the patient is lying on their side. Over the approximately 24 minutes of repeated apnea events there were no cumulative changes in blood volume or blood oxygen levels (average voltage maintained).

[0155] This suggests each brief recovery period was sufficient to return both oxygen saturation and blood volume to quiescent conditions, resulting in little oxygen stress. Examining the trace at briefer time intervals, enables the counting the number of these apnea events over time and thus a score of apnea or hypopnea events per hour can be obtained, as required for standard diagnostic criteria of sleep-disordered breathing.

[0156] ...


PUM


Abstract

A respiratory monitoring apparatus that detects changes in physiological parameters relevant to respiration, including blood oxygen and blood volume, using near infrared spectroscopy. Methods for diagnosing respiratory-related events including hypoxia index, hypopnea, arousal, tissue oxygen debt, and respiratory muscle events or distinguishing central from obstructive sleep apnea are also disclosed.

Description

[0001] The present application claims the benefit of provisional application Ser. No. 60 / 558,364, filed Mar. 30, 2004, the disclosure of which is expressly incorporated by reference herein in its entirety.FIELD OF THE INVENTION [0002] The present invention relates generally to medical devices that provide information regarding respiratory parameters. BACKGROUND OF THE INVENTION [0003] Respiratory monitoring is a crucial tool for clinical diagnostics and patient safety, particularly when a subject is unconscious, such as during sleep or an induced unconscious state. [0004] In the current diagnosis of disordered respiration, such as sleep apnea, extensive instrumentation is required. Techniques and devices used for diagnosing sleep apnea include electroencephalograms, electrocardiograms, electromyographs, pulse oximetry, ocular and body movement strain gauges, snoring recording, postural position monitoring and respiratory gas flow monitoring. In practice, only four or so of these tra...

Claims


Application Information

Patent Timeline
IPC IPC(8): A61B5/08A61B5/00
CPCA61B5/1116A61B5/1455A61B5/14553A61B5/1495A61B5/4818A61B5/6814A61B2560/0247
Inventor COOPER, PHILIP GEORGE
Owner PORT A NIRS PTY LTD
Why Eureka
Try Eureka