Raman molecular imaging for detection of bladder cancer

a molecular imaging and bladder cancer technology, applied in the field oframan spectroscopy and mammalian cellular evaluation, can solve the problems of difficult detection of cancer cells, reduced productivity and quality of life achieved by advanced cancer patients, and significant cancers, so as to facilitate comparison, facilitate comparison, facilitate comparison

Inactive Publication Date: 2005-11-10
CHEMIMAGE
View PDF12 Cites 32 Cited by
  • Summary
  • Abstract
  • Description
  • Claims
  • Application Information

AI Technical Summary

Benefits of technology

[0037]FIG. 4 comprises FIGS. 4A, 4B, 4C, and 4D. FIG. 4A is a graph of Raman scattering intensity over a range of Raman shift values for bladder cells collected from urine of a healthy patient (thin solid line), bladder cells collected from urine of a patient afflicted with low grade (grade 1) bladder cancer (dotted line), and bladder cells collected from urine of a patient afflicted with high grade (grade 3) bladder cancer (thick solid line). The baselines of the spectra are offset to facilitate comparison. FIGS. 4B, 4C, and 4D are micrographs of a bladder cell collected from urine of a healthy patient (4B), a bladder cell collected from urine of a patient afflicted with low grade (grade 1) bladder cancer (4C), and a bladder cell collected from urine of a patient afflicted with high grade (grade 3) bladder cancer (4D).
[0038]FIG. 5 is a graph of Raman scattering intensity over a range of Raman shift values for bladder cells collected from urine of two patients afflicted with grade 2 bladder cancer (dotted lines), and bladder cells collected from urine of a patient afflicted with grade 3 bladder cancer (solid line). The baselines of the spectra are offset to facilitate comparison.
[0039]FIG. 6 is a graph of Raman scattering intensity over a range of Raman shift values for bladder cells collected from urine of three patients afflicted with grade 1 bladder cancer (five lower spectra), and bladder cells collected from urine of four patients afflicted with grade 3 bladder cancer (four upper spectra). The baselines of the spectra are offset to facilitate comparison.
[0040]FIG. 7 is a trio of averaged Raman spectra obtained from bladder cells collected from urine of normal patients (dashed line), patients afflicted with grade 1 bladder cancer (dotted line), and patients afflicted with grade 3 bladder cancer (solid line). The baselines of the spectra are offset to facilitate comparison.

Problems solved by technology

Cancer is significant, not only in terms of mortality and morbidity, but also in terms of the cost of treating advanced cancers and the reduced productivity and quality of life achieved by advanced cancer patients.
Because cancers arise from cells of normal tissues, cancer cells usually initially closely resemble the cells of the original normal tissue, often making detection of cancer cells difficult until the cancer has progressed to a stage at which the differences between cancer cells and the corresponding original normal cells are more pronounced.
Communication of results from the pathologist to the physician and to the patient can further slow the diagnosis of the cancer and the onset of any indicated treatment.
At present there is no effective and affordable method for screening and detecting tumors in the general high-risk population.
Urine cytology is effective for detecting high-grade bladder cancers (75-90% of cases detected), but fails to detect almost all papillary urothelial neoplasms of low malignant potential.
Other sensitive tests for certain low grade cancers exist (e.g., detection of markers such as BTA, Lewis X, Bard, HA-Haase, Stat, NMP 22, C-K 19, and CYFRA 21-1, and microsatellite assay), but have the disadvantages of high cost and applicability to only certain tumors.
Therefore, none of these bladder cancer assays has replaced cystoscopy as a standard diagnostic procedure.
Because of the tissue preparation required, this process is relatively slow.
Moreover, the differentiation made by the pathologist is based on subtle morphological and other differences among normal, malignant, and benign cells, and such subtle differences can be difficult or time-consuming to detect, even for highly experienced pathologists.
Such differences are even more difficult for relatively inexperienced pathologists to detect.
Histopathological analysis of cell and tissue samples is highly subjective, and even experienced pathologists will sometimes differ in their assessments of the same samples.
The availability of adequately trained pathologists can limit the availability or economy of screening.
Such advanced stage, high grade tumors are often difficult, and sometimes impossible, to treat effectively.
However, cystoscopic screening of so many individuals is impractical and would be impractically expensive.
Performing single point measurements on a grid over a field of view will also introduce sampling errors which makes a high definition image difficult or impossible to construct.
Moreover, the serial nature of the spectral sampling (i.e., the first spectrum in a map is taken at a different time than the last spectrum in a map) decreases the internal consistency of a given dataset, making the powerful tools of chemometric analysis more difficult to apply.
Treado disclosed that Raman molecular imaging can be used to distinguish breast cancer tissue from normal breast tissue, but did not disclose how or whether any similar method might be applicable to diagnosis, grading, or staging of bladder cancers or other cancer diagnostic methods and protocols.

Method used


Image

  • Raman molecular imaging for detection of bladder cancer
  • Raman molecular imaging for detection of bladder cancer
  • Raman molecular imaging for detection of bladder cancer

Examples


example

[0092] The invention is now described with reference to the following Example. This Example is provided for the purpose of illustration only, and the invention is not limited to this Example, but rather encompasses all variations which are evident as a result of the teaching provided herein.

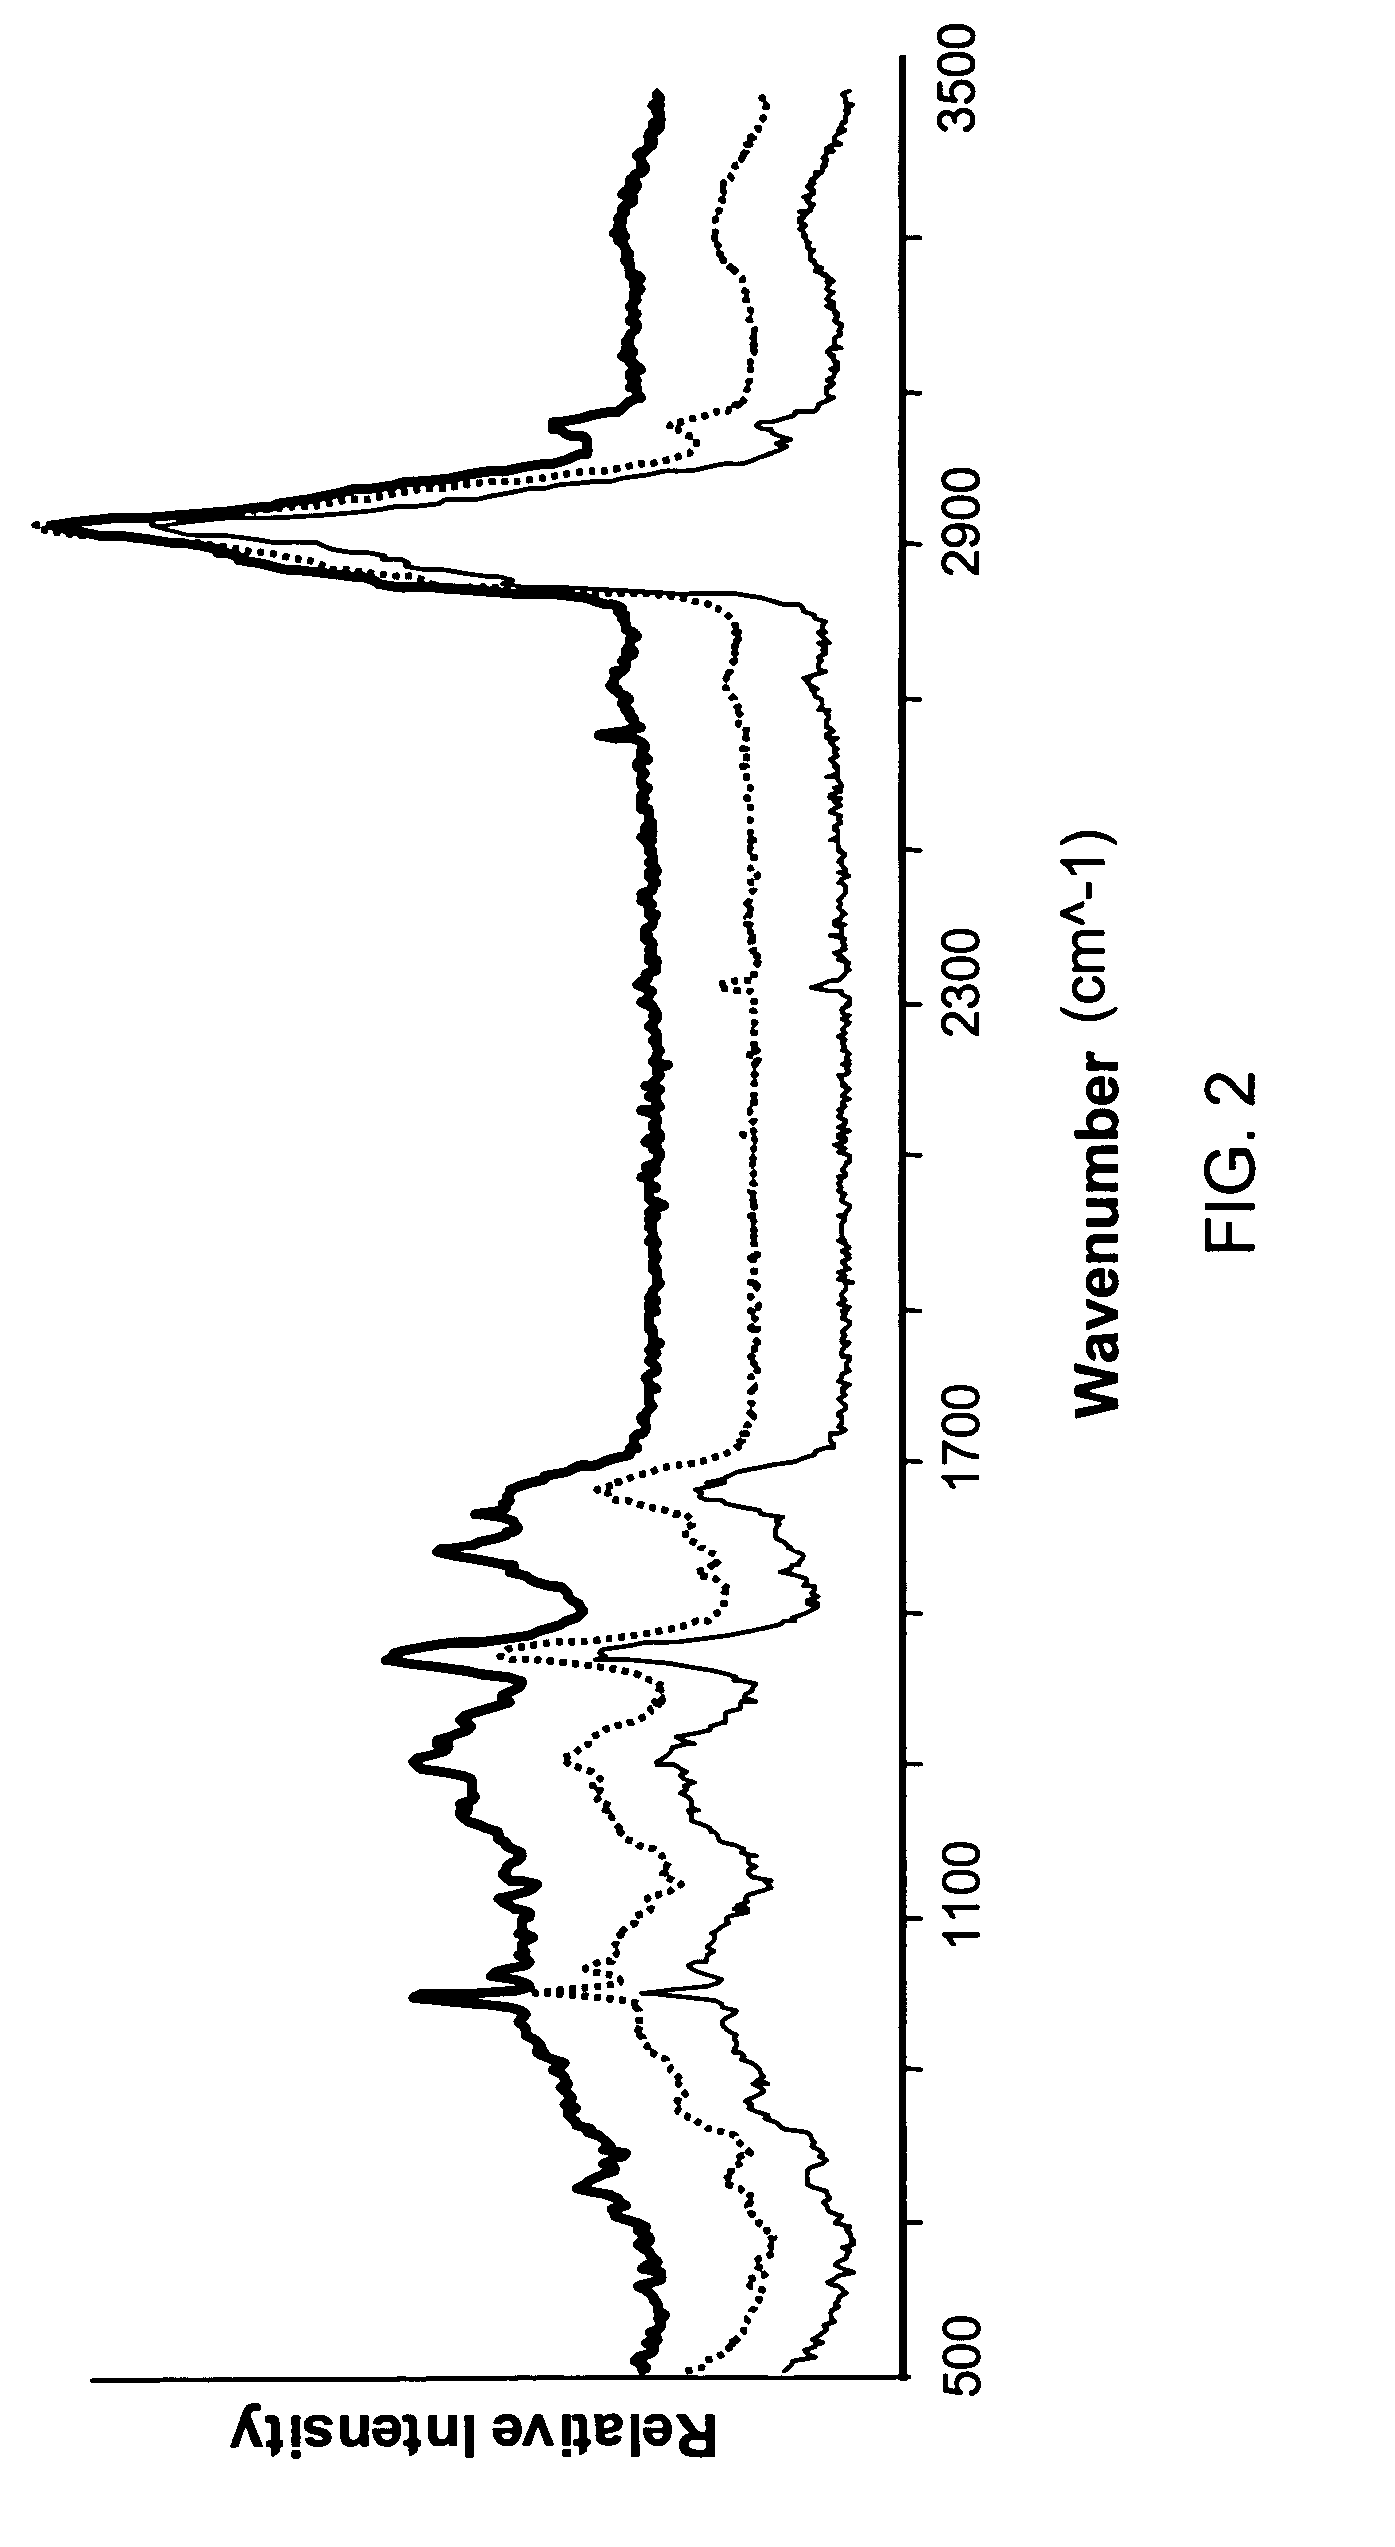
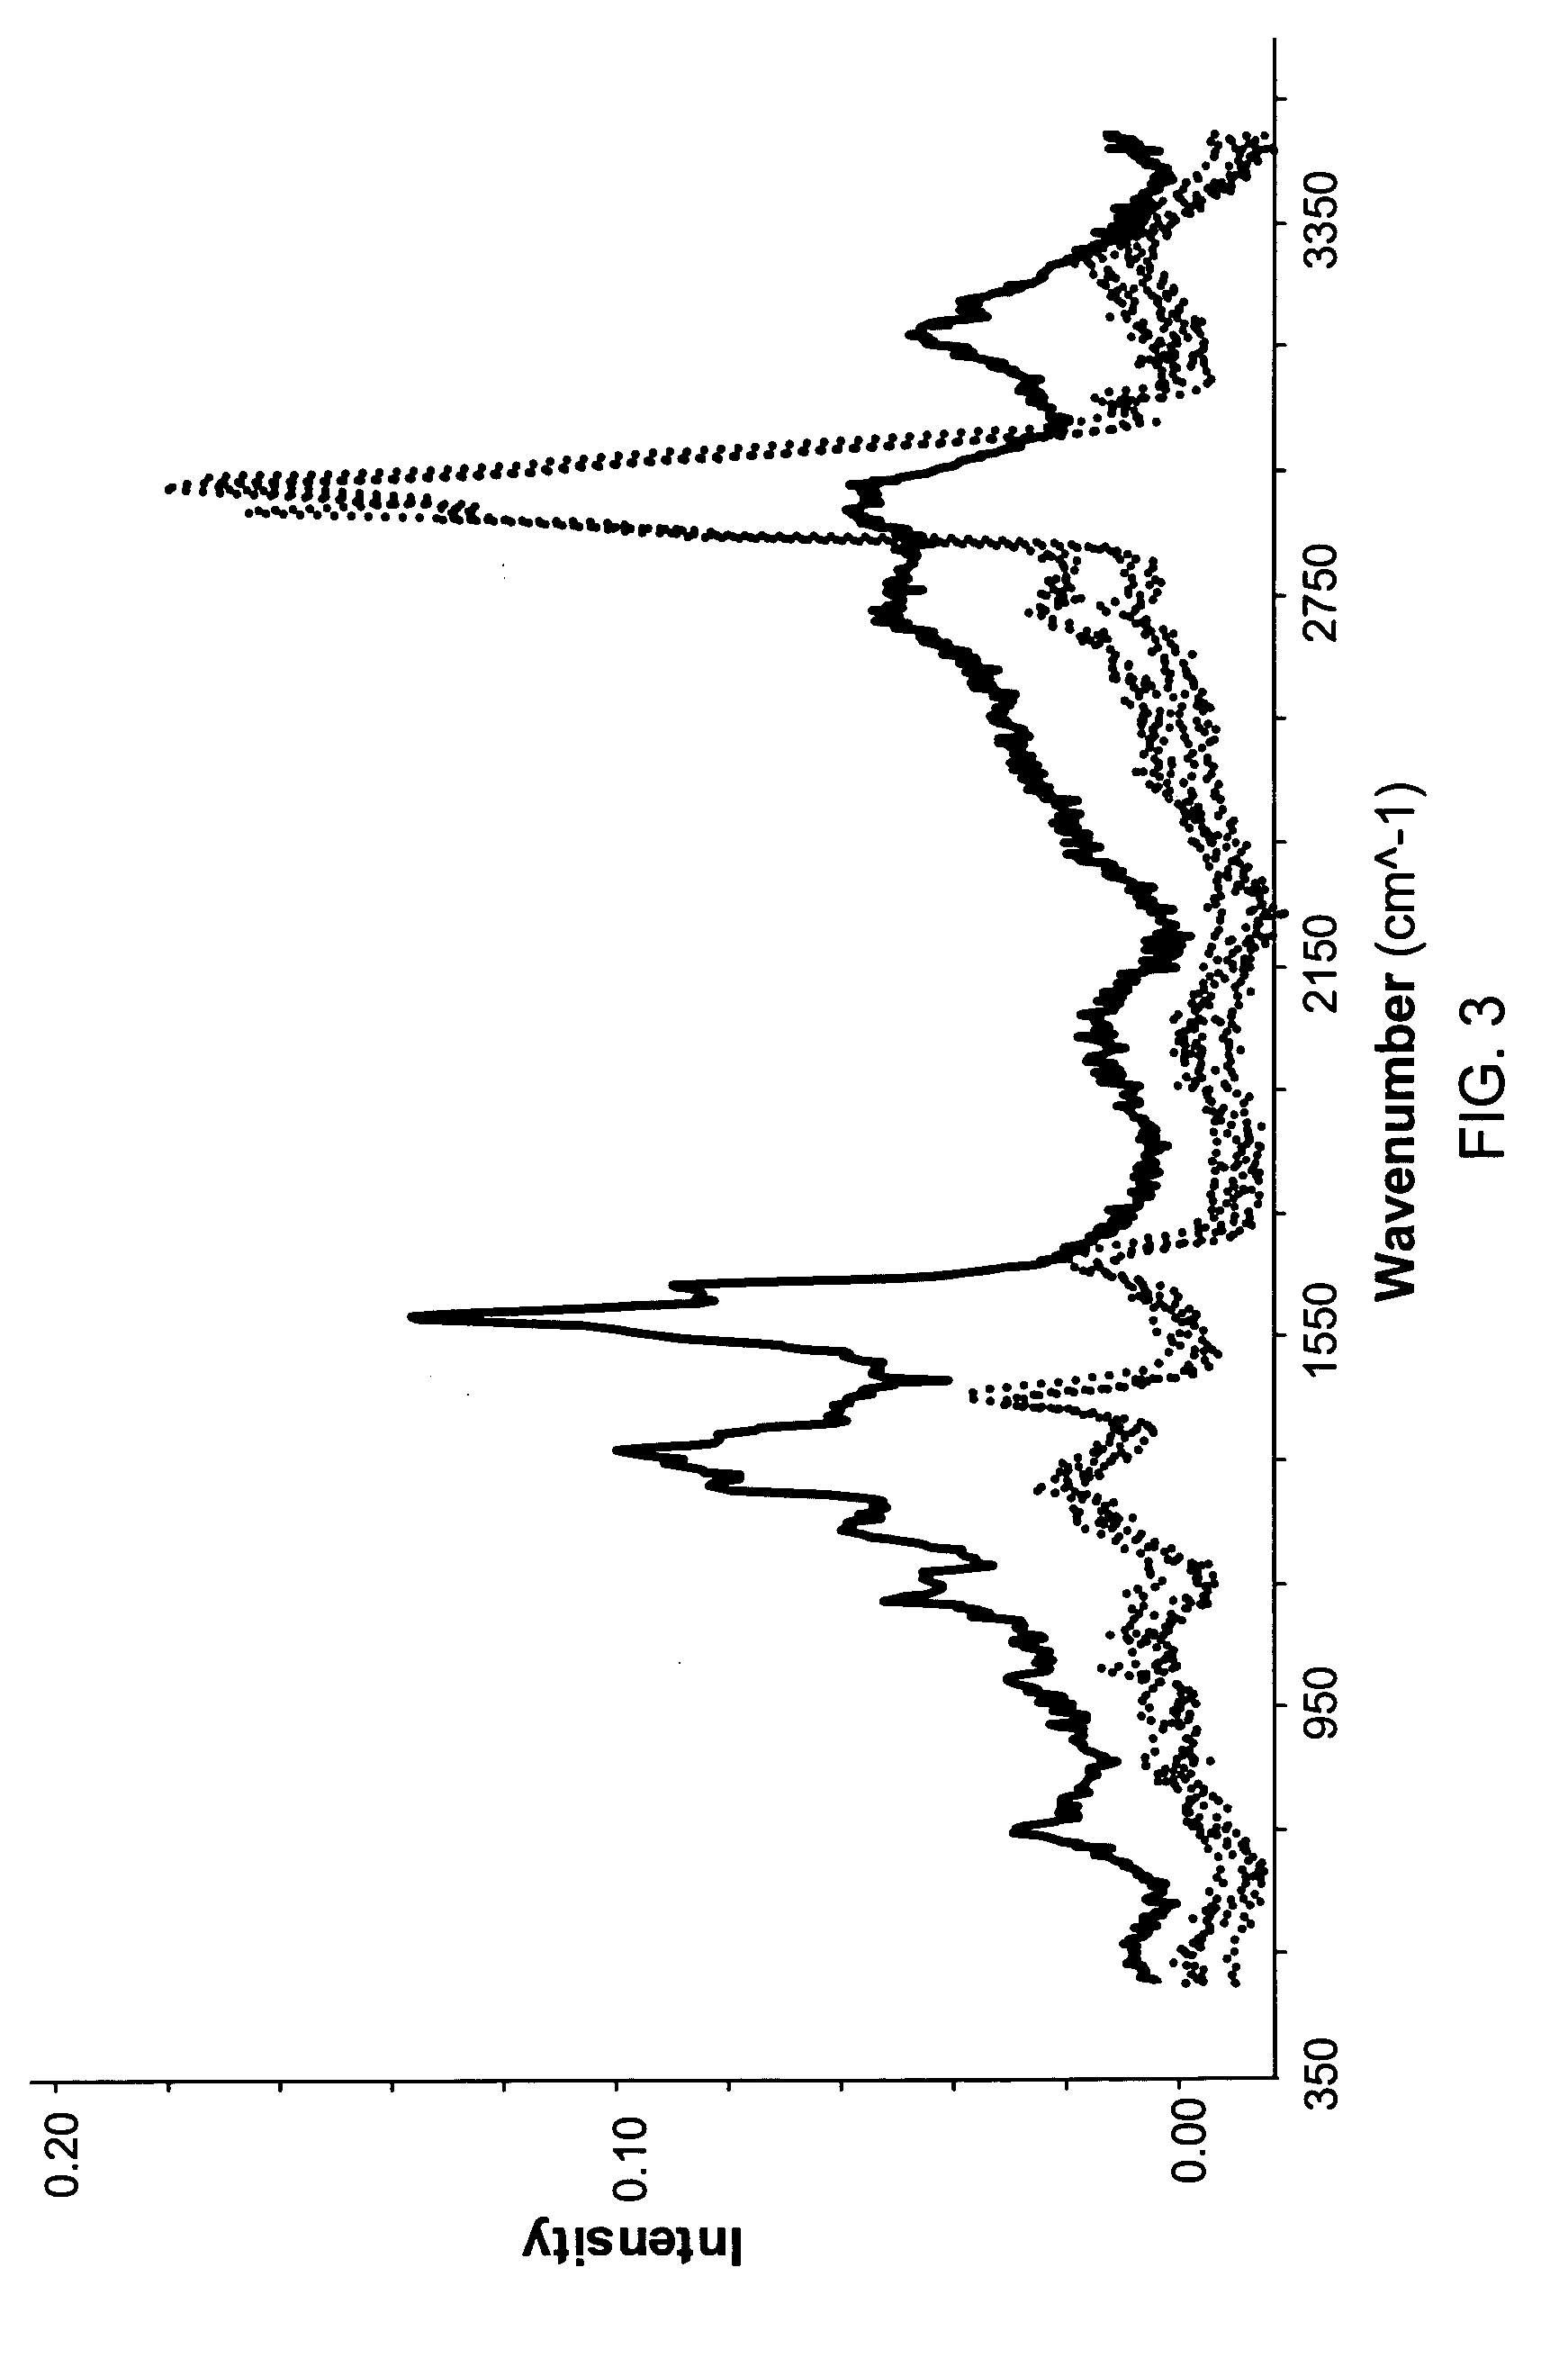
[0093] Raman molecular imaging (RMI) was used to distinguish cancerous and non-cancerous bladder cancer cells to demonstrate that RMI is useful for detection of bladder cancer.

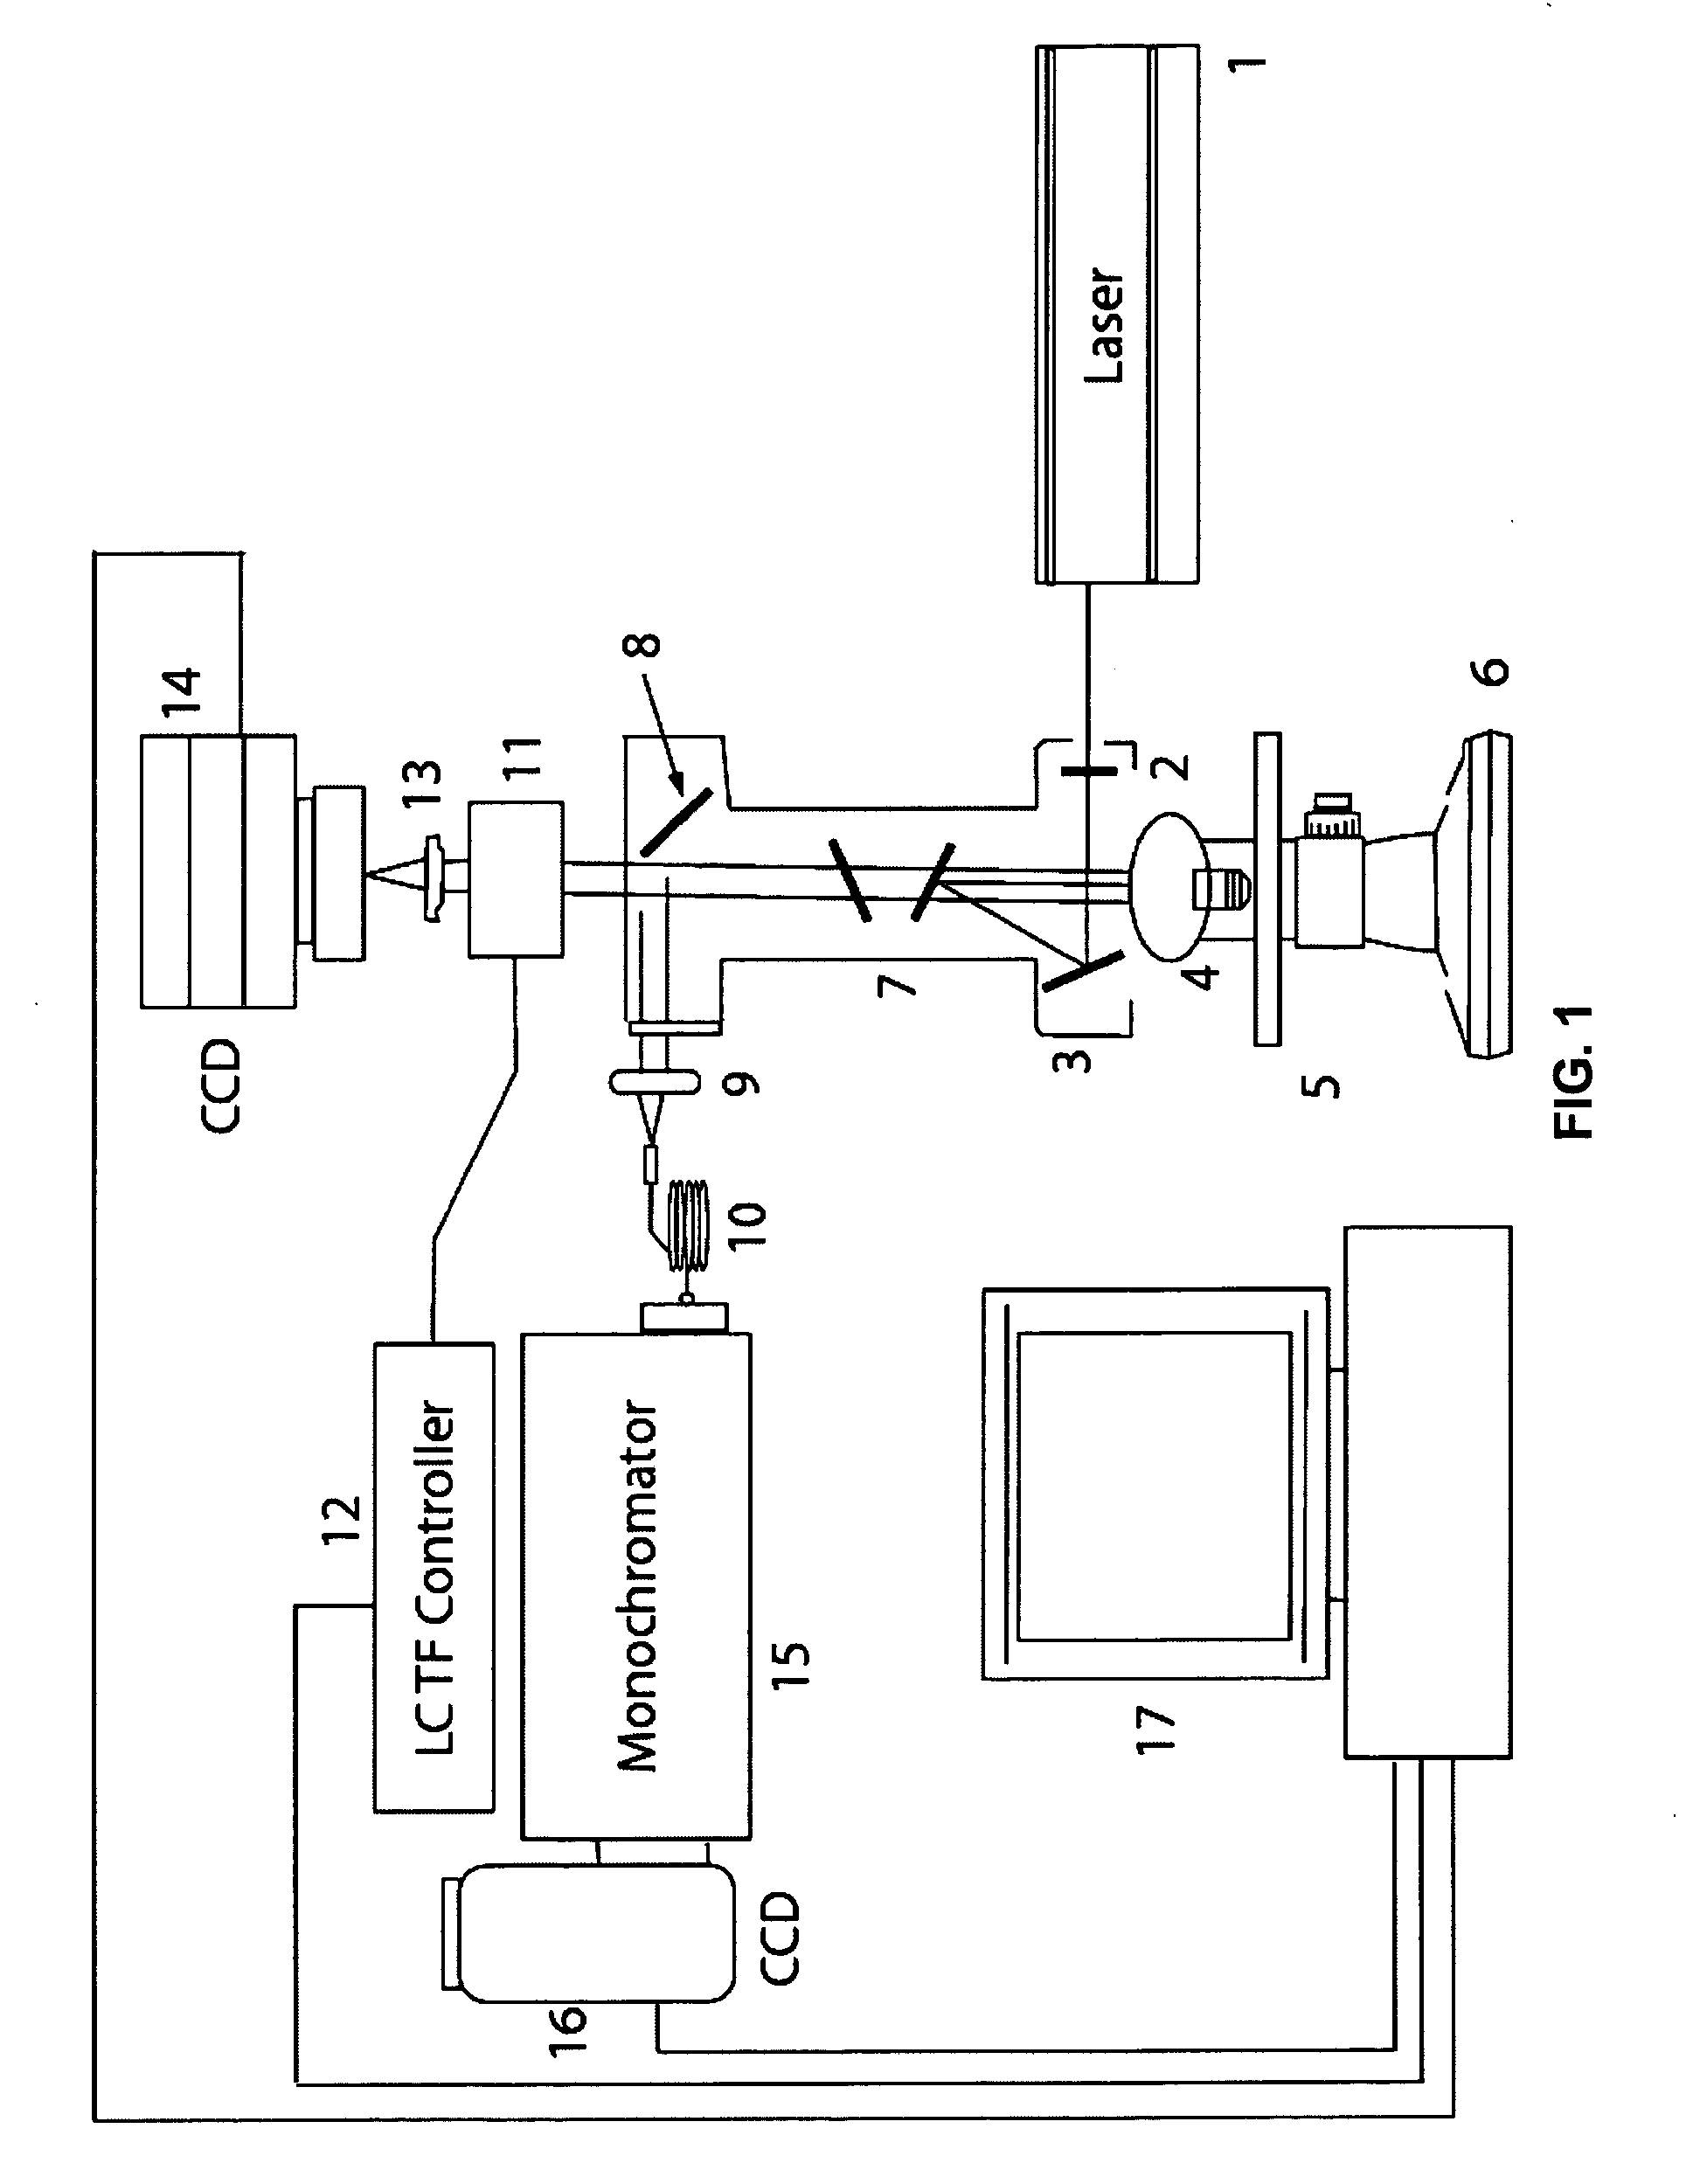
[0094] RMI is an innovative technology that combines the molecular chemical analysis capacity of Raman spectroscopy with the power of high definition digital image microscopic visualization. This platform enables physicians and their assistants to identify both the physical architecture and molecular environment of cells in a urine sample and can complement, or even replace, current histopathological methods.

[0095] The data presented in this example demonstrate that the Raman scattering signal from bladder cancer tissue ...


PUM

PropertyMeasurementUnit
wavelengthaaaaaaaaaa
Raman shiftaaaaaaaaaa

Abstract

Raman molecular imaging is used to differentiate between normal tissue and benign and malignant lesions of bladder and other tissues, including epithelial tissues such as lung, prostate, kidney, breast, and colon, and non-epithelial tissues, such as bone marrow and brain. Raman scattering data relevant to the cancerous state of cells can be combined with visual image data to produce hybrid images which depict both a magnified view of the cellular structures and information relating to the cancerous state of the individual cells in the field of view.

Description

CROSS-REFERENCES TO RELATED APPLICATIONS [0001] This application is entitled to priority pursuant to 35 U.S.C. §119(e) to U.S. provisional patent application 60 / 568,357, which was filed on 5 May 2004.BACKGROUND OF THE INVENTION [0002] The invention relates generally to the field of Raman spectroscopy and mammalian cellular evaluation, including correlation of cellular physiological status and diagnosis of cancer based on such evaluation. [0003] Cancer Diagnosis [0004] Cancer is the second leading cause of death in the United States, with more than 1.2 million new cancers being diagnosed annually. Cancer is significant, not only in terms of mortality and morbidity, but also in terms of the cost of treating advanced cancers and the reduced productivity and quality of life achieved by advanced cancer patients. Despite the common conception of cancers as incurable diseases, many cancers can be alleviated, slowed, or even cured if timely medical intervention can be administered. A widely...

Claims


Application Information

Patent Timeline
Patent Type & Authority Applications(United States)
IPC IPC(8): A61B5/00C12Q1/00G01N21/65G01N33/574
CPCA61B5/0059A61B5/202A61B5/415A61B5/417G01N2021/656G01N21/65G01N21/658G01N33/57407A61B5/418
Inventor MAIER, JOHN S.SHAPIRO, AMOSCOHEN, JEFFREY K.
Owner CHEMIMAGE
Why Eureka
Try Eureka