Ion channel modulating activity II
a technology of ion channel and activity, applied in the field of ion channel modulating compounds, can solve the problems of sudden death and complex treatment of arrhythmias, and achieve the effects of prolonging qt interval, prolonging qt interval, and reducing/or eliminating the prolongation of qt interval
- Summary
- Abstract
- Description
- Claims
- Application Information
AI Technical Summary
Benefits of technology
Problems solved by technology
Method used
Image
Examples
example 1
An Example of a Compound Showing a Rate-Dependent Inhibition of INA
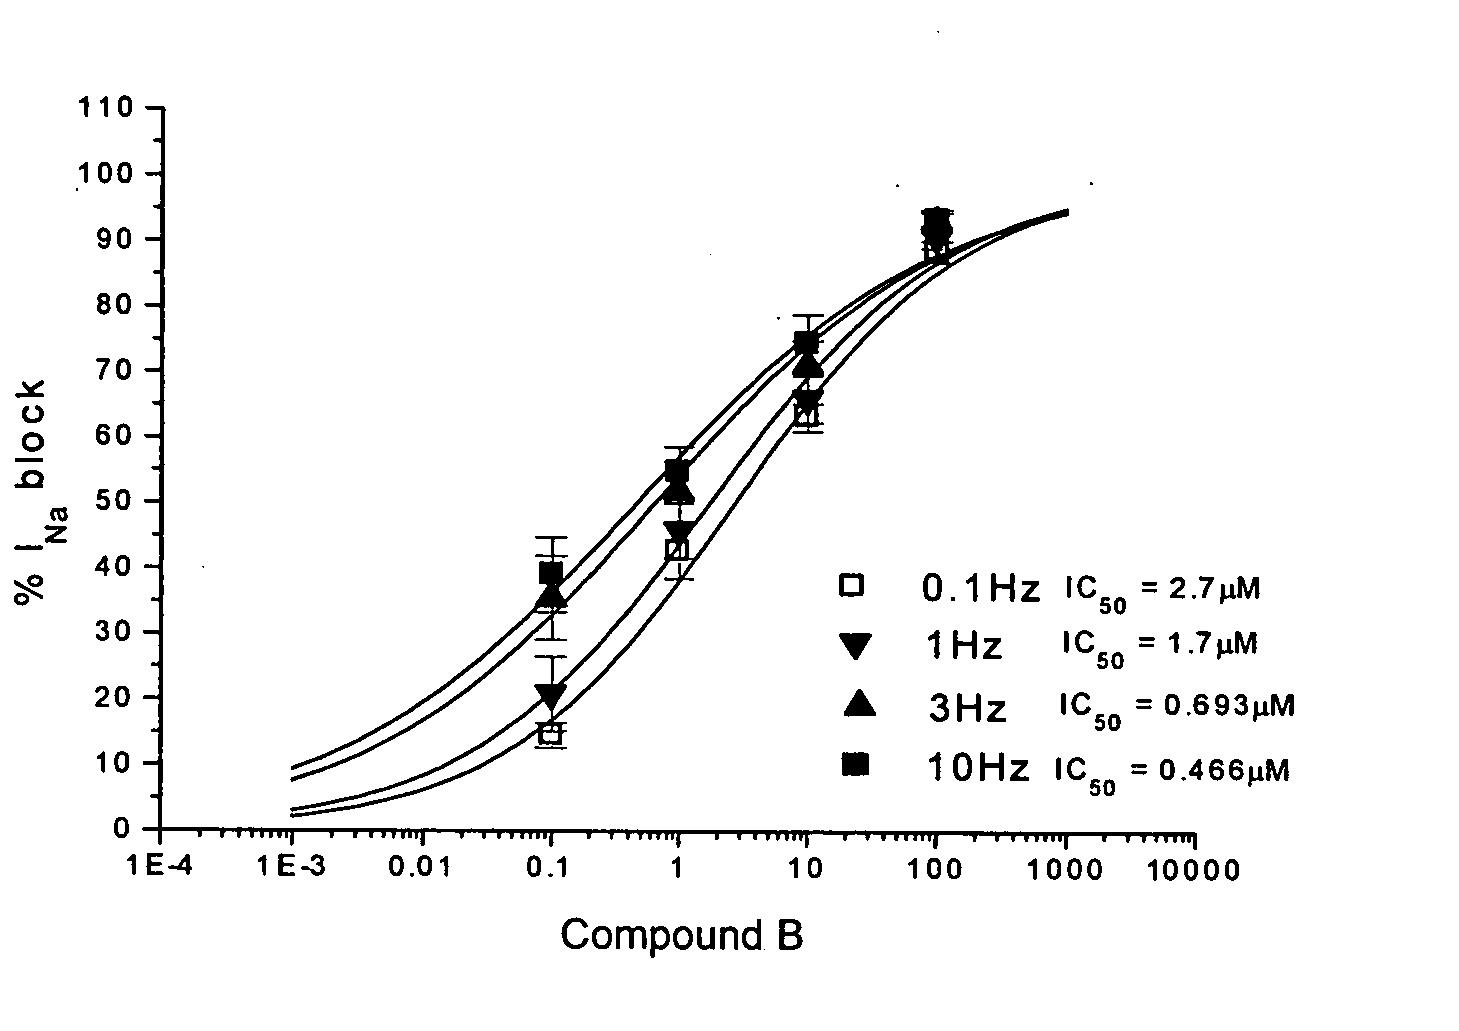
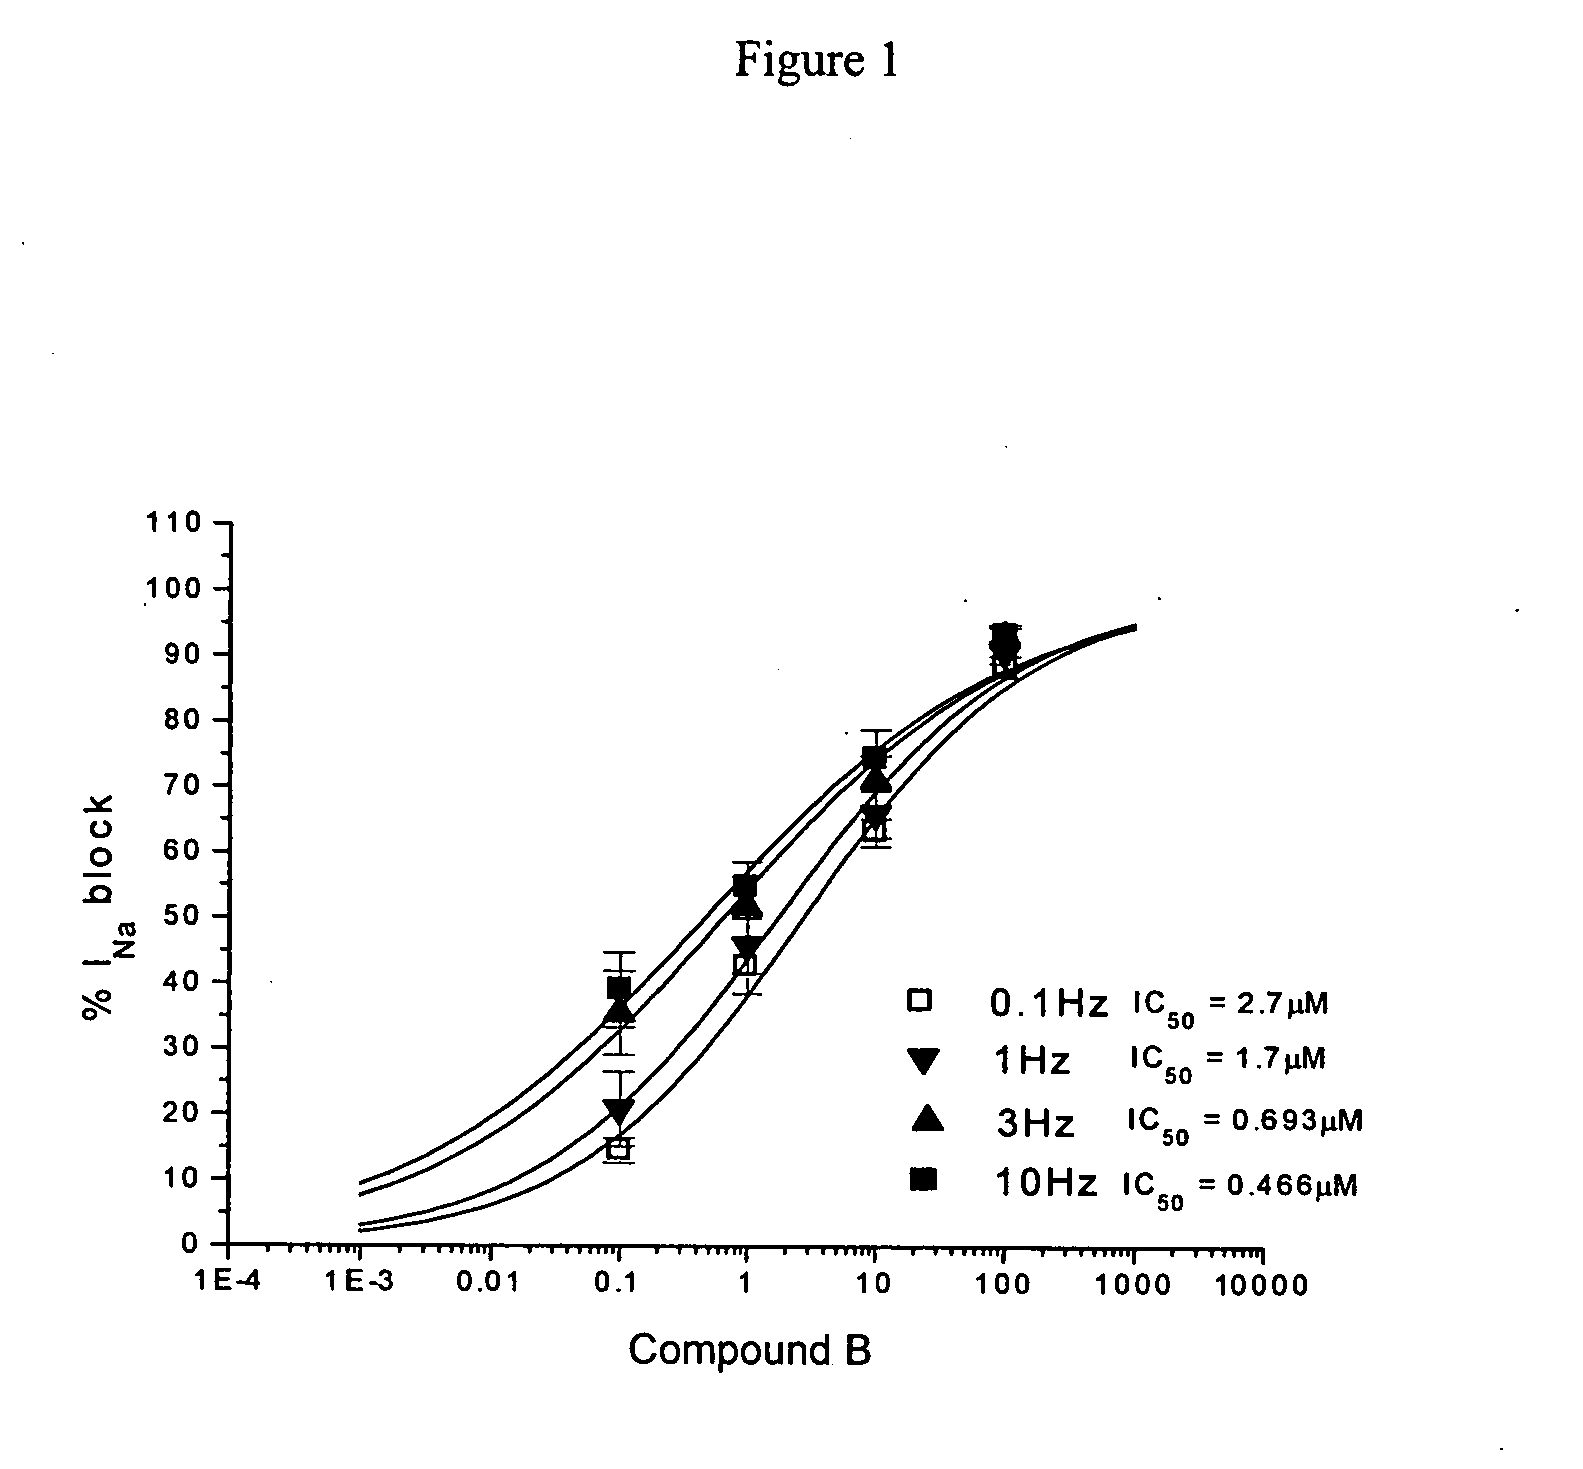
[0542]FIG. 1 shows a rate- and concentration-dependent inhibition of sodium current (INa) in human atrial myocytes by COMPOUND B. Human myocytes were obtained from specimens of human right atrial appendage obtained during surgery from hearts of patients undergoing cardiopulmonary bypass. Cells were isolated and whole-cell voltage-clamped. Experiments were performed at 22±1° C. INa was elicited by a pulse to −20 mV from a holding potential of −70 mV (pulse duration was 40 ms. Peak inward current was measured in control and in the presence of 0.1, 1, 10, and 100 μM COMPOUND B. Symbols are mean±SE (n=4) and data was fit with a Hill equation.
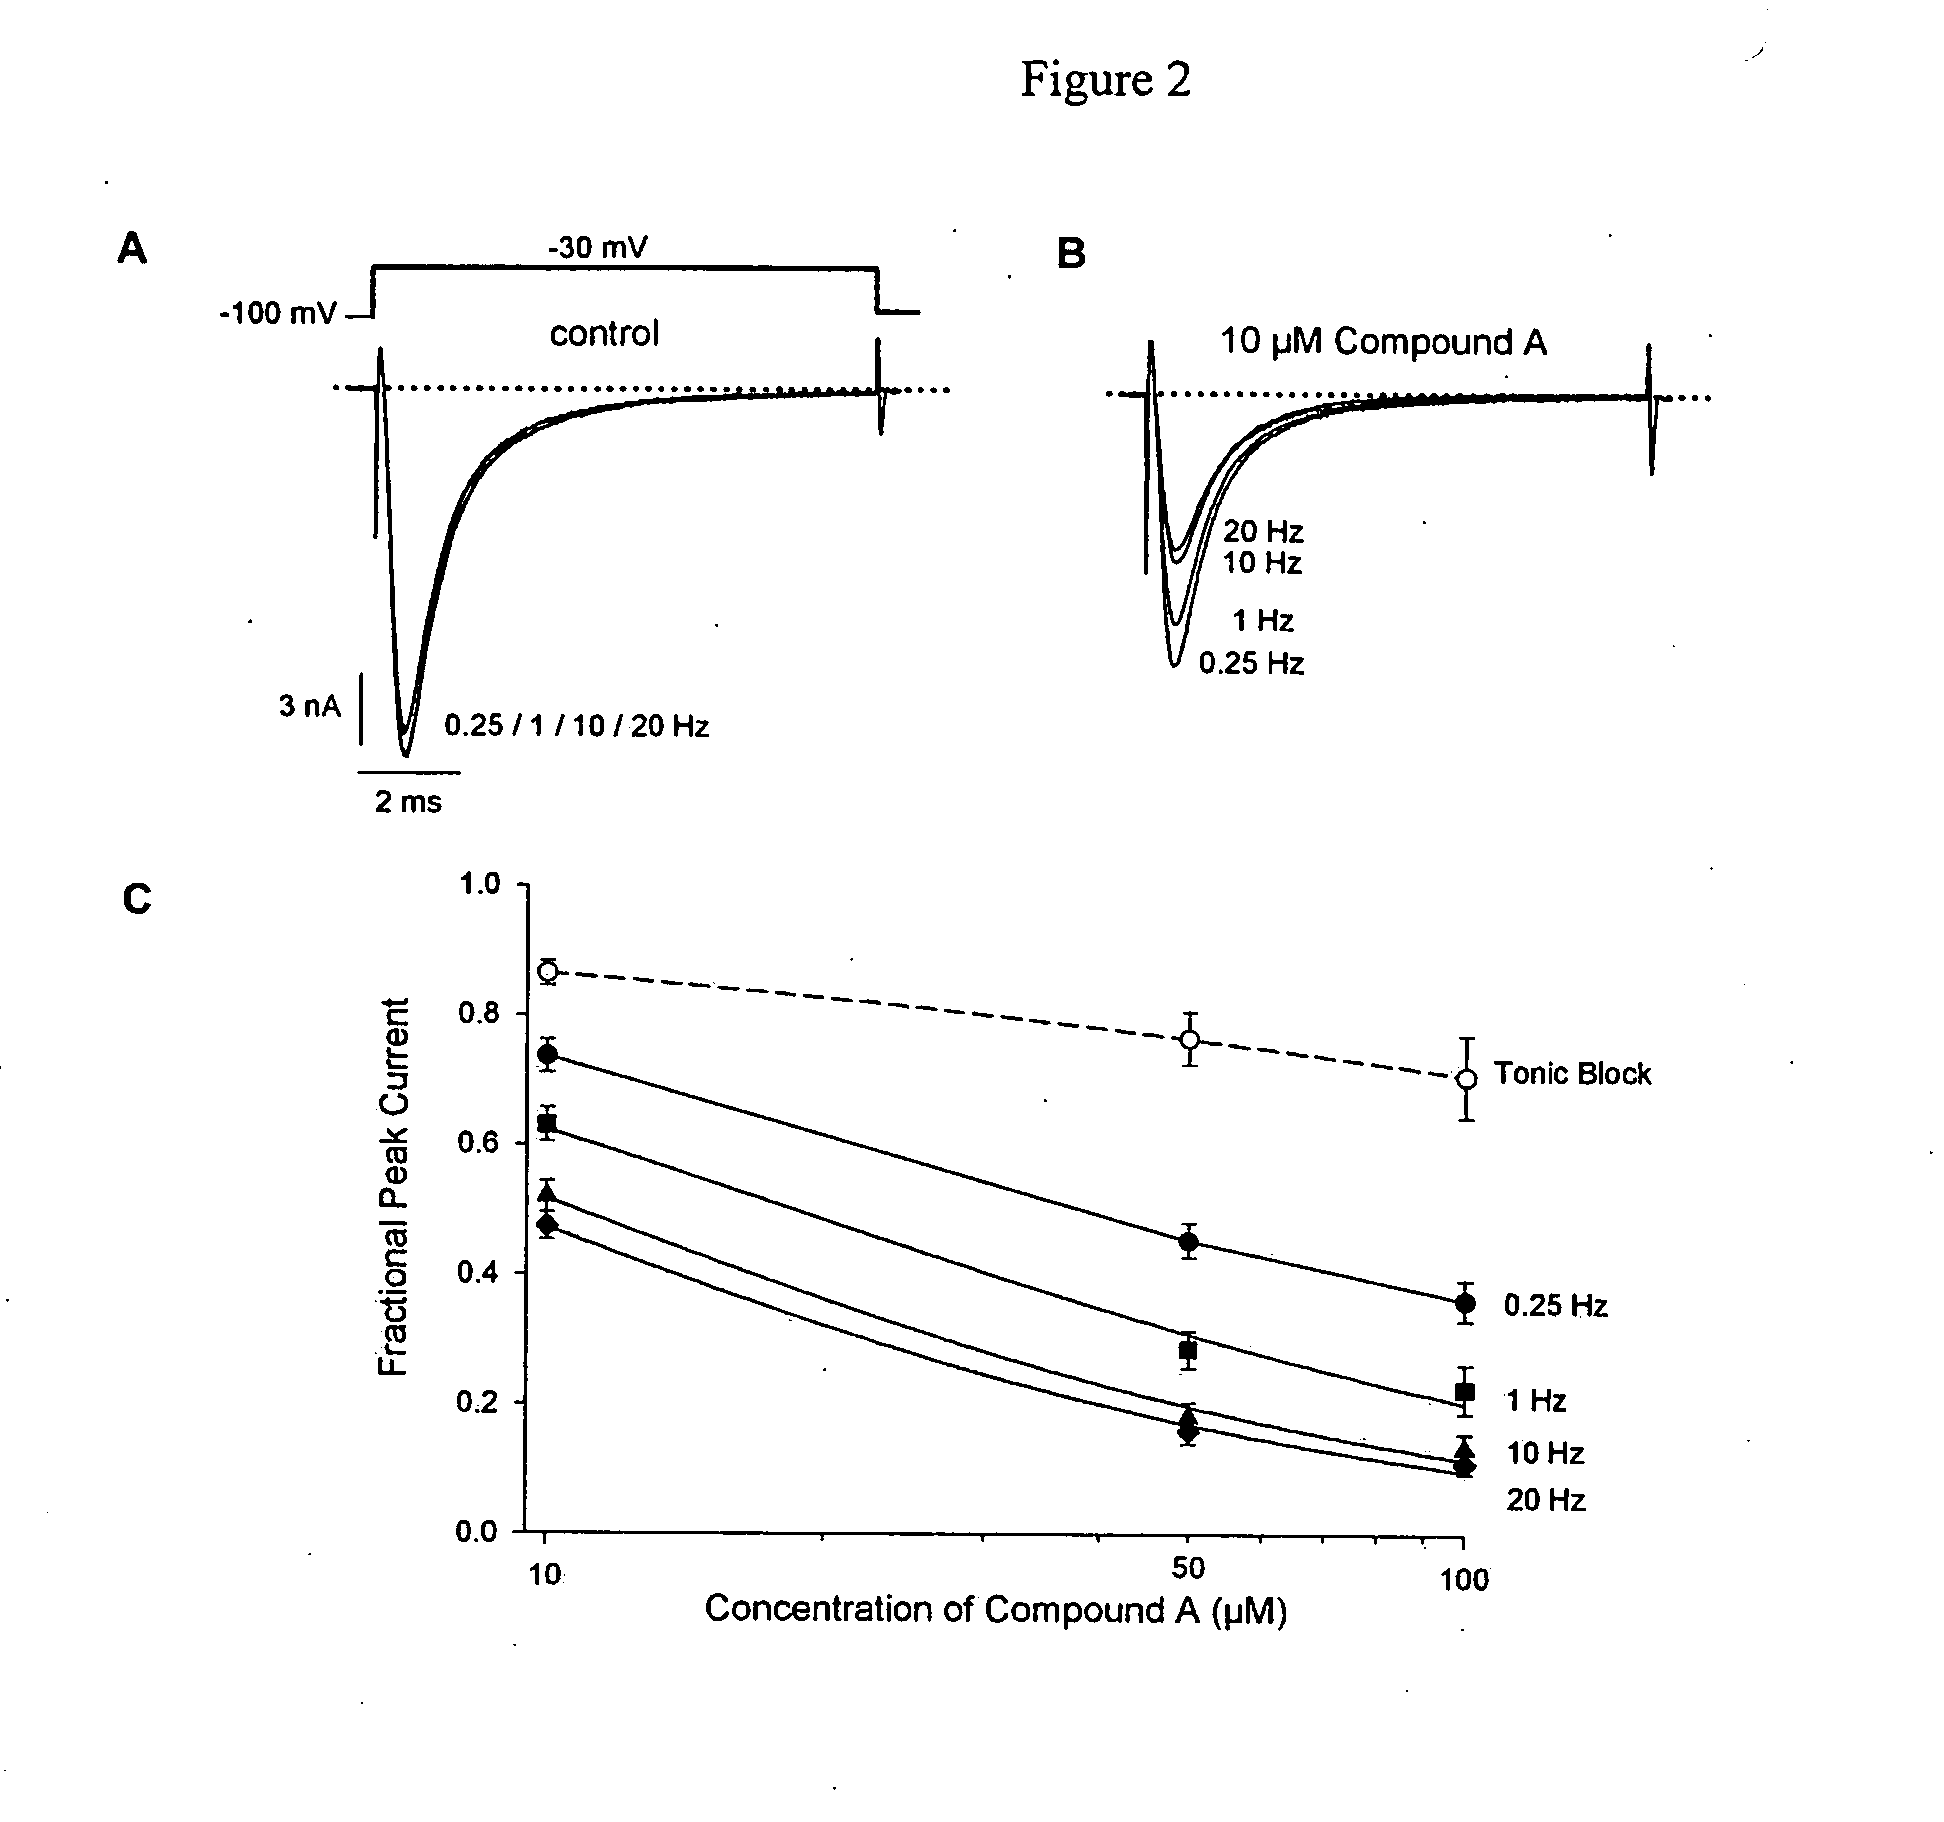
[0543] A second example used HEK293 cells stably expressing human heart (hH1) sodium channels that were whole-cell patch clamped to measure currents. Concentration and rate-dependent inhibition of hH1 channels by COMPOUND A was tested by applying depolarizing pulses at 0.25, 1, 10,...
example 2
An Example Showing a Minimal Effect on Cardiac QRS Duration in Human Volunteers is shown by the table below:
[0546]
EFFECT OF COMPOUND A ON QRS DURATION IN HUMAN VOLUNTEERS(10 MIN AFTER INFUSION)SummaryMeasurementStatistic0.1 mg / kg0.25 mg / kg0.5 mg / kg1.0 mg / kg2.0 mg / kg4.0 mg / kg5.0 mg / kgPlaceboQRS (ms)Mean89.089.085.389.893.897.594.391.0S.D...4.25.29.81.76.35.1
example 3
An Example Showing a Voltage-Dependent Inhibition of Sodium Channels
[0547]FIG. 3 shows a voltage-dependent block of hH1 by COMPOUND A. Panel A shows a single experiment for which hH1 current amplitude is plotted for each recorded trace in response to escalating concentrations of Compound A when pulsed from a holding potential of −100 mV. Dose-response curves (FIG. 3, panel B) show that at holding potentials of −60 mV, −80 mV, −100 mV, and −120 mV the IC50 values were 31±1 μM (Hill coefficient=0.92±0.06; n=5), 43±8 μM (Hill coefficient=0.98±0.03; n=5), 60±4 μM (Hill coefficient=0.85±0.06; n=3) and 107±11 μM (Hill coefficient=0.89±0.03; n=3). Cells were held at either −120 mV, −100 mV, −80 mV, and −60 mV and stepped to −30 mV for 6 ms (1 Hz). Cells held at −60, −80 and −100 mV received a 2 ms pulse to −120 mV to relieve channel inactivation prior to the −30 mV step.
PUM
| Property | Measurement | Unit |
|---|---|---|
| pKa | aaaaa | aaaaa |
| pKa | aaaaa | aaaaa |
| frequency | aaaaa | aaaaa |
Abstract
Description
Claims
Application Information
 - R&D
- Intellectual Property
- Life Sciences
- Materials
- Tech Scout
- Unparalleled Data Quality
- Higher Quality Content
- 60% Fewer Hallucinations
Browse by: Latest US Patents, China's latest patents, Technical Efficacy Thesaurus, Application Domain, Technology Topic, Popular Technical Reports.
© 2025 PatSnap. All rights reserved.Legal|Privacy policy|Modern Slavery Act Transparency Statement|Sitemap|About US| Contact US: help@patsnap.com


