
Method and algorithm for quantifying polynucleotides

a polynucleotide and quantification algorithm technology, applied in the biochemical field, can solve the problems of uncertainty in the final quantitative result generated by some algorithms, the quantitative ability of some prior methods for analyzing results from real-time nucleic acid amplification reactions is compromised at very low target levels,

Active Publication Date: 2006-12-28
GEN PROBE INC
View PDF7 Cites 65 Cited by
  • Summary
  • Abstract
  • Description
  • Claims
  • Application Information

AI Technical Summary

Benefits of technology

[0036] By “consisting essentially of” is meant that additional component(s), composition(s) or method step(s) that do not materially change the basic and novel characteristics of the present invention may be i

Problems solved by technology

Unfortunately, the quantitative abilities of some prior methods for analyzing results from real-time nucleic acid amplification reactions are compromised at very low target levels (i.e., less than about 100 copies / reaction).
Stated differently, the kinetics of amplification in reactions conducted using very low template levels exhibit noticeable fluctuation, and this fluctuation leads to uncertainty in the final quantitative result generated by some algorithms.

Method used


Image

  • Method and algorithm for quantifying polynucleotides
  • Method and algorithm for quantifying polynucleotides
  • Method and algorithm for quantifying polynucleotides

Examples


example 1

Application of the Vector-Based Analytical Method Using Directionally Similar Vectors

[0111] A series of TMA reactions were performed using from 5×101 to 5×10⁵ copies of an HIV-1 subtype B analyte RNA, and a molecular torch specific for the amplicon. Fluorescence signals indicating amplicon synthesis were monitored as a function of time, and the results plotted on the graph shown in FIG. 7. In this procedure, fluorescence readings indicative of the amount of amplicon present in the amplification reaction mixture were taken every 19.4 seconds, approximately. The result set represented in the figure was processed using the disclosed algorithm employing directionally similar vectors under different conditions of data smoothing.

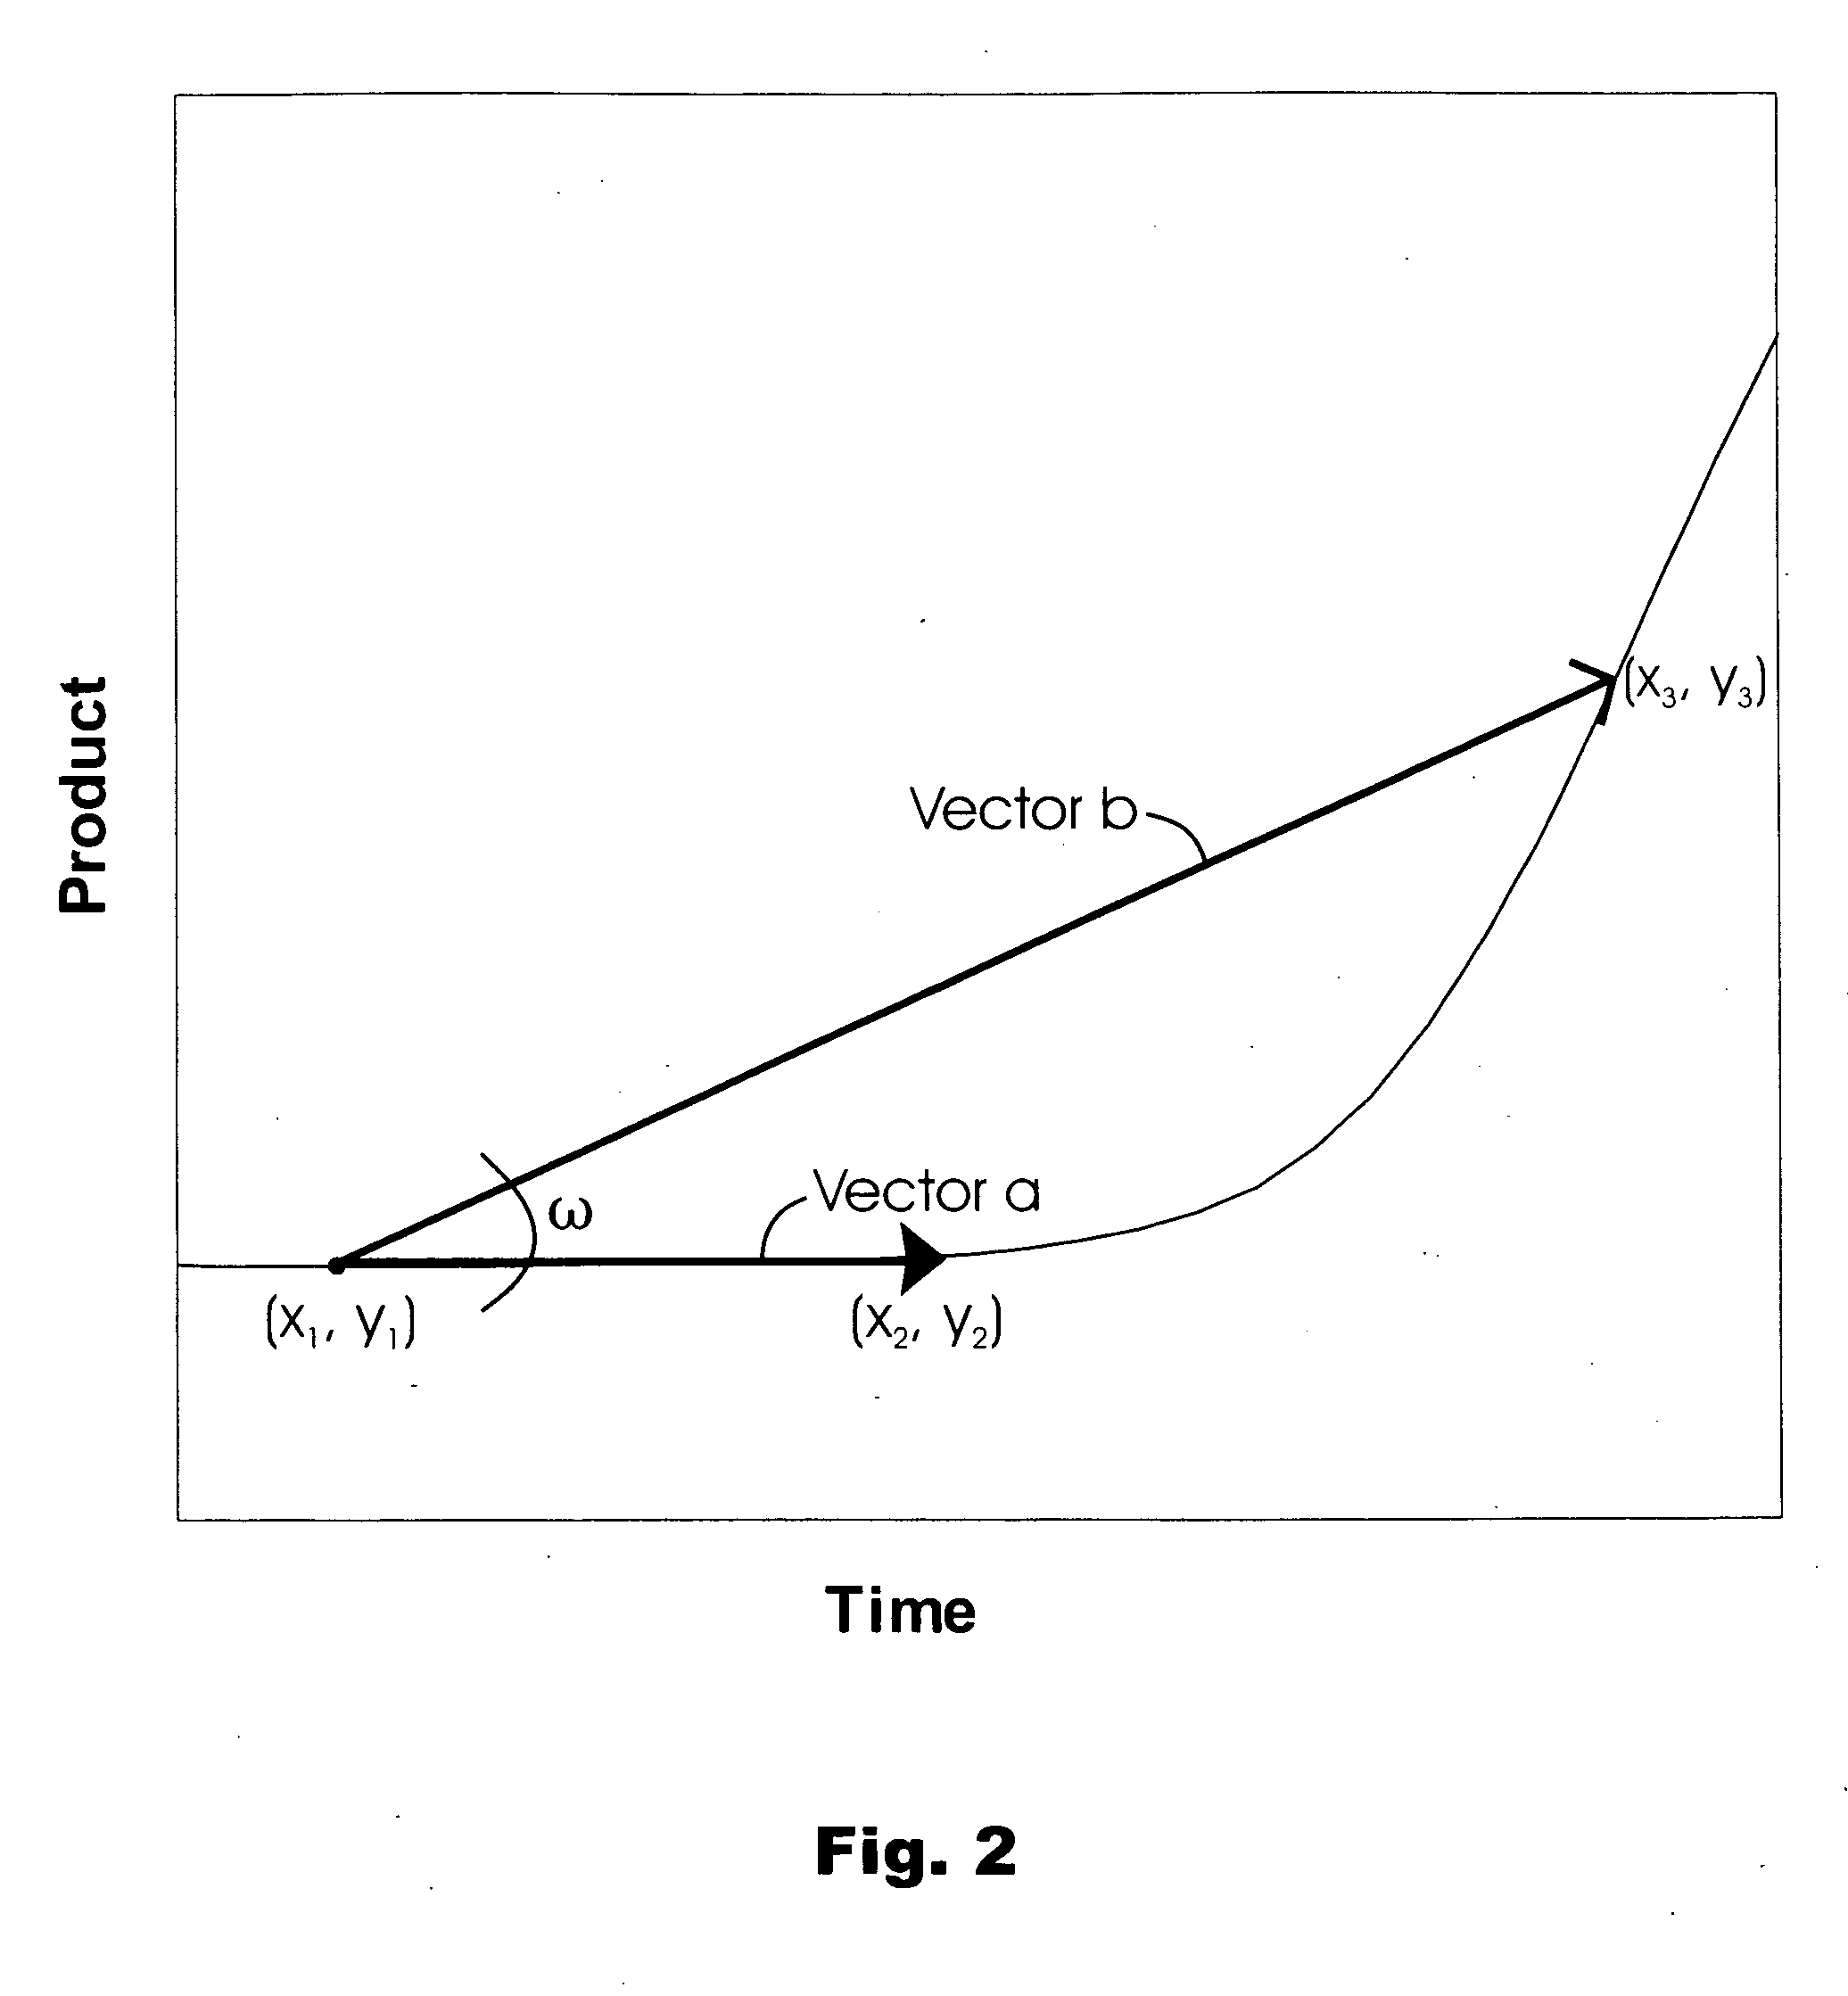
[0112] The vector-based algorithm employed in these analyses involved establishing paired sets of vectors, with each vector of a set sharing a common origin along the data points represented on a growth curve. The vectors within a set had different x-component m...

example 2

Application of the Vector-Based Analytical Method Using Directionally Opposed Vectors

[0126] A single set of results from time-dependent monitoring of nucleic acid amplification reactions were processed in parallel using a computer running a program to execute independent algorithms employing directionally similar vectors, or directionally opposed vectors. TMA reactions that amplified an HIV-1 analyte polynucleotides were carried out using analyte polynucleotide amounts that ranged from 0-5×10⁵ copies / reaction. All reactions included a fluorescently labeled molecular torch hybridization probe specific for the HIV-1 amplicon. Fluorescence readings indicating the amounts of amplicon present in the reactions were recorded every 19.4 seconds, approximately. The numerical results from the amplification reactions were processed for smoothing by a four-point curve fit using the above-described Model A (equation (3)). Initial estimates for the different variables are given above in connecti...


PUM

PropertyMeasurementUnit
Timeaaaaaaaaaa
Timeaaaaaaaaaa
Timeaaaaaaaaaa

Abstract

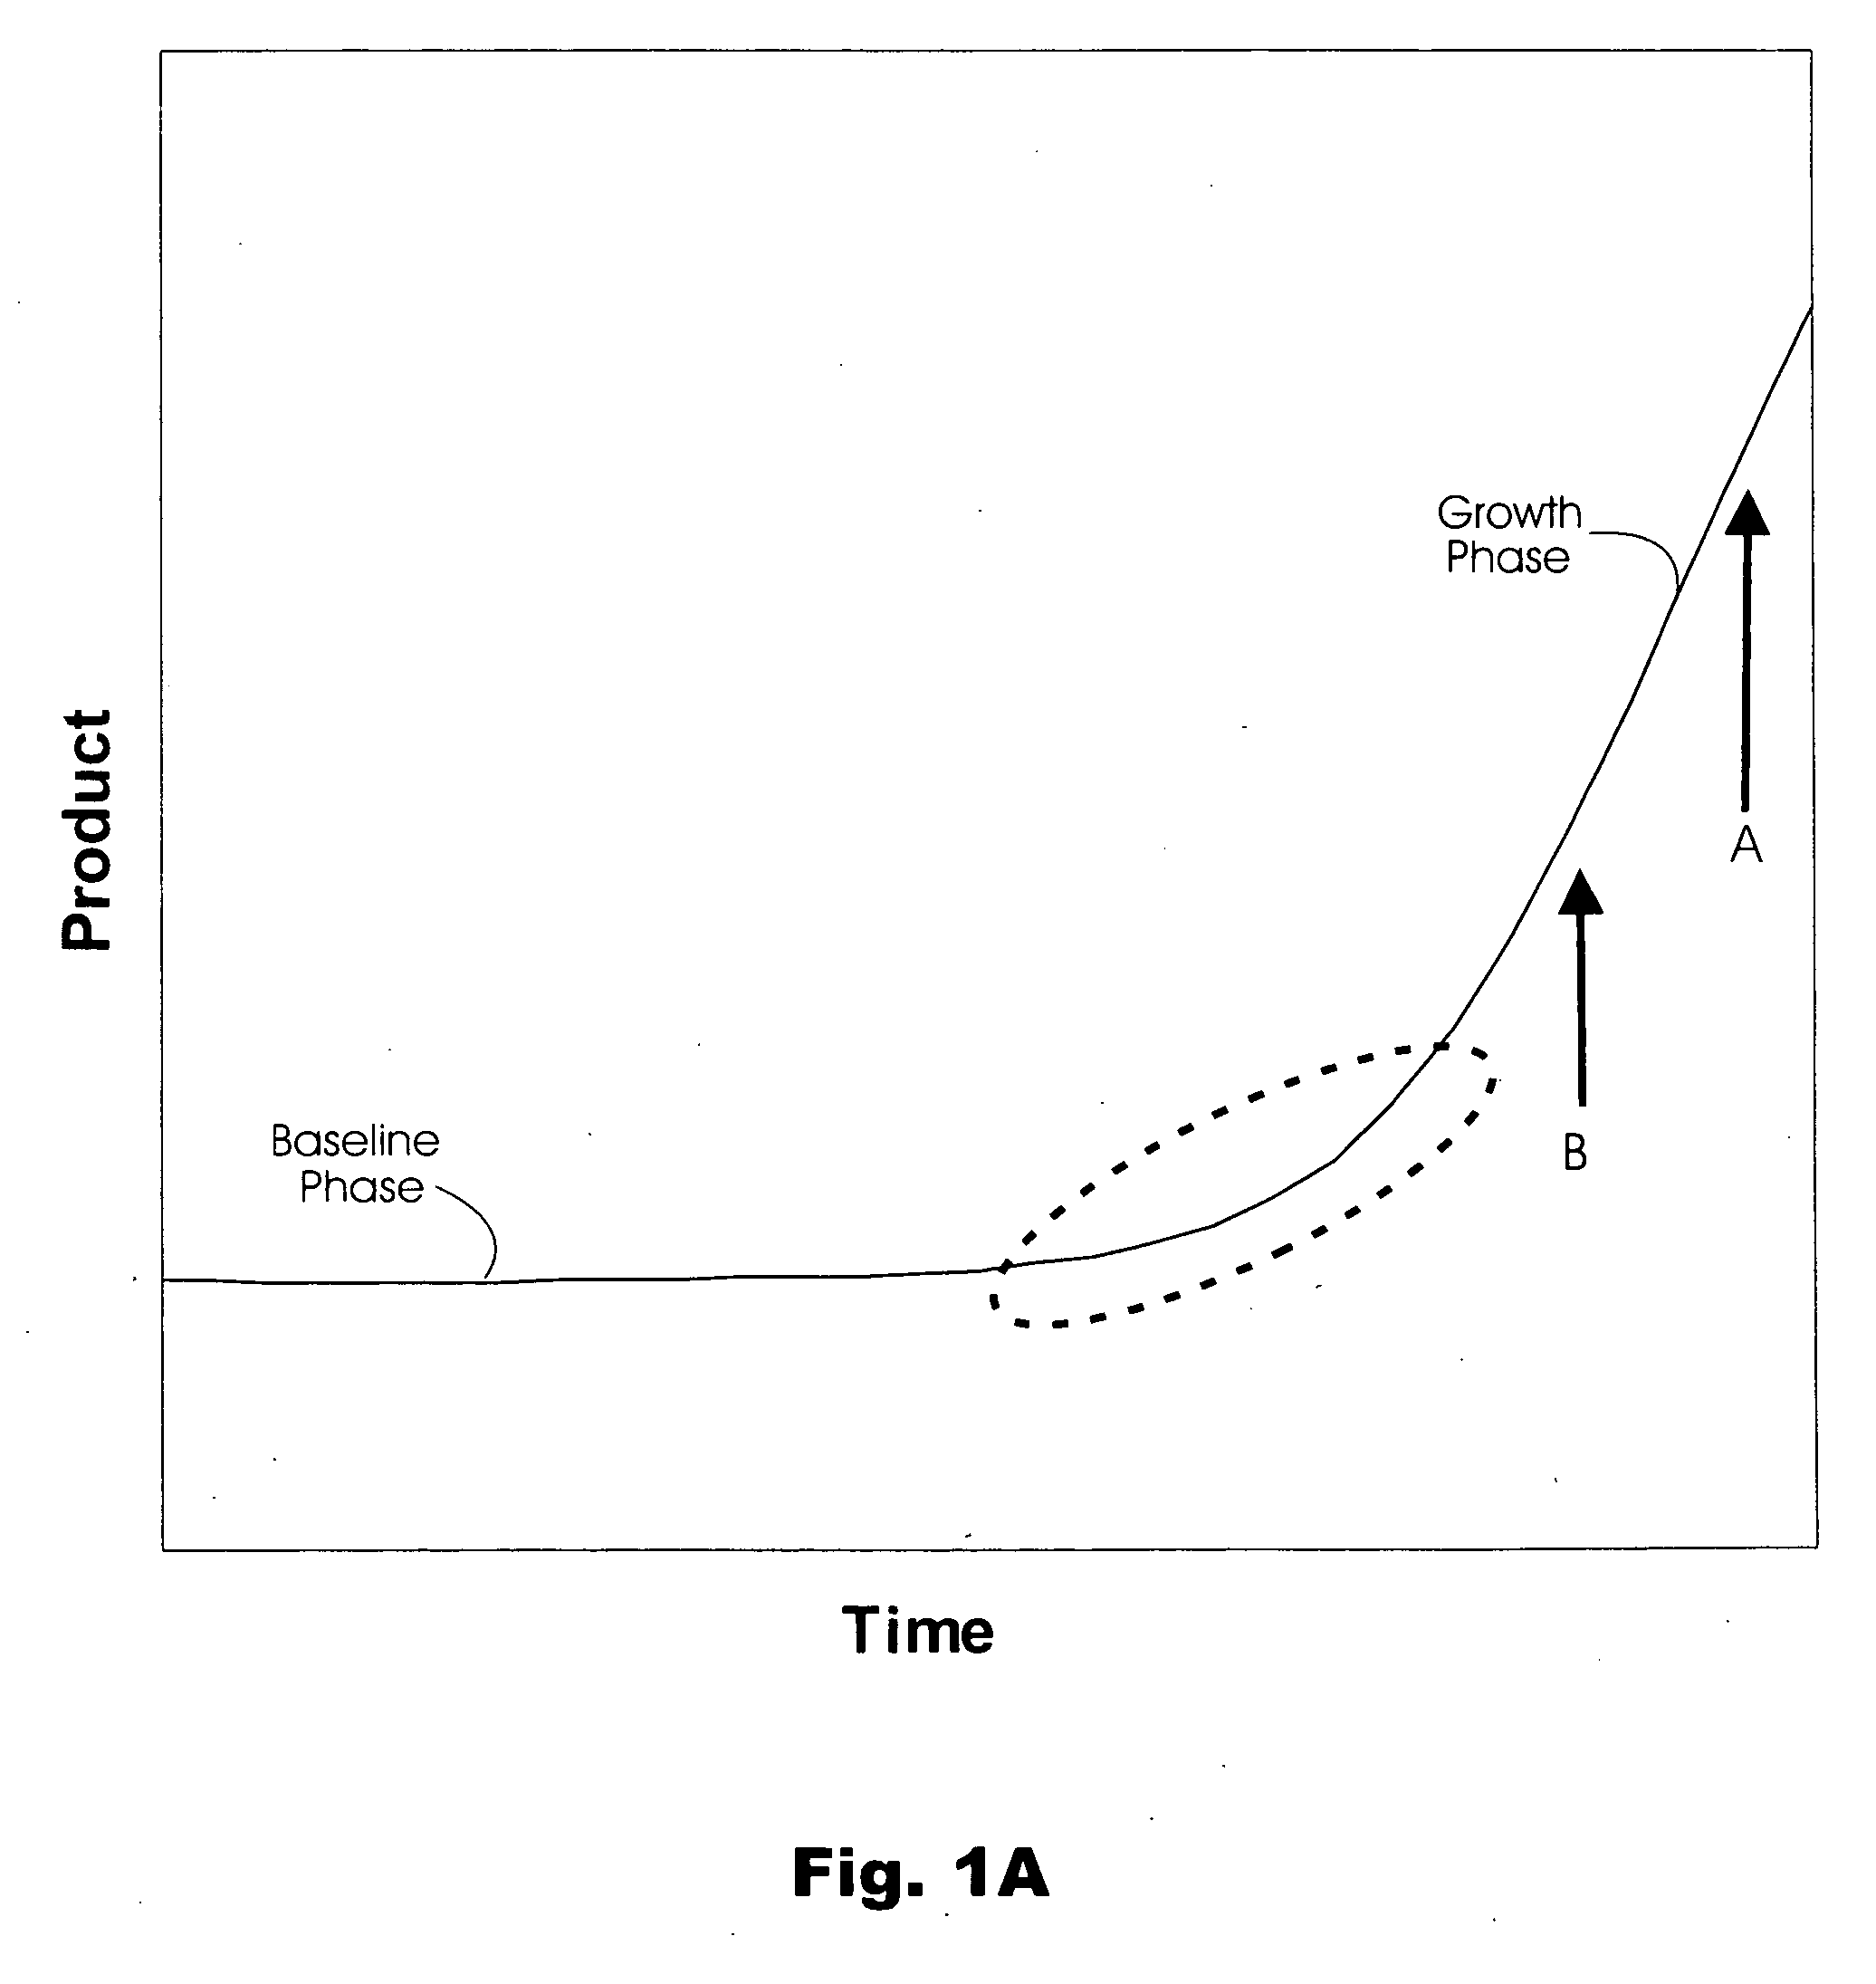
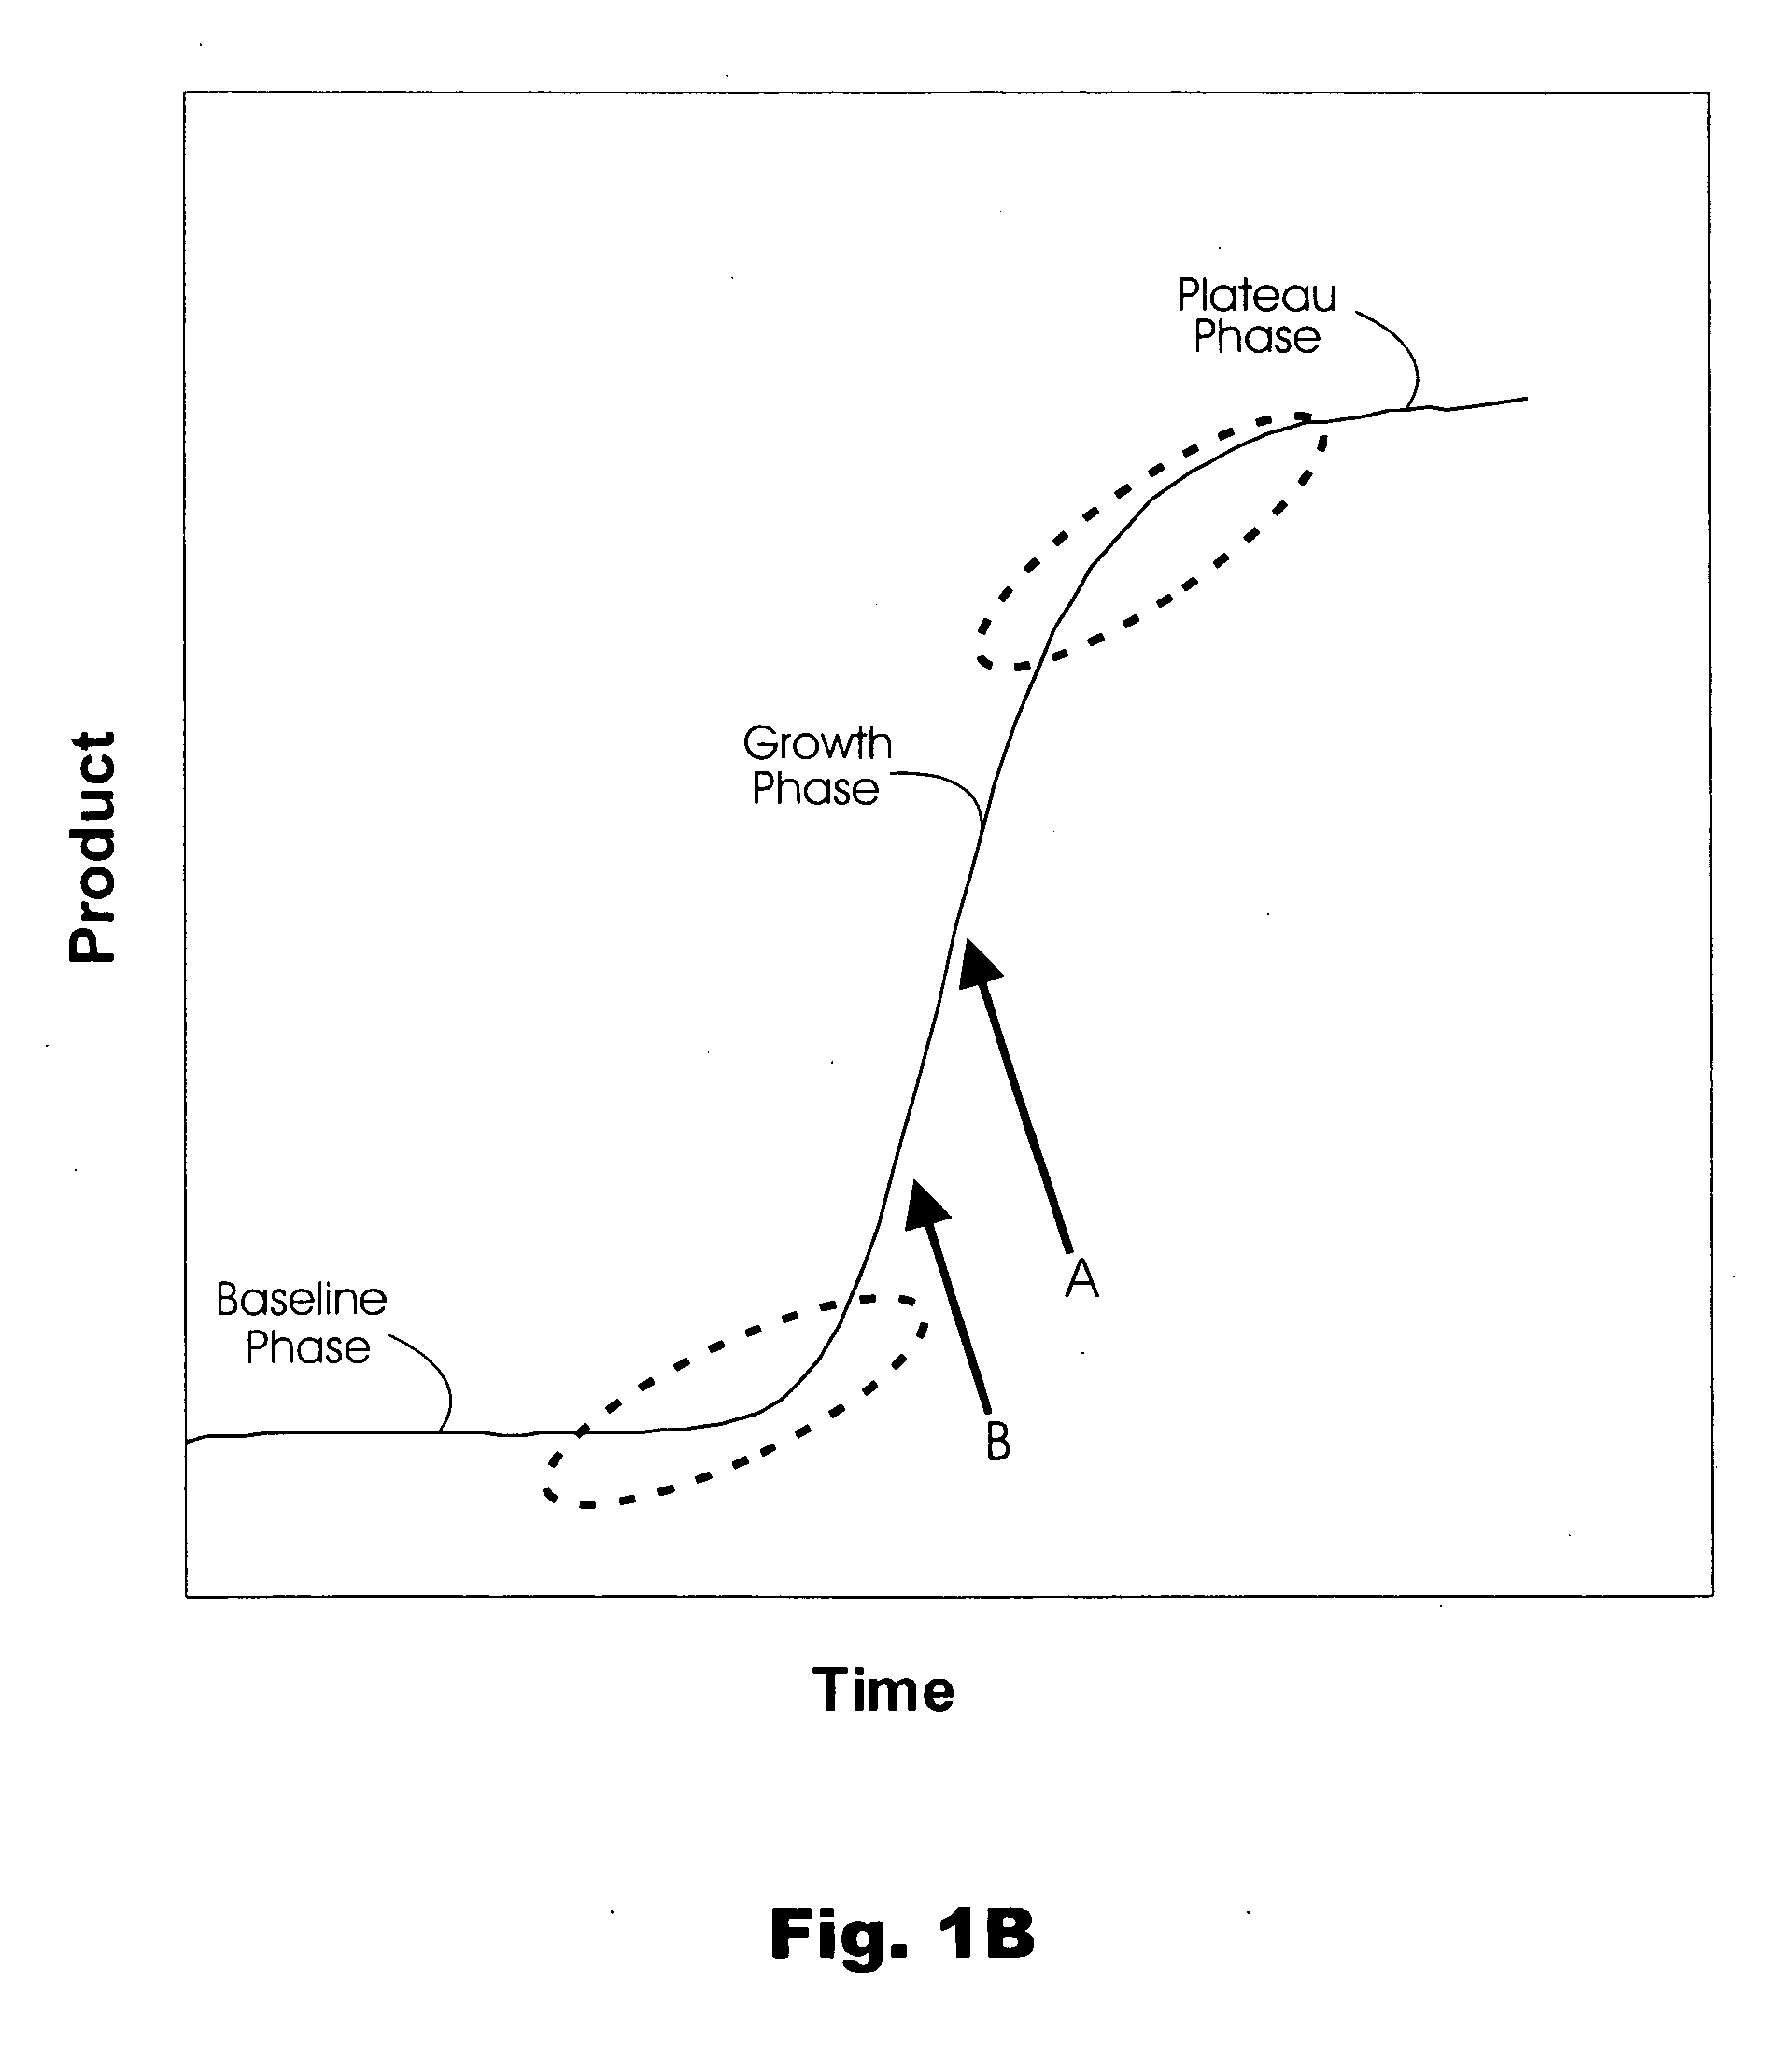
Machine executable method of analyzing growth curve data to identify the transition from a baseline phase into a growth phase. Applications of the method include analysis of results from time-dependent monitoring of amplicon synthesis in a nucleic acid amplification reaction to quantify a starting amount of a nucleic acid template in a test sample. The method advantageously simplifies the quantitation by circumventing the need to establish thresholds used for calculating initiation of the growth phase, to calculate derivatives, or to perform linear regression analysis.

Description

RELATED APPLICATION [0001] This application claims the benefit of U.S. Provisional Application No. 60 / 693,455, filed Jun. 22, 2005. The entire disclosure of this prior application is hereby incorporated by reference.FIELD OF THE INVENTION [0002] The present invention relates to the field of biotechnology. More specifically, the invention relates to polynucleotide quantitation using real-time nucleic acid amplification. BACKGROUND OF THE INVENTION [0003] The subfield of molecular diagnostics which relates to nucleic acid quantitation has embraced kinetic analysis as a means for interpreting results from nucleic acid amplification reactions. In these procedures, sometimes referred to as “real-time” amplification procedures, the amount of amplicon present in a nucleic acid amplification reaction mixture is monitored as a function of time. Ideally, the result of this monitoring is a growth curve having a sigmoid shape, where an initial baseline phase is followed by a growth phase, which...

Claims


Application Information

Patent Timeline
IPC IPC(8): C12Q1/68G06F19/00G16B25/00
CPCC12Q1/6851G06F19/10G06K9/00127G06K9/00523C12Q2537/165G16B99/00G16B25/00G06F2218/08G06V20/69
Inventor CARRICK, JAMES M.CHISMAR, JEFFREY D.GILLY, MICHAEL J.
Owner GEN PROBE INC
Learn More