Mass analysis system

a mass analysis and mass technology, applied in the field of mass analysis system, can solve the problems of inability to label isotopically, inability to use methods for specimens, and inability to identify, etc., and achieve the effect of high speed and without wasting measurement tim

Inactive Publication Date: 2007-09-27
HITACHI LTD
View PDF9 Cites 7 Cited by
  • Summary
  • Abstract
  • Description
  • Claims
  • Application Information

AI Technical Summary

Benefits of technology

[0013]Thereby, high speed analysis of the mass spectrum (MSn) obtained by dissociating a target ion by an n-1 times and carrying out the mass analysis can be enabled within the real time of the measurement.
[0014]According to the present invention, a mass analysis apparatus capable of enabling the quantitative analysis of a minute fluctuation amount between the specimens desired by a user without wasting the measurement time can be realized.

Problems solved by technology

However, this method can hardly be used for a specimen, which cannot be labeled isotopically.
According to the method of carrying out the same as a post process after the analyses being finished, in the case of the quantitative evaluation of the fluctuation amount of a minute component in the specimen including a large amount of components, the following problems are involved.
Therefore, even in the case the kind of ions between two kinds of specimens is same but the amounts differ significantly, in the case of a minute amount, the MSn+1 analysis may not be carried out, so that the identification may fail.
Second, since the MSn ion intensity cannot be measured at the time of the MSn+1 analysis, the quantitative evaluation of the MSn cannot be carried out in this period, which leads to deteriorate the quantitative accuracy of the MSn.

Method used


Image

  • Mass analysis system
  • Mass analysis system
  • Mass analysis system

Examples


example 1

[0036]Hereinafter, the first example of the present invention wilt be explained.

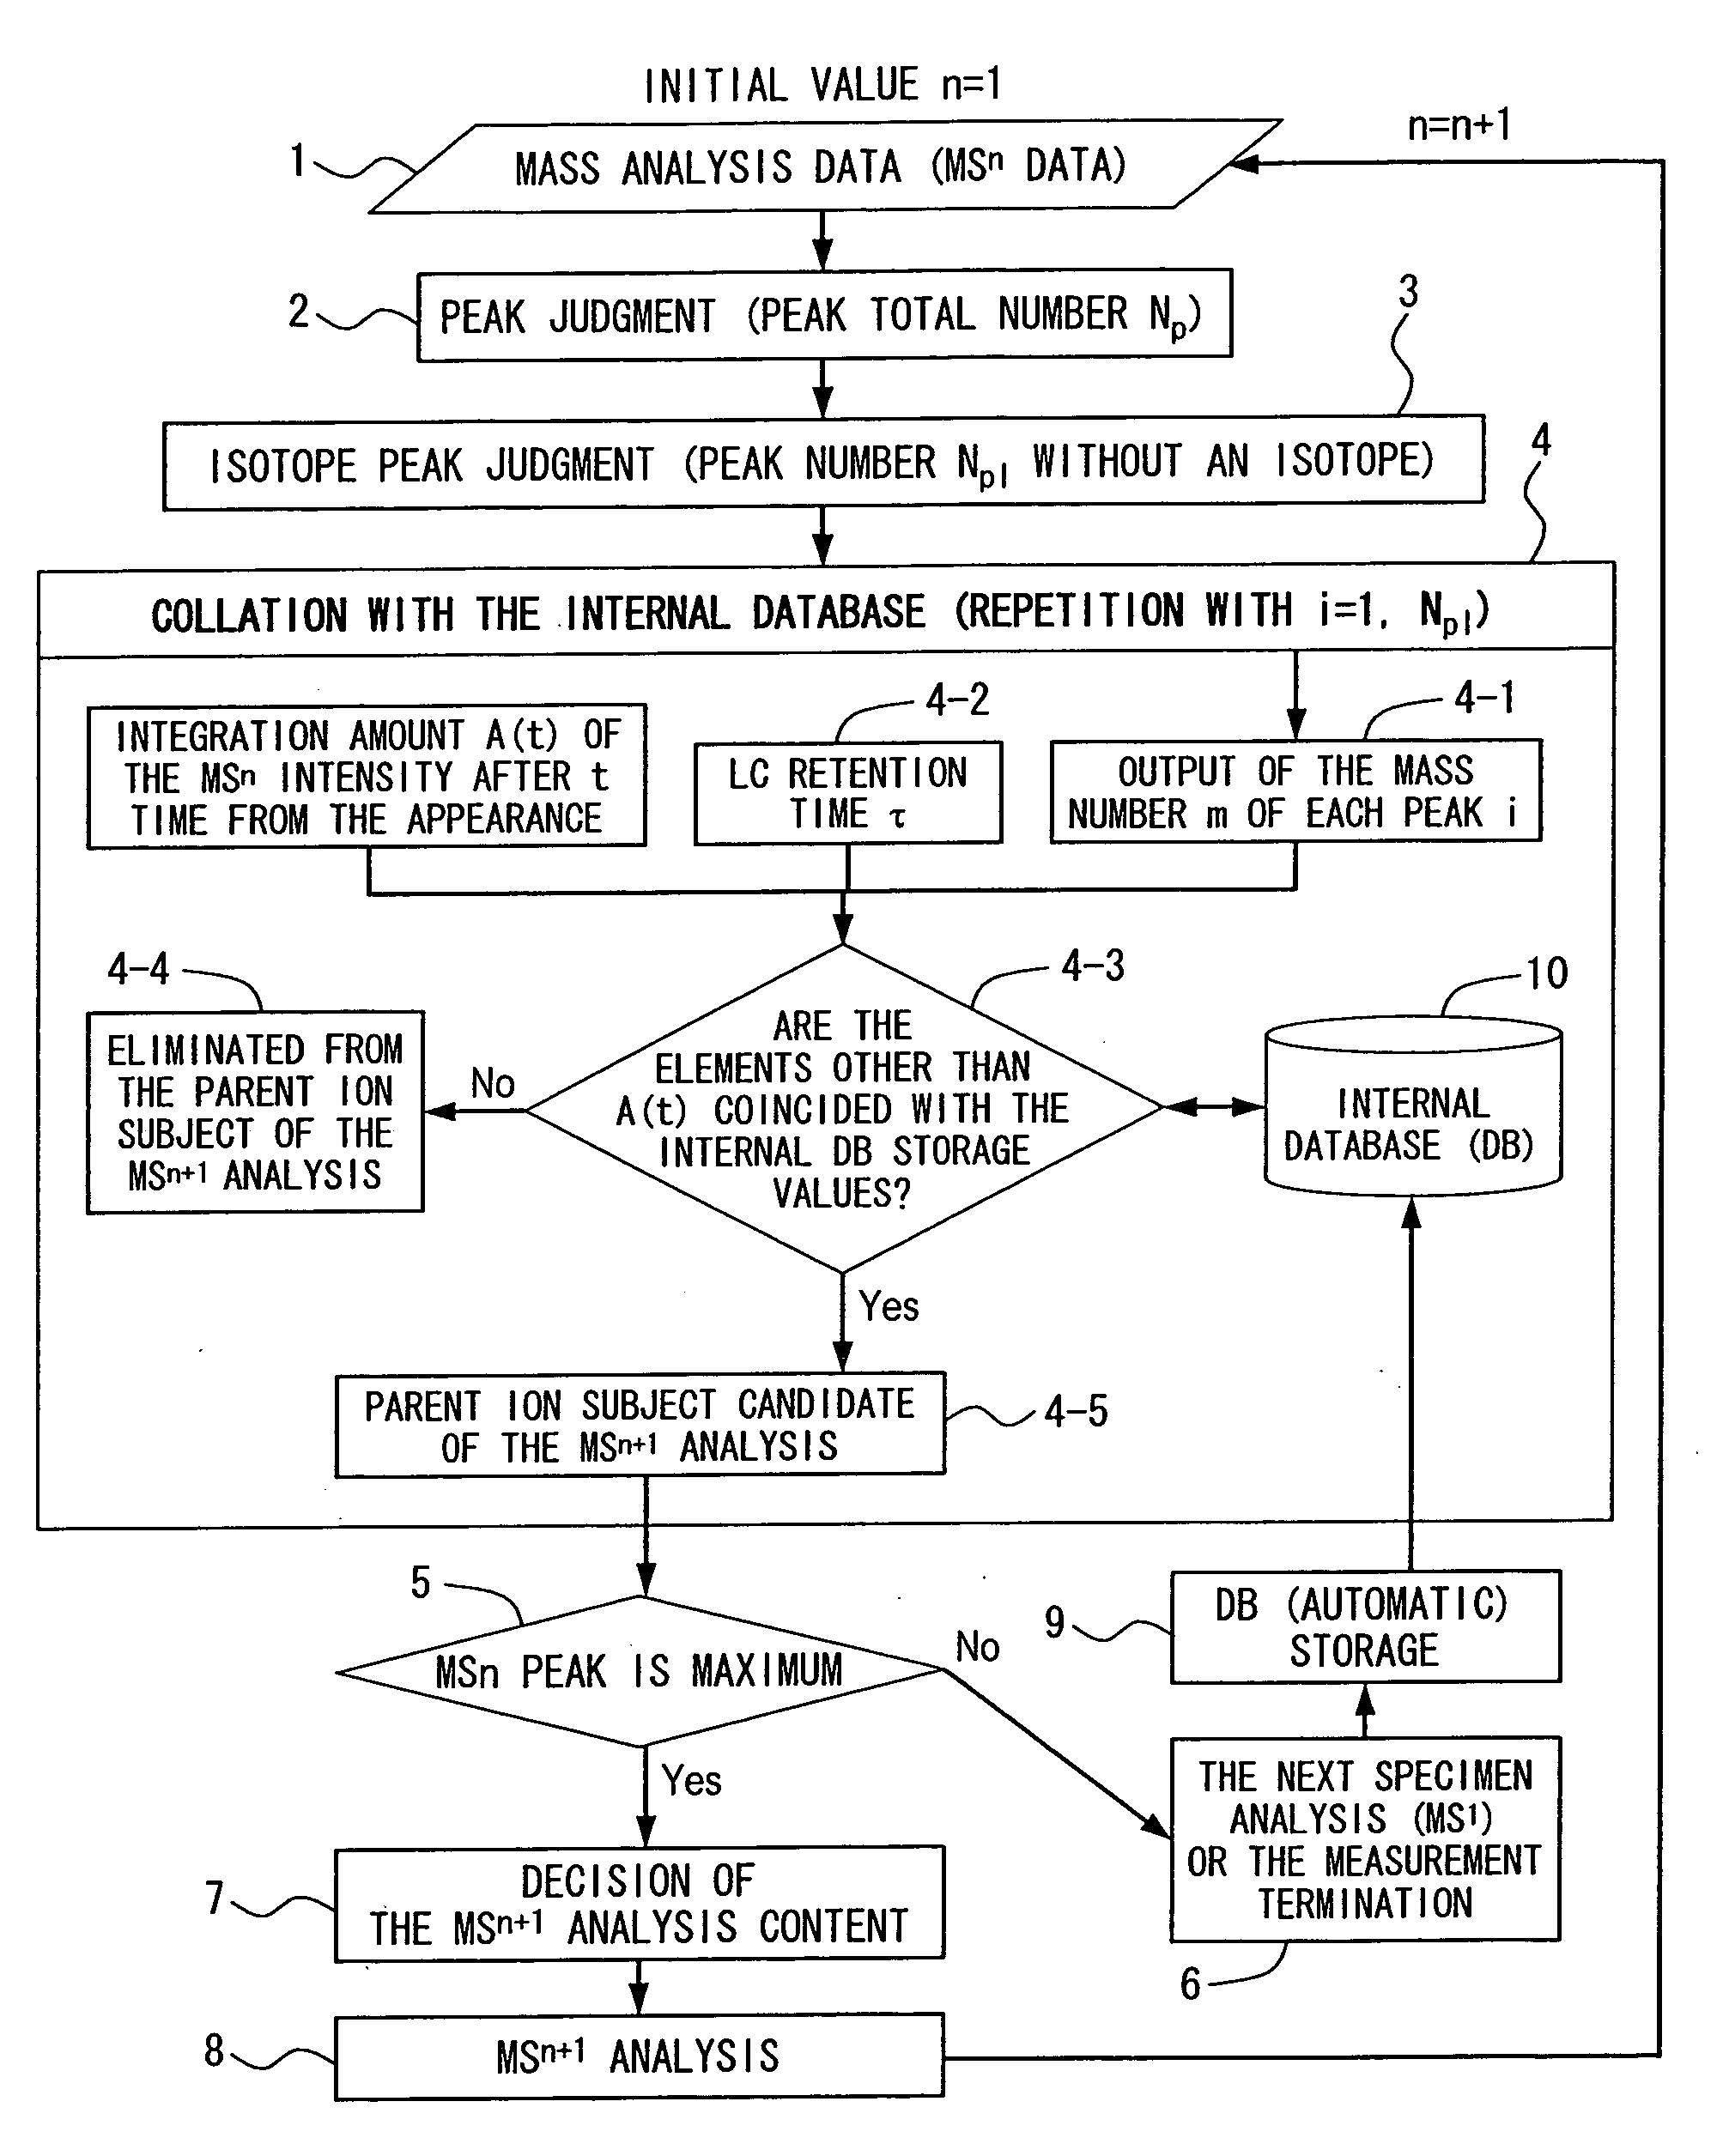
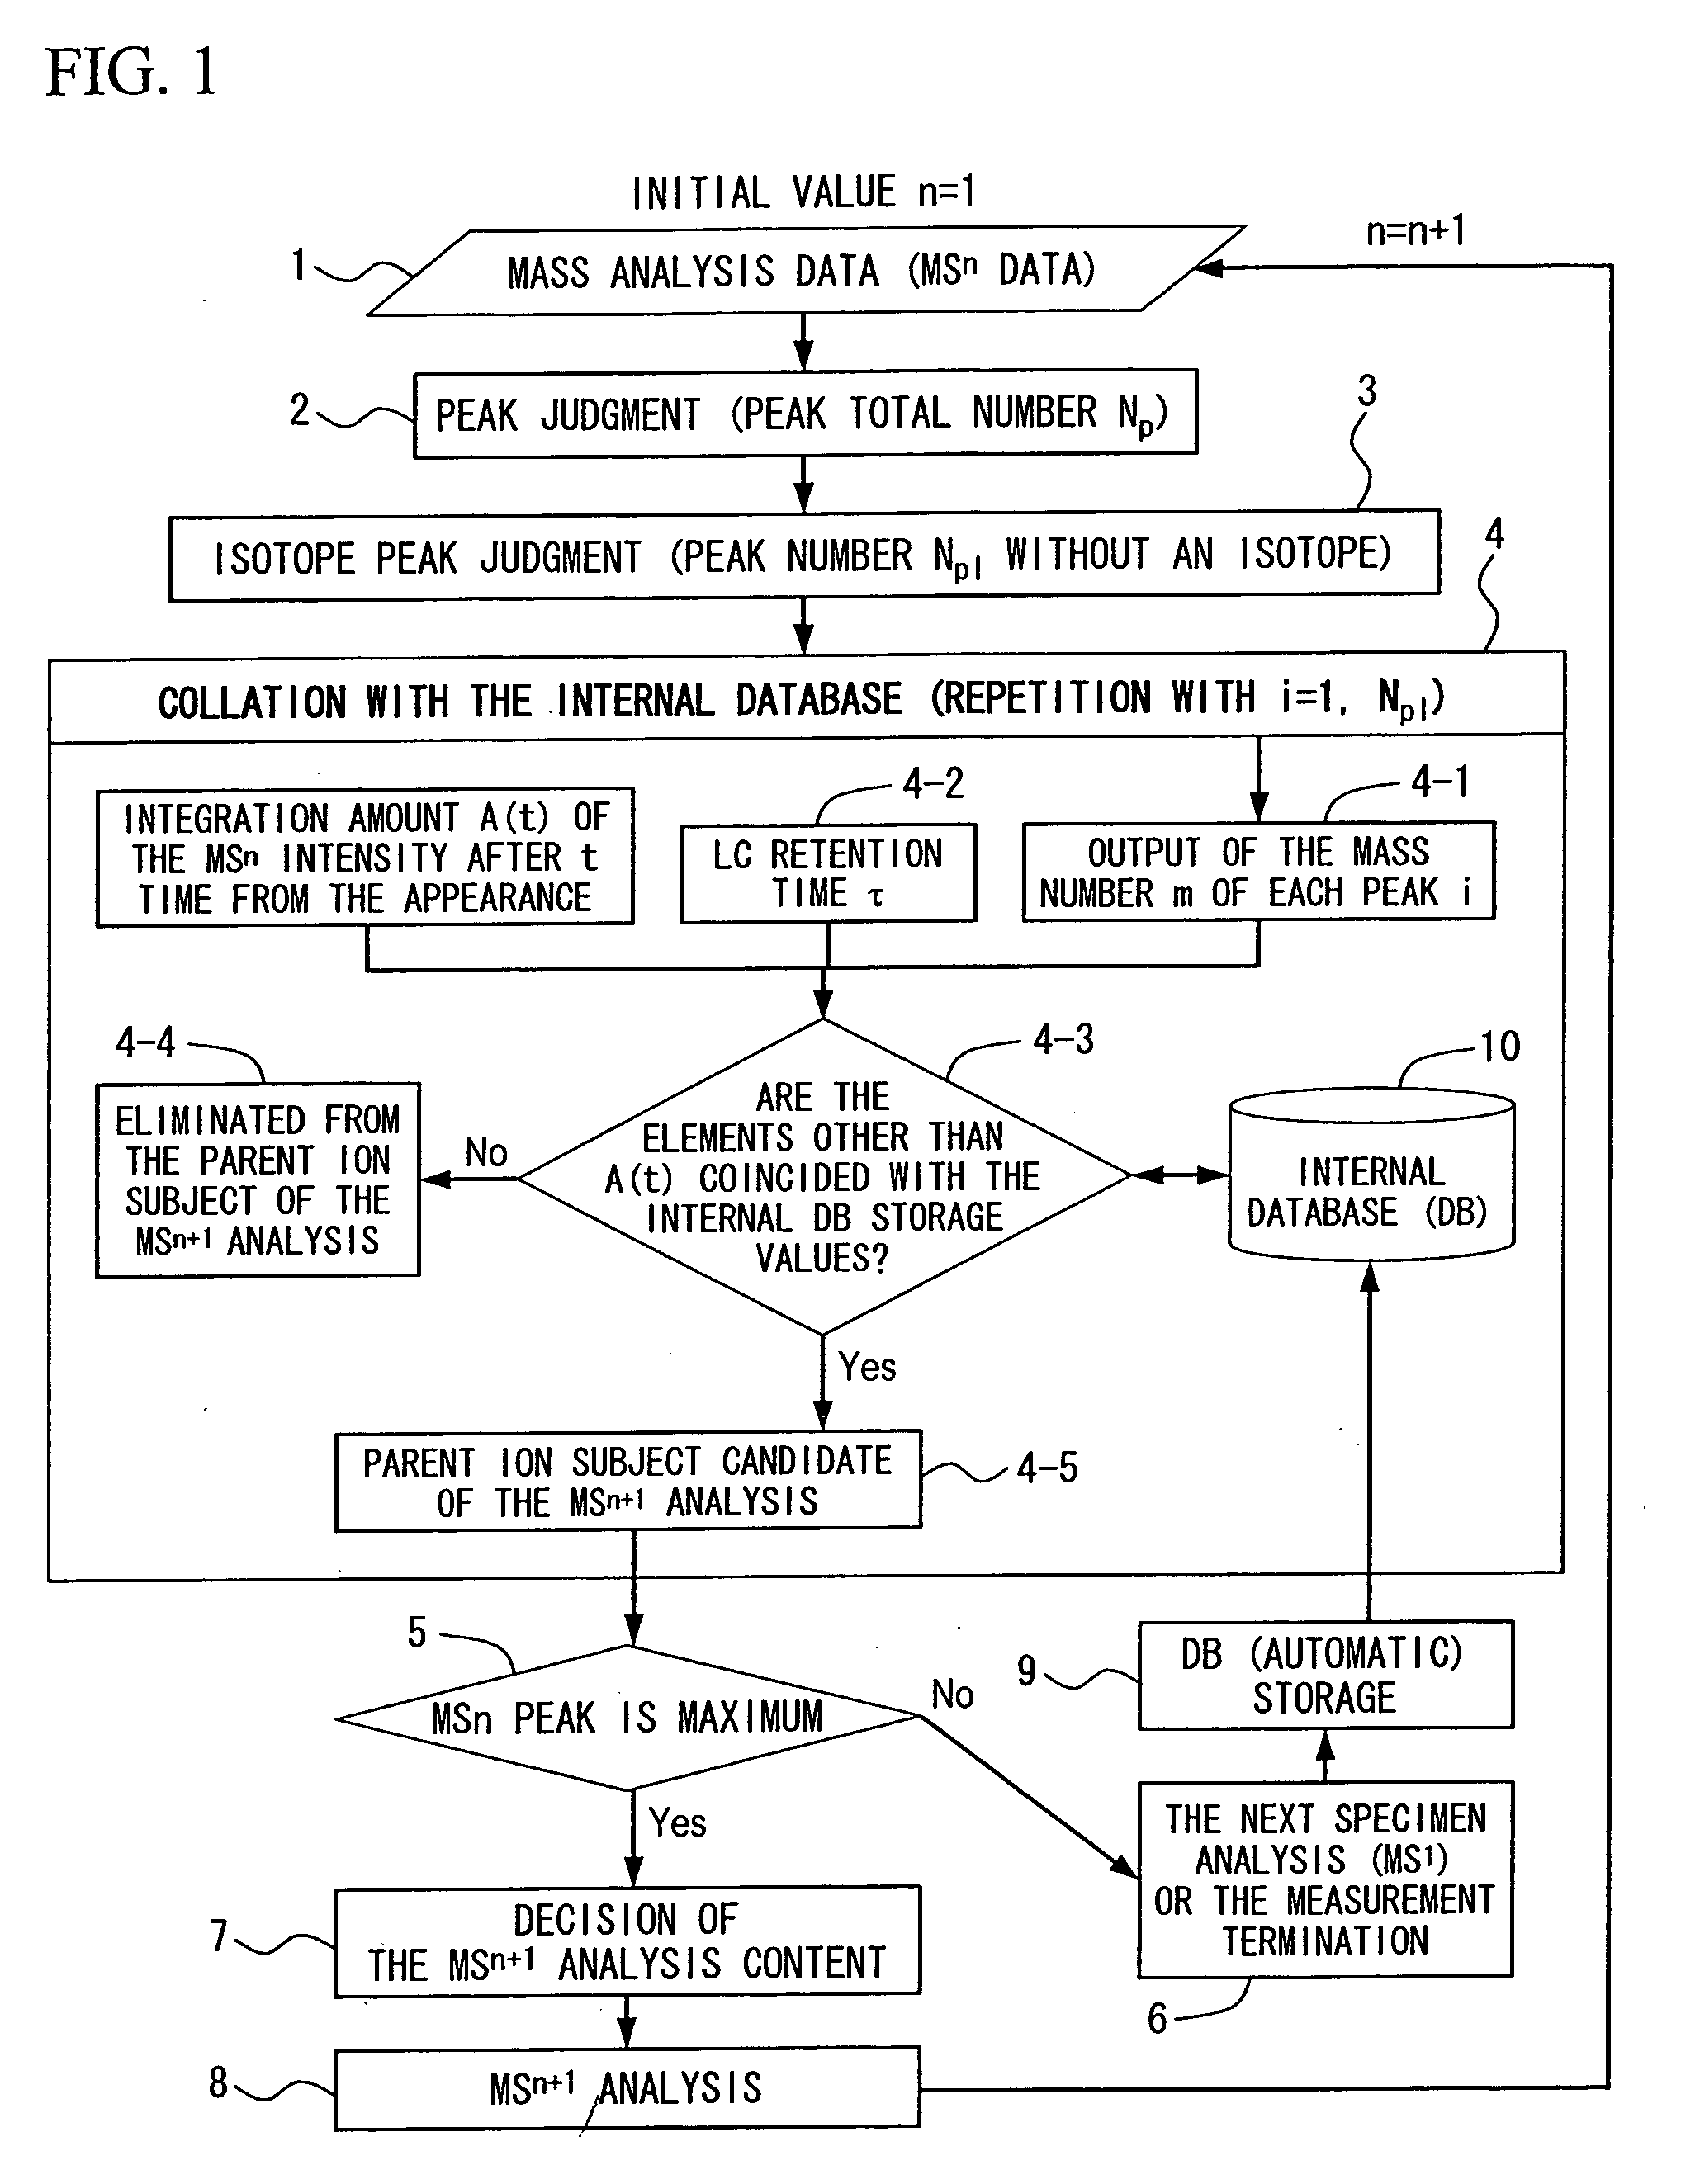
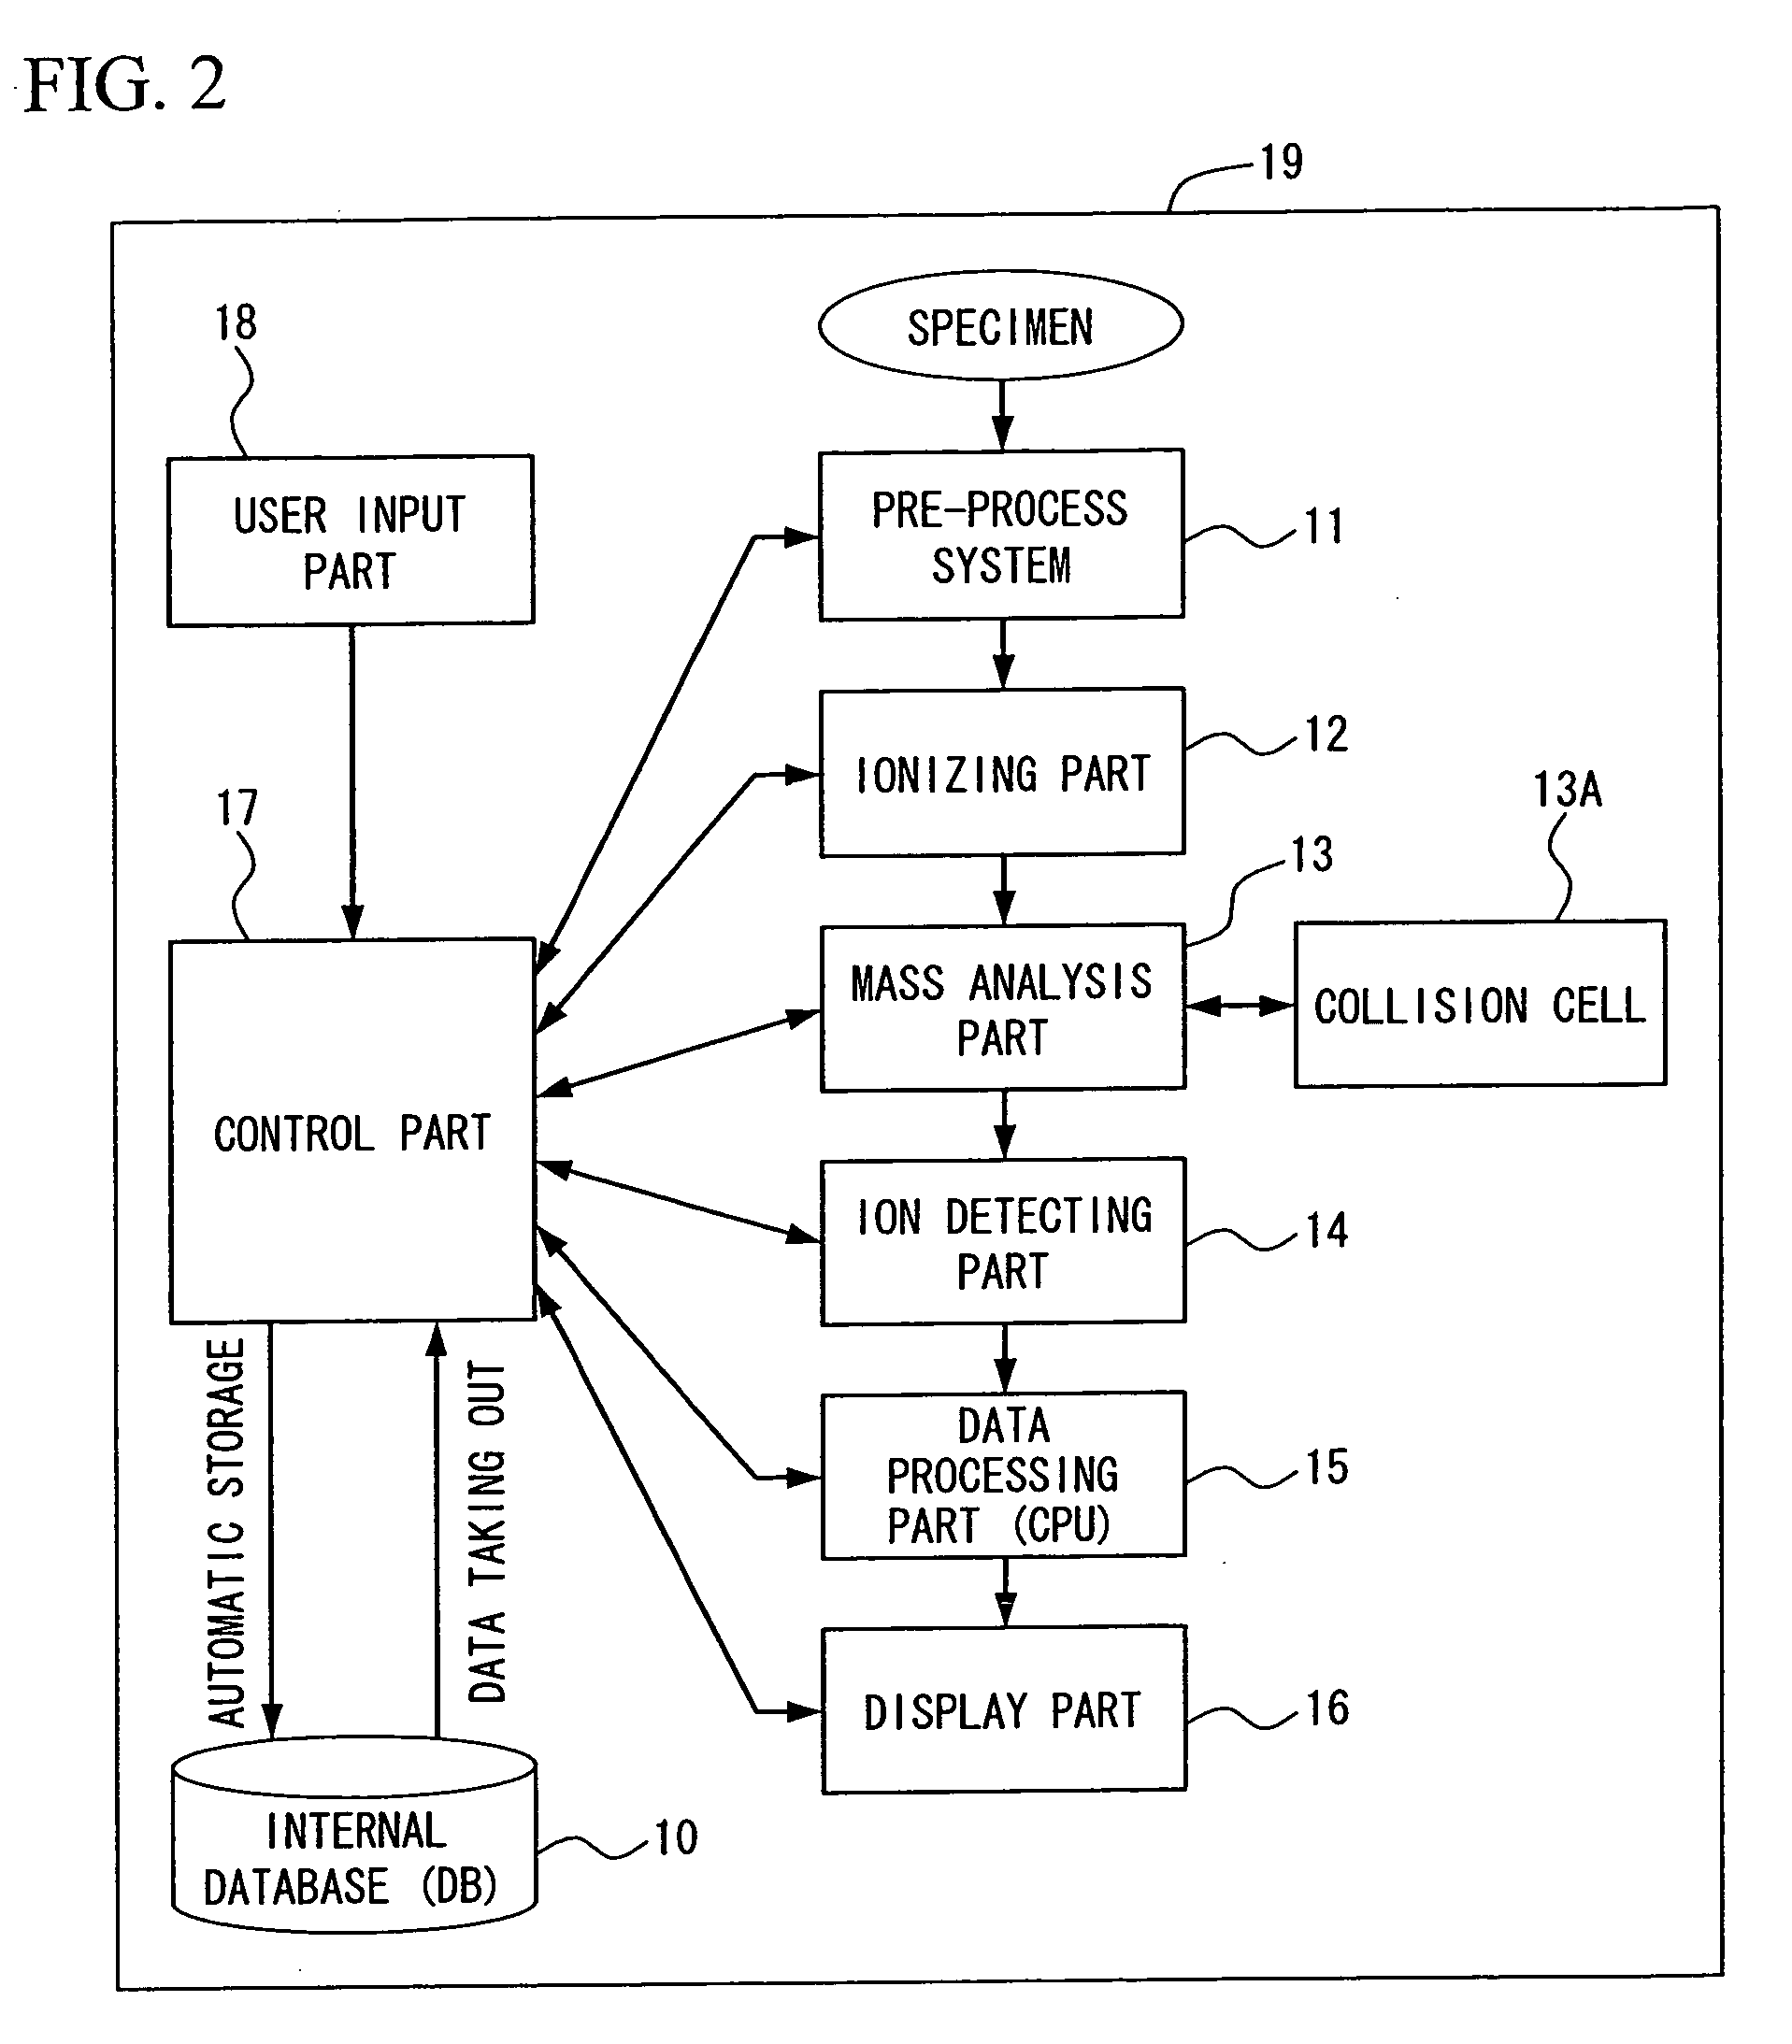
[0037]FIG. 1 is a flow chart of the automatic judging process of the analysis content in a mass analysis system as the first example of the present invention. The mass analysis data 1 refers to the data measured by the mass analysis system 19 shown in FIG. 2. In the mass analysis apparatus 19, the specimen as the analysis subject is pre-processed by a pre-process system 11 such as a liquid chromatography. For example, in the case of a protein as the original specimen, it is decomposed to the size of a polypeptide by a digestive enzyme so as to be separated and sectioned by the liquid chromatography (LC) in the pre-process system 11. Thereafter, it is ionized in an ionizing part 12, and separated according to the mass to charge ratio m / z of the ion in a mass analysis part 13. Here, m is the ion mass, and z is the charge valence number of the ion. The separated ion is detected in an ion detecting part 14, ...

example 2

[0045]Hereinafter, the example 2 of the present invention will be explained with reference to FIGS. 6A and 6B.

[0046]In this example, as the first analysis, the MS1 analysis data of the peptide derived from the specimen are collected and stored in the internal DB with respect to a living body specimen of a healthy person (blood, urine, phlegm). Then, in the second analysis, the MS1 analysis data of a living body specimen (blood, urine, phlegm) of a patient are collected. Here, using the internal DB with the specimen of the healthy person stored, in the case the MS1 peak intensity integrations differ between the two, the peak is selected for the target of the following tandem mass analysis. In FIG. 6A, the first MS1 peak intensity is F1(t), and the second one is F2(t). Here, in the case the correlation coefficients of F1(t) and F2(t) between the time T0 to T1 (present point) is 0.5 or less in the second measurement, the MS2 of the peptide 1 is carried out immediately after the peak in...

example 3

[0048]Hereinafter, the example 3 of the present invention will be explained with reference to FIG. 7.

[0049]Here, an ion trap type mass analysis part is provided as the mass analysis part. In this case, since the ion trap itself plays the role of the collision cell, the collision cell needs not to be provided independently. Since the tandem analysis MSn can be carried out with n≧3 according to the ion trap, a system of automatically judging the next target as the present invention is extremely effective.


PUM


Abstract

An object of the present invention is to evaluate quantitatively a peptide derived from a protein, whose analysis has been difficult so far, by analyzing a peptide ion derived from a protein already measured but having a different total ion amount as the tandem mass analysis target at the time of quantitatively evaluating a fluctuating component between different kinds of specimens by the tandem mass analysis of a protein or a peptide. In the present invention, in order to achieve the above-mentioned object, data of a derived peptide obtained by a first time measurement are stored automatically in an internal database and collated with second time measurement data highly accurately. The processing for selecting the peak of the already measured peptide with the relative amount fluctuation as the next tandem analysis target is implemented within the real time of the measurement for avoiding the analysis of a peptide without the relative amount fluctuation.

Description

BACKGROUND OF THE INVENTION[0001]1. Field of the Invention[0002]The present invention relates to an analysis system for mass analysis spectra using a mass analysis apparatus, and in particular, it relates to a system for the automatic judgment of the optimum mass analysis flow within the real time of the measurement for accurately and efficiently identifying the fluctuation amount of a minute amount of the biopolymers such as peptides and sugar chains.[0003]2. Description of the Related Art[0004]According to a common mass analysis method, after ionizing a specimen as the measurement subject, the various produced ions are sent to the mass analysis apparatus for measuring the ion intensity for each mass to charge ratio m / z as the ratio of the mass number m of the ion to the valence number z. The mass spectra obtained as a result are consisted of the peaks of the measured ion intensities (ion peaks) with respect to each mass to charge ratio m / z value. The mass analysis of the ionized s...

Claims


Application Information

Patent Timeline
Patent Type & Authority Applications(United States)
IPC IPC(8): B01D59/44
CPCH01J49/02H01J49/0027
Inventor KOBAYASHI, KINYAYOSHINARI, KIYOMIYOKOSUKA, TOSHIYUKIHIRABAYASHI, ATSUMU
Owner HITACHI LTD
Why Eureka
Try Eureka