Methods for Enhancing the Analysis of Particle Detection

Inactive Publication Date: 2008-01-24
SINGULEX
View PDF84 Cites 53 Cited by
  • Summary
  • Abstract
  • Description
  • Claims
  • Application Information

AI Technical Summary

Benefits of technology

[0017]This invention provides a method for enhancing the analysis of particle detection comprising measuring a first electromagnetic radiation signal provided by a particle within a first interrogation volume and optionally applying a first analytical filter to the first electromagnetic radiation signal and measuring a second electromagnetic radiation signal emitted by the particle in a second interrogation volume and optionally applying a second analytical filter to the second electromagnetic radiation signal, comparing by cross-correlation the electromagnetic radiation signal emitted by the particle within the first interrogation volume to the electromagnetic radiation signal emitted by the particle within the second interrogation volume, and further applying a third analytical filter to the cross-correlation events, thereby enhancing the analysis of the particle detection.

Problems solved by technology

The challenge of fluorescent SMD is to maximize the signal to background ratio while continuing to lower the detection limits.
Using current SMD methods a number of artifacts or fluorescence from impurities in the sample can lead to erroneous interpretations.
The disadvantage of autocorrelation is that random background is generally included in the analysis.
While these analyses are sufficient for simple cases of detection and discrimination, they may not yield reliable results for samples composed of complex mixtures.
Fluorescence burst size and lifetime are similar spectroscopic properties that may both be subject to artifacts of the detection system which will limit the power of combining them for data analysis.
In another technology, fluorescence activated cell sorting (FACS) or flow cytometry, uses more than one parameter, such as fluorescence intensities at different wavelengths and light scattering in different directions, to distinguish target particles, but measurement of particle mobility cannot be utilized because particles move at uniform velocity.

Method used


Image

  • Methods for Enhancing the Analysis of Particle Detection
  • Methods for Enhancing the Analysis of Particle Detection
  • Methods for Enhancing the Analysis of Particle Detection

Examples


example 1

Detection of Nucleic Acid Targets Moving at Uniform Rate Using Cross-Correlation and Analytical Filters

[0147]1a. Linearized pUC19 was labeled with Alexa Fluor®647 using a ULYSIS® nucleic acid labeling kit (Molecular Probes, Inc., Eugene, Oreg.) according to the manufacturer's instructions. Unbound label was removed and the sample was suspended at 7.5 fM in phosphate buffered saline with 0.01% casein hydrolysate and pumped through the interrogation volumes of the analyzer at 1 μl / min.

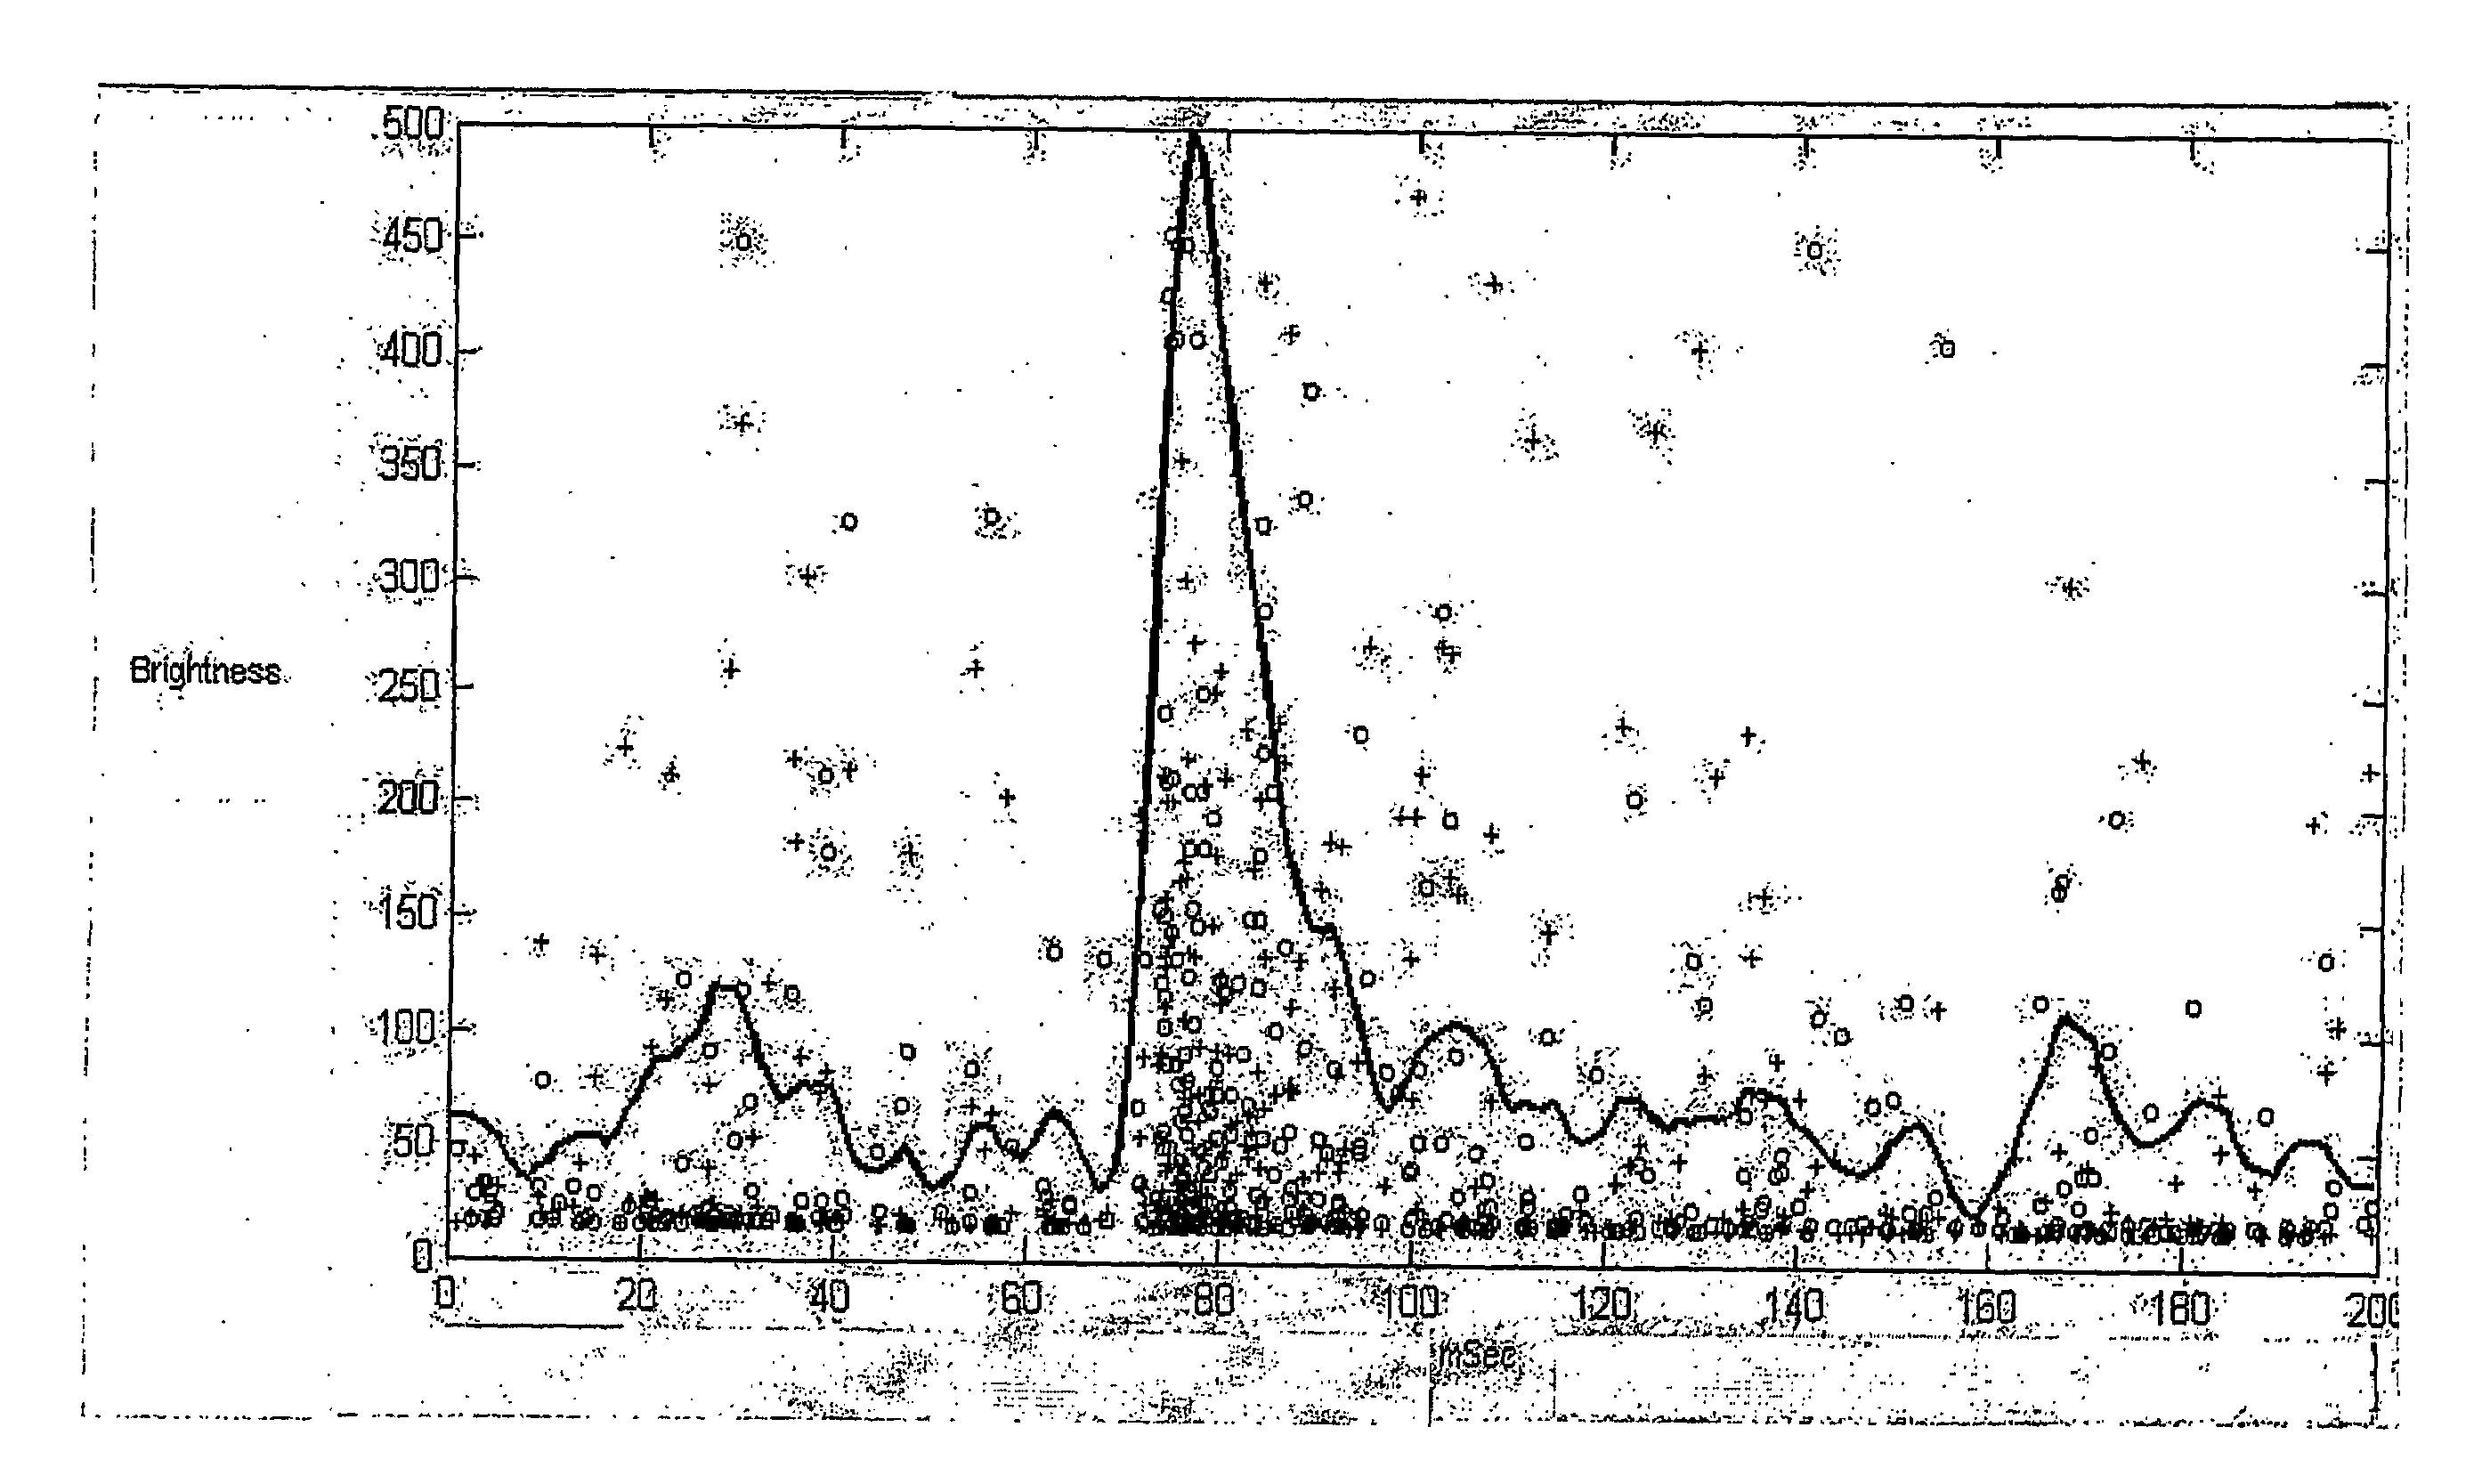
[0148]1b. Another sample consisted of a 7.2 kb DNA fragment labeled as above and subjected to electrophoresis at 3000V for 60 seconds in 0.2× TB, 0.01% SDS. Analyzed data is shown in FIG. 3. Panels 3A and 3B show data from 7.5 mM linearized pUC19 moved through the analyzer by pumping. The detected signals were filtered to select those that were greater than two standard deviations above the average background. The filtered signals were cross-correlated and plotted. Dot plots show brightness (y-axis) vs....

example 2

Using Predetermined Electrophoretic Velocity Ranges to Automatically Detect One of Two Particles in a Sample

[0150]An intrinsically fluorescent protein complex, PBXL-3, and a 1.1 kb nucleic acid were used to predetermine characteristic electrophoretic velocity ranges. The nucleic acid was labeled with Alexa Fluor® 647 following the protocol of the ULYSIS® nucleic acid labeling kit (Molecular Probes, Inc., Eugene, Oreg.). The samples were subjected to electrophoresis, and data was analyzed according to the scheme described above, except that analytical filters for brightness and peak width were applied after cross-correlation. The protein complex and nucleic acid were analyzed independently and the characteristic ranges for the peak height, peak width and elapsed time were used to determine windows where each particle was expected to occur (Table 1).

TABLE 1Window 1Window 2(for PBXL3)(for 1.1 kb nucleic acid)Peak>150Width >3 Elapsed Time350-500 ms250-300 ms

Using these characteristics, ...

example 3

Detection and Discrimination of Particles in a Mixture Moving at Uniform Rates Using Cross-Correlation Analysis and Filtering

[0151]An intrinsically fluorescent protein complex, PBXL-3, emits at a high intensity relative to a nucleic acid, linearized pUC19 labeled with Alexa Fluor® 647. The pUC19 DNA was labeled with Alexa Fluor® 647 following the protocol of the ULYSIS® nucleic acid labeling kit (Molecular Probes, Inc., Eugene, Oreg.). Phosphate Buffered Saline (PBS) (10 mM sodium phosphate, 150 mM NaCl, pH 7.2) was supplemented with 0.01% casein hydrolysate (Sigma-Aldrich Corp., St. Louis, Mo.) and used to make dilution series (2.5, 5, 7.5, 10 and 20 fM) of protein alone, nucleic acid alone or mixtures of both. Samples were moved through the analyzer by pumping at 1 μl / min for 4 min.

[0152]Data was analyzed as described above. The detected signals were filtered to select those that were greater than four standard deviations above the average background. FIG. 4A shows plots of cross-...


PUM


Abstract

Methods for enhancing the analysis of particle detection are provided comprising measuring a first electromagnetic radiation signal provided by a particle, comparing by cross-correlation the electromagnetic radiation signal emitted by the particle, and further applying an analytical filter to the cross-correlation events, thereby enhancing the analysis of the particle emission.

Description

CROSS-REFERENCE TO RELATED APPLICATIONS[0001]This application claims priority from U.S. Provisional Application Ser. No. 60 / 507,243 filed on Sep. 30, 2003, which is incorporated herein by reference in its entirety.STATEMENT REGARDING FEDERALLY SPONSORED RESEARCH OR DEVELOPMENT[0002]Not Applicable.INCORPORATION-BY-REFERENCE OF MATERIAL SUBMITTED ON A COMPACT DISC[0003]Not Applicable.BACKGROUND OF THE INVENTION[0004]1. Field of the Invention[0005]The invention relates generally to detection and discrimination of individual particles at ultra-low concentrations in a flowing solution. Electromagnetic emission from the particles is detected as they move into two interrogation volumes and the data collected by detectors at each interrogation volume is analyzed by cross-correlation and application of analytical filters to distinguish particle signals from background.[0006]2. Description of Related Art[0007]Techniques for detecting lower and lower concentrations of biological molecules are ...

Claims


Application Information

Patent Timeline
IPC IPC(8): G06F15/00
CPCG01N15/1427G01N15/1429G01N15/1459G01N2015/1438G01N21/6428G01N2015/0092G01N2015/1402G01N15/1463G01N15/1433
Inventor PUSKAS, ROBERT
Owner SINGULEX
Why Eureka
Try Eureka