TP53 gene expression and uses thereof
a technology of tp53 and gene expression, applied in combinational chemistry, biochemistry apparatus and processes, library screening, etc., can solve the problems of prior art deficient knowledge and prior art deficient in correlating tp53 gene status with multiple myeloma disease progression and outcom
- Summary
- Abstract
- Description
- Claims
- Application Information
AI Technical Summary
Problems solved by technology
Method used
Image
Examples
example 1
Study Subjects
[0042]Purified plasma cells (PCs) were obtained from newly diagnosed multiple myeloma patients who were treated on NIH-sponsored clinical trials UARK 98-026 (Total Therapy 2, TT2) (n=351) and UARK 03-033 (Total Therapy 3, TT3) (n=214) [1, 21-26]. Both protocols utilized induction regimens, followed by melphalan-based tandem autotransplants, consolidation chemotherapy and maintenance treatment.
[0043]Human MM cell lines ARP-1, JJN3, OCI-MY5 and Delta 47 were cultured in RPMI 1640 containing 10% heat-inactivated fetal calf serum (FCS), 2 mM L-glutamine (Gibco, Grand Island, N.Y.), penicillin (100 U / mL) and streptomycin (100 μg / mL) at 37° C. in humidified 95% air and 5% CO2.
example 2
[0044]Fluorescence in situ Hybridization
[0045]To detect TP53 deletions, a SpectrumRed-labeled DNA probe (LSI p53; Vysis, Downers Grove, Ill.) was combined with a SpectrumGreen-labeled probe (CEP17, Vysis) for the chromosome 17 α-satellite-DNA centromere. The triple color interphase (TRI)-FISH procedure used to analyze the samples has been described [27, 28]. Based on FISH studies of normal bone marrow mononuclear cells, the upper limit of normal plus three standard deviations was less than 10% for deletions of TP53;[8] therefore, the background cut-off level of 10% was used for the probes sets.
example 3
Gene Expression Profiling
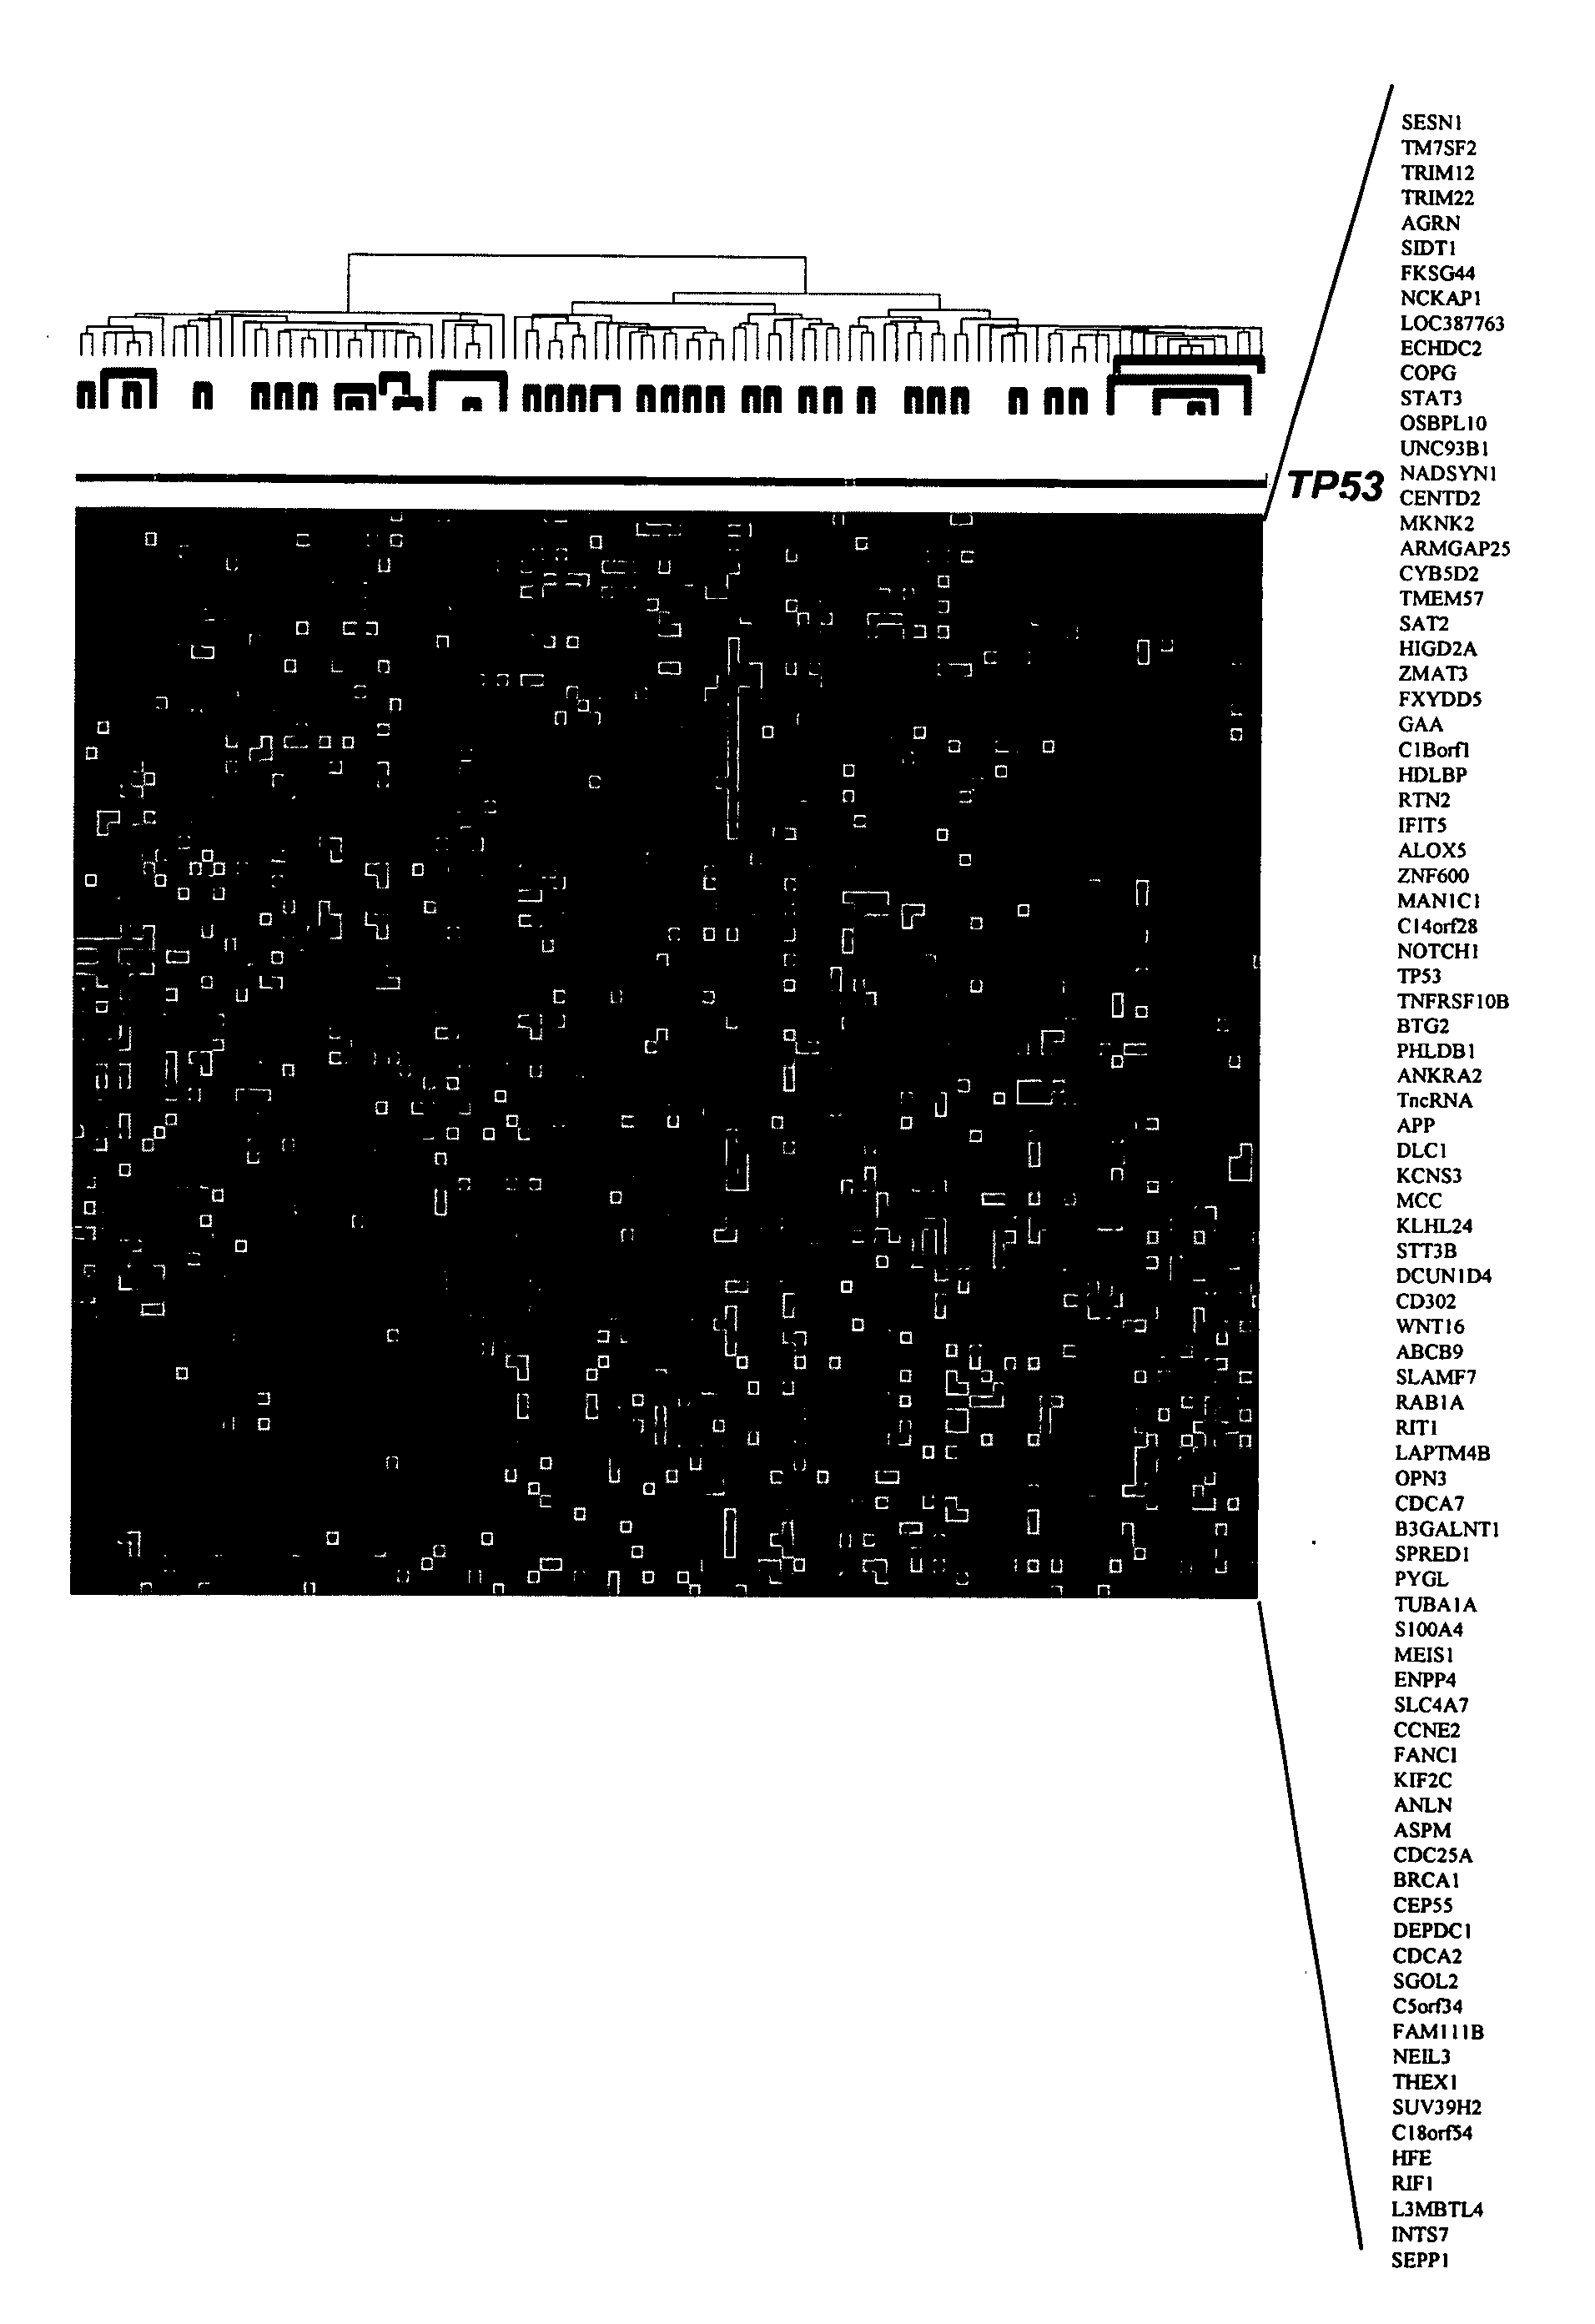
[0046]Bone marrow plasma cells from 565 newly diagnosed (351 TT2 and 214 TT3) patients, and 90 patients with relapsed disease were purified by CD138 (+) selection (29, 30). Gene expressions levels in purified plasma cells and MM cell lines were profiled using with the U133plus2.0 array (Affymetrix, Santa Clara, Calif.), and the signals of probe set 201746 at representing TP53 was used in this analysis. Signal intensities were preprocessed using GCOS1.1 software and normalized by GCOS1.1 software [29-31]. Gene expression data on this patient cohort can be found at the NIH GEO omnibus under accession number GSE2658 [1,21,22,25,27].
PUM
| Property | Measurement | Unit |
|---|---|---|
| fluorescence in situ hybridization | aaaaa | aaaaa |
| frequency | aaaaa | aaaaa |
| PET | aaaaa | aaaaa |
Abstract
Description
Claims
Application Information
 - R&D
- Intellectual Property
- Life Sciences
- Materials
- Tech Scout
- Unparalleled Data Quality
- Higher Quality Content
- 60% Fewer Hallucinations
Browse by: Latest US Patents, China's latest patents, Technical Efficacy Thesaurus, Application Domain, Technology Topic, Popular Technical Reports.
© 2025 PatSnap. All rights reserved.Legal|Privacy policy|Modern Slavery Act Transparency Statement|Sitemap|About US| Contact US: help@patsnap.com


