Fault tree map generation

Inactive Publication Date: 2009-03-26
EMBRAER SA
View PDF16 Cites 64 Cited by
  • Summary
  • Abstract
  • Description
  • Claims
  • Application Information

AI Technical Summary

Benefits of technology

[0045]The exemplary illustrative Fault Tree Map may be analyzed by itself, or it may be used as a map or guide for analyzing the underlying more detailed and complex fault tree—thus serving as a map the same way that a roadmap helps one to navigate the complexity of city streets. For example, occasionally, at the report generation stage, a Fault Tree may need to be divided and paged. In the exemplary illustrative non-limiting implementation at this stage, the logical gates on the Fault Tree Map may be completed or identified by report page number, where each logical Gate is placed. This action provides highly efficient guidance for using the exemplary illustrative Fault Tree Map to guide the reliability engineer to traverse and analyze the conventional Fault Tree,

Problems solved by technology

No man-made machine or system can be designed to be 100% reliable.
Any machine or system we can design and build will eventually break down and fail.
If a household appliance such as a dishwasher or oven in your kitchen breaks down, you may be inconvenienced until the appliance can be repaired but few other adverse consequences generally occur.
However, as we trust and rely on technology more and more, there is an increased risk that technology failure can have catastrophic consequences.
To prevent single point failures from having catastrophic consequences, system designers often build in redundancy and fault protection.
If the main power system fails, the backup power system immediately takes over.
While such fault tolerant designs have been highly successful, they introduce additional complexity to the already complex problem of reliably predicting how the system will operate in the event of certain faults.
Many prior approaches, if implemented to construct fault trees for complex integrated systems/installations (for example, in the aeronautic industry) will result in extended large fault trees, that can consist about 200-300 failure nodes.
Unfortunately, such complex fault tree graphical representations are, because they are so large, not possible or practic

Method used


Image

  • Fault tree map generation
  • Fault tree map generation
  • Fault tree map generation

Examples


Embodiment Construction

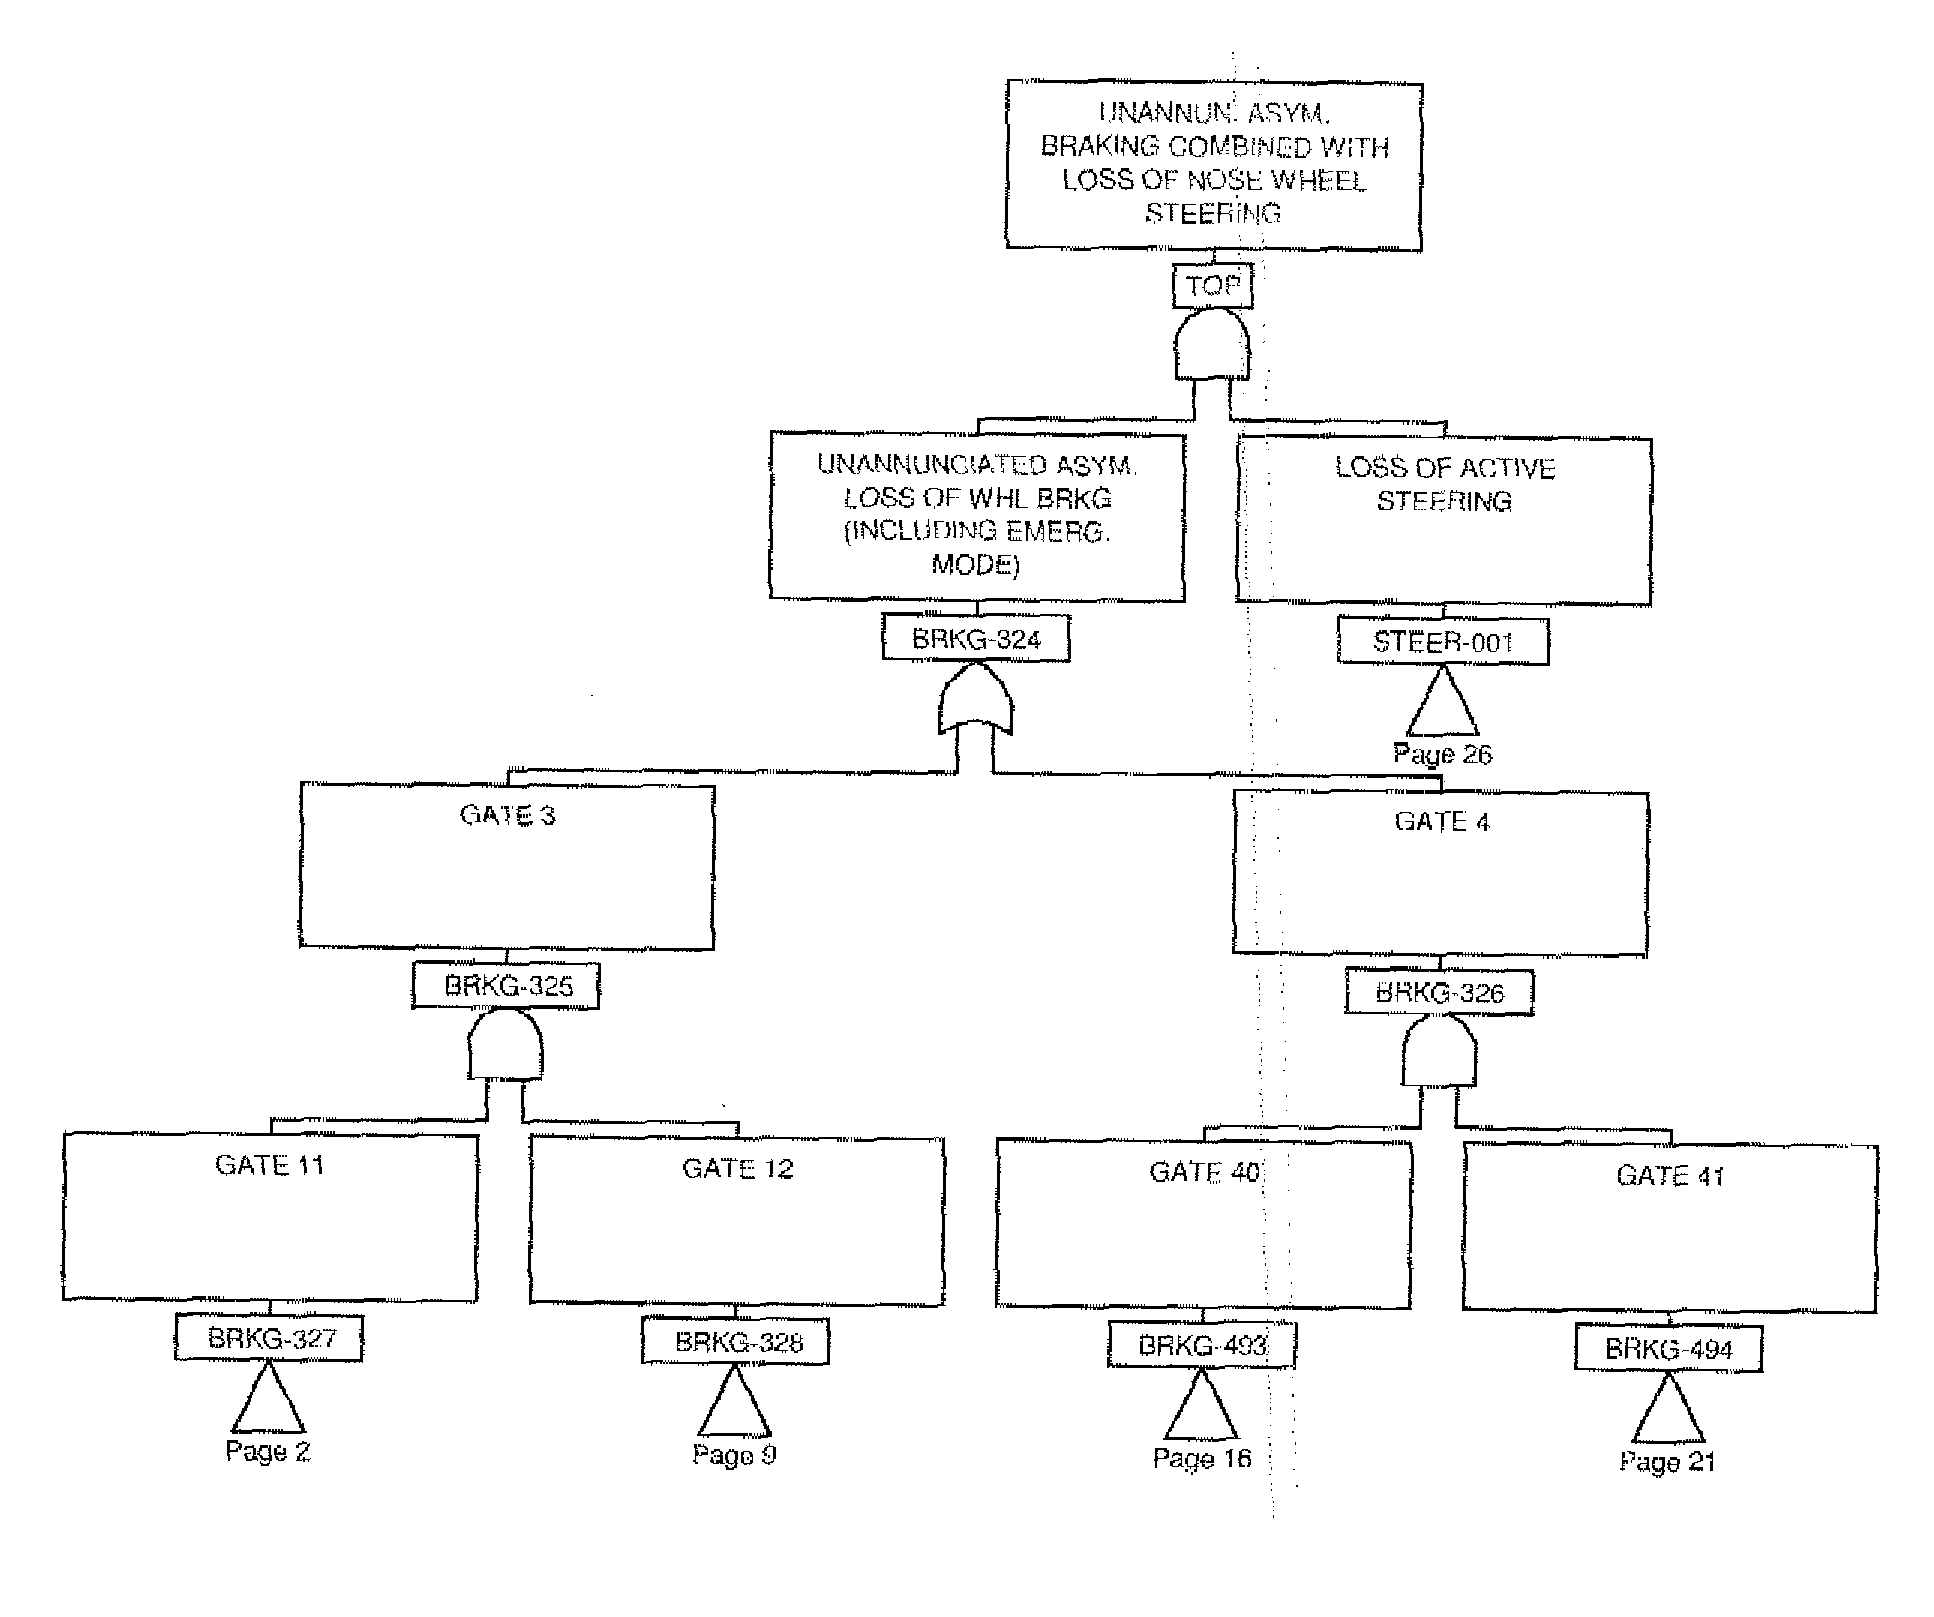
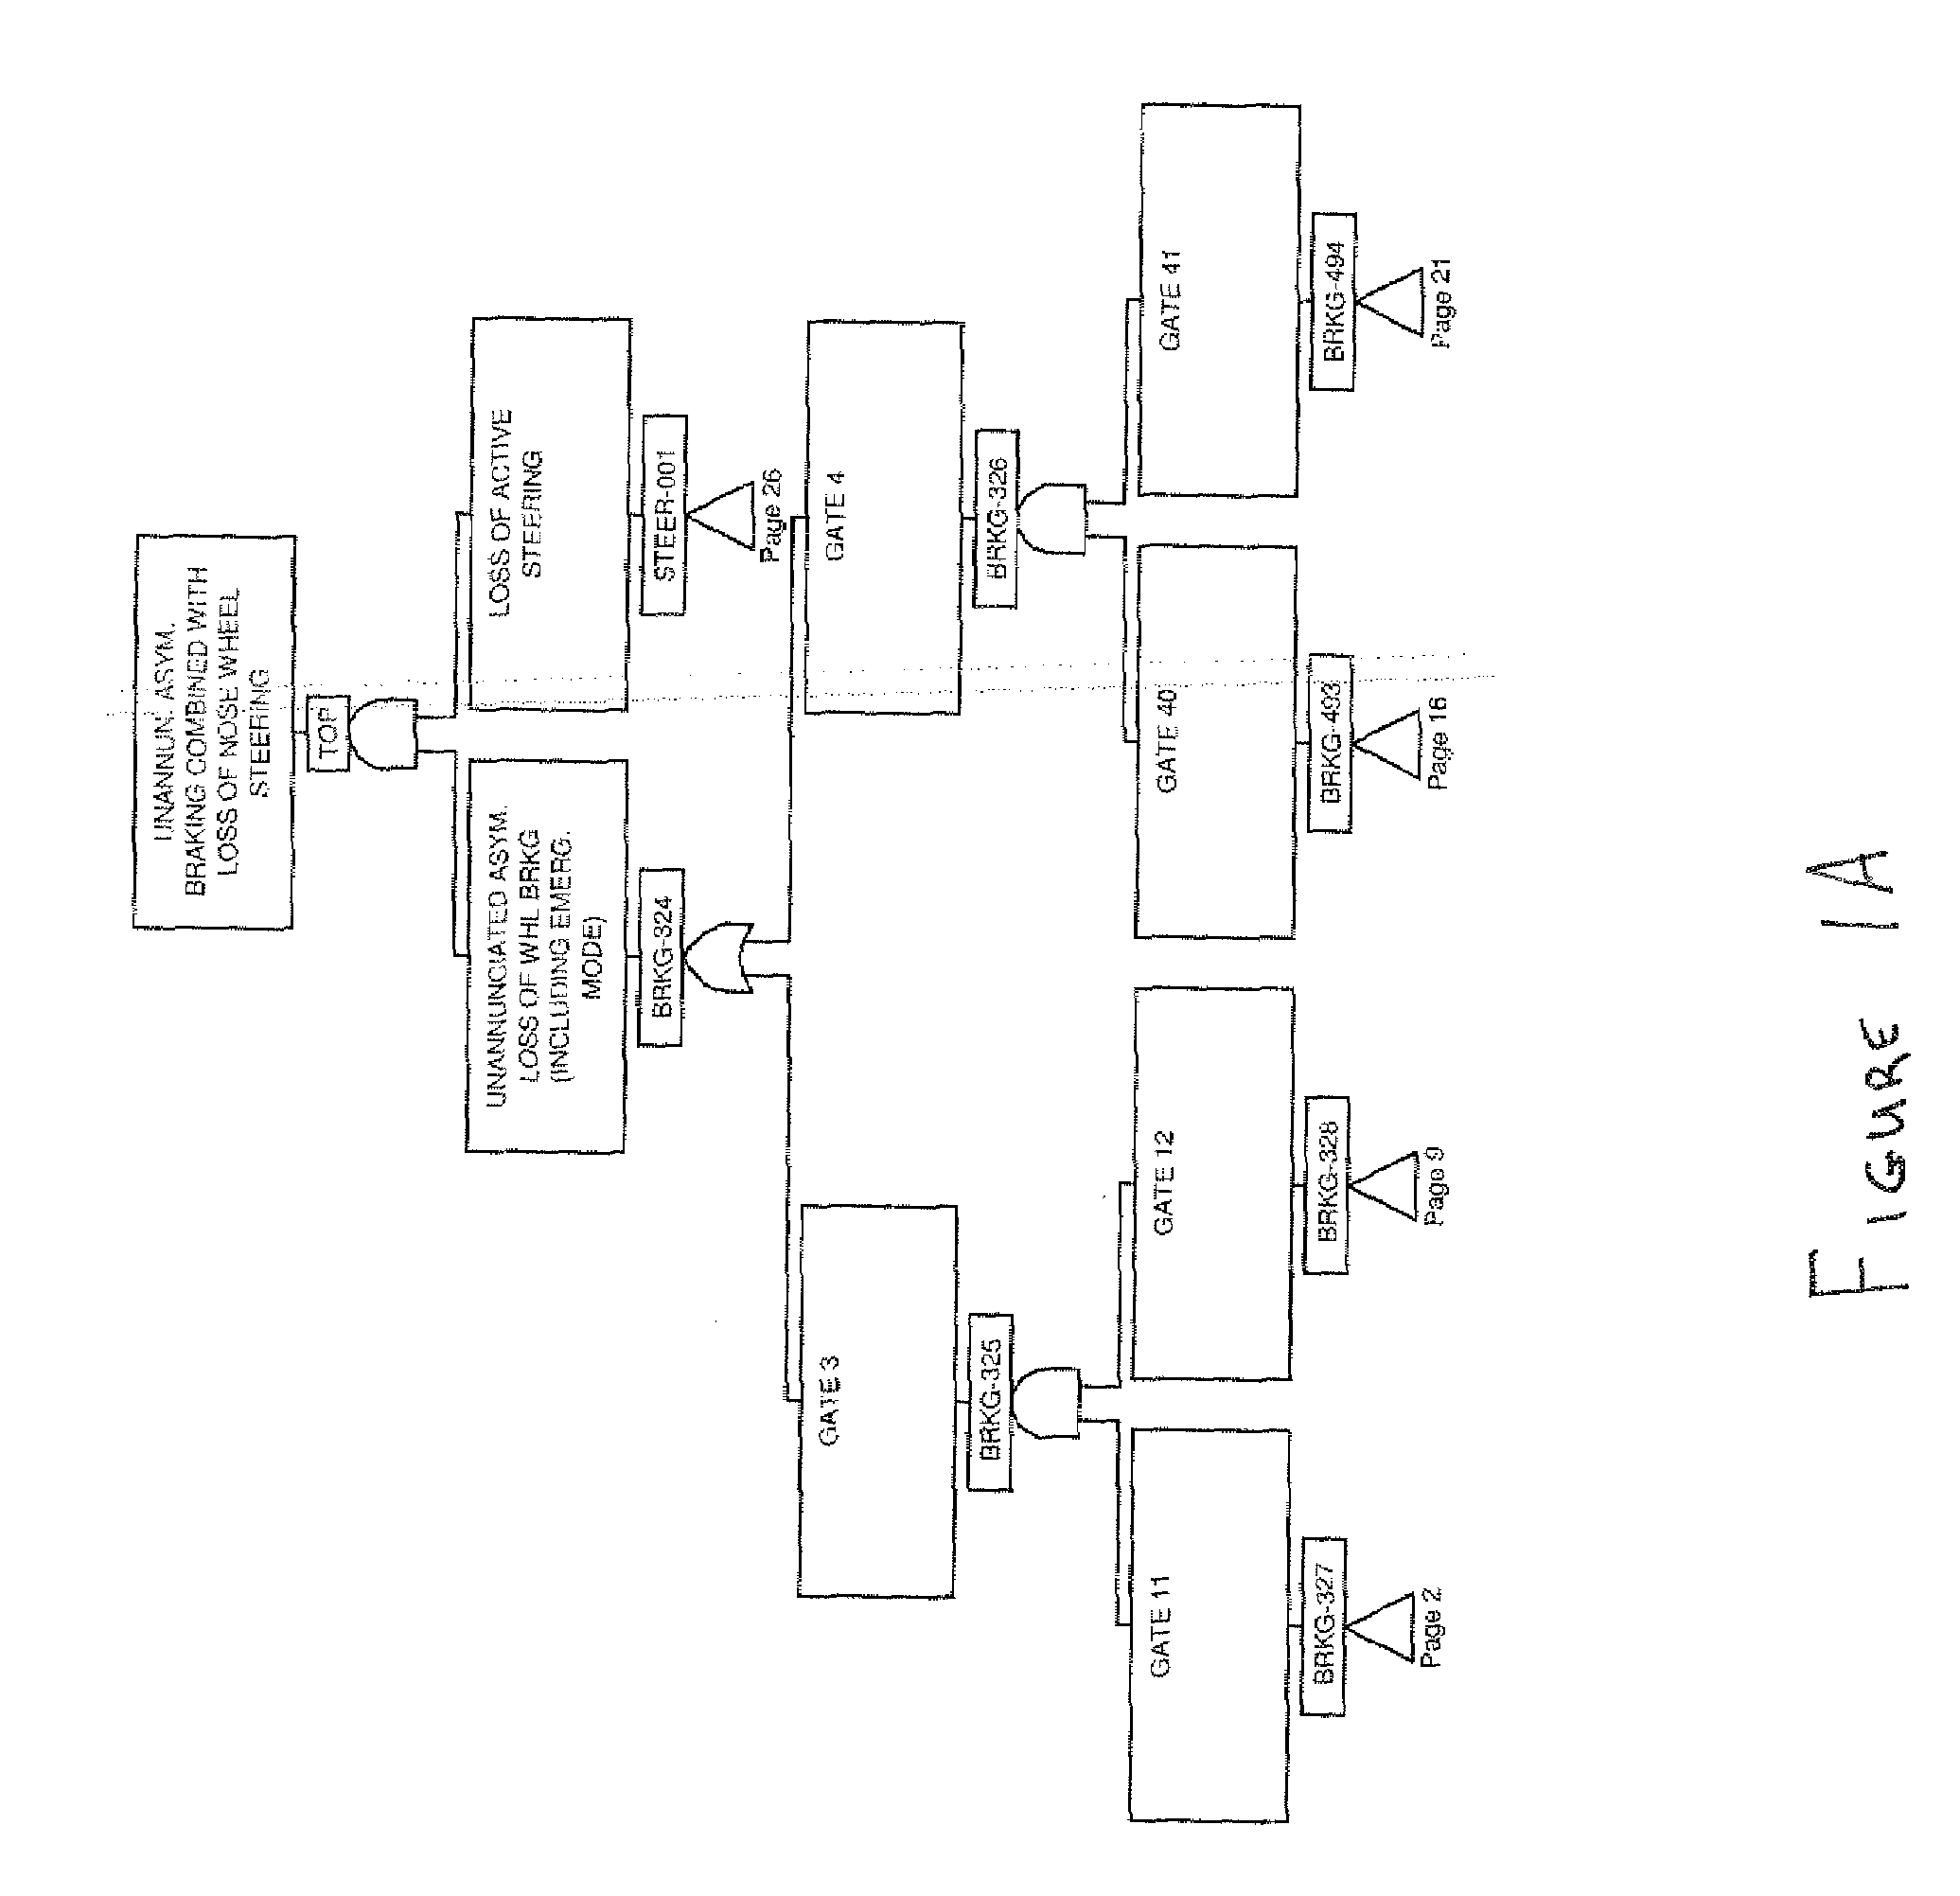
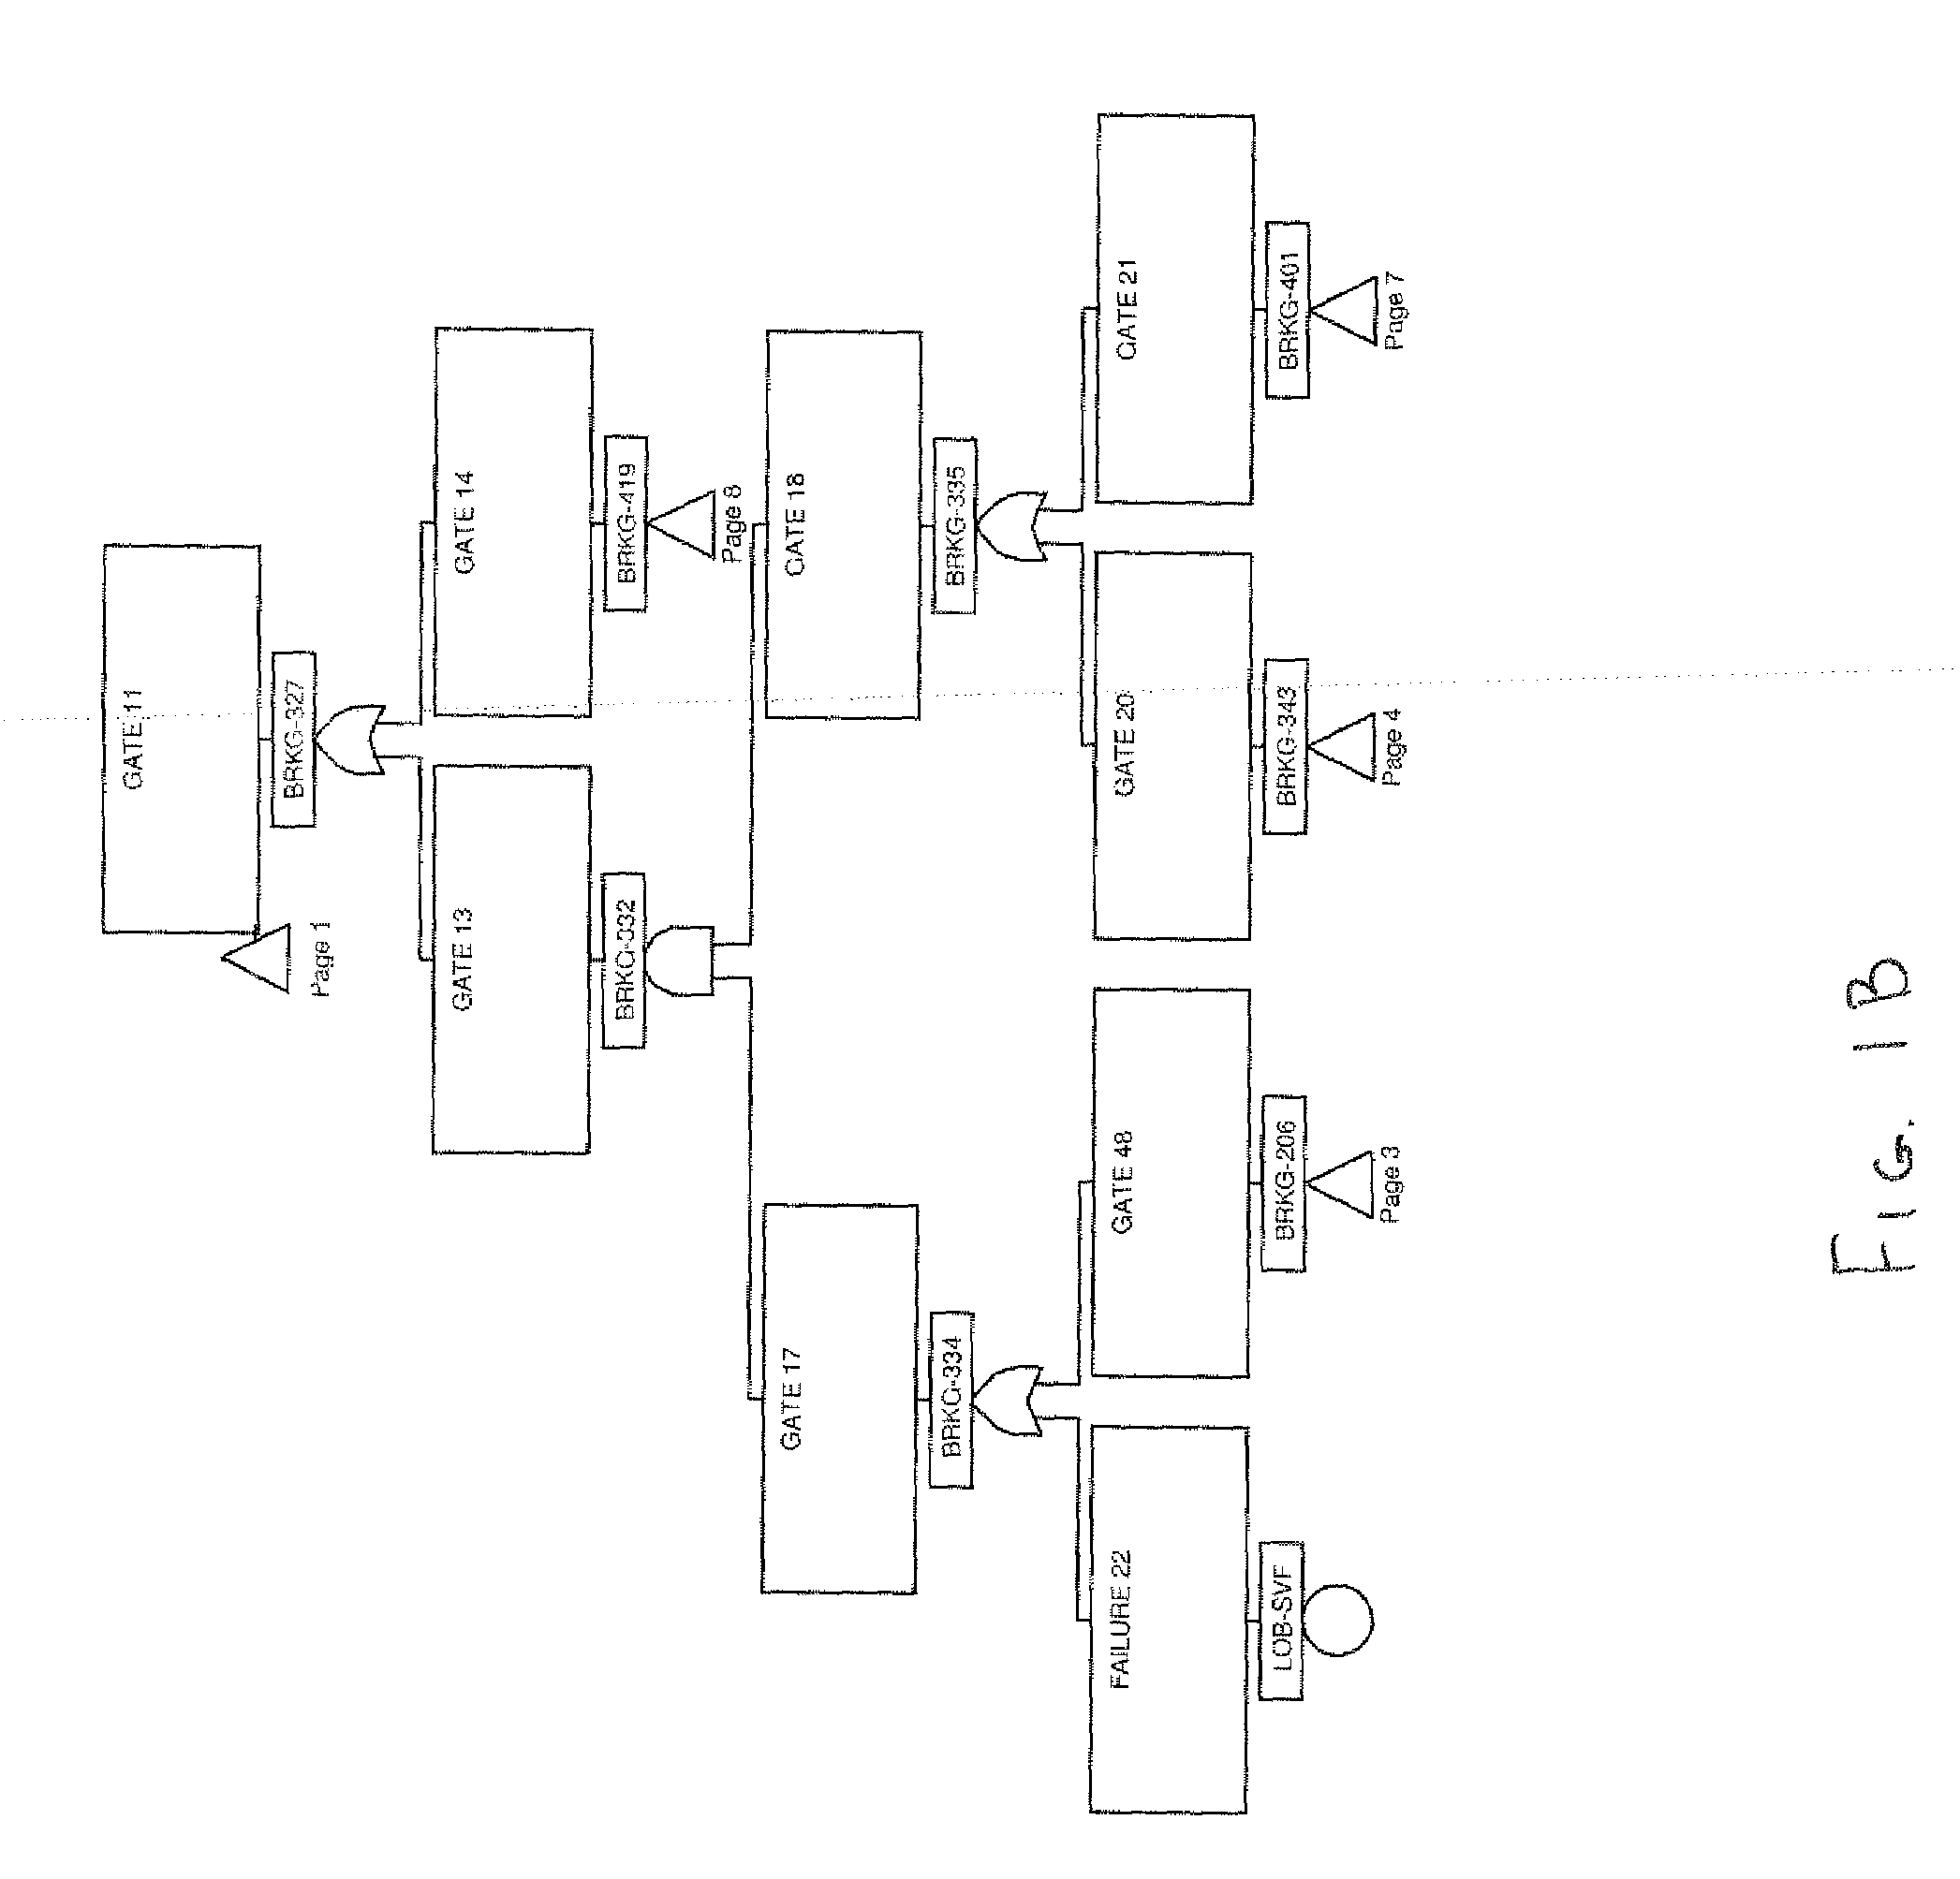
[0058]FIGS. 1A-1AF show an exemplary illustrative non-limiting conventional fault tree of the type that is used in many industries and applications to conduct fault and reliability analysis. The example fault tree shown in these Figures shows faults and system behavior for an example aircraft braking condition. However, any type of aircraft or other system, including but not limited to other vehicular or transportation systems, medical systems, first responder emergency systems, communications systems, power grid systems including nuclear reactors, or any other complex or other system can be analyzed using a fault tree in a similar fashion as is known to those skilled in the art.

[0059]Those skilled in the art will recognize the features of the conventional fault tree shown in FIGS. 1A-1AE. For example, they will recognize the “top event” shown in FIG. 1A (braking loss combined with loss of nosewheel steering) that represents a potentially aircraft failure mode, as well as the failur...


PUM


Abstract

A method for Fault Tree Map generation employs to transformation of Fault Trees of production installation, specific installation, technical system (Hardware and integrated Hardware/Software) to new Fault Tree diagram (Fault Tree Map), which permits drastically compact the Fault Tree depiction and facilitates performing of the Fault Tree qualitative analysis, including evaluation of combination of latent failures and evident failures, repeated events and critical events position influence, and failure propagation potentiality, besides facility of localization of each Fault Tree logical Gate and relevant failures in the fault tree printed report. Generation takes place using special symbols, which permit to reflect the Fault Tree logic, present all Fault Tree failures with graphically identification of the failure type, and show the failure repetition and also the failure critically (importance) to Fault Tree Top Event probability. The method presents exceptional advantages to analysis of large-scale, extended Fault Trees, allowing vastly decrease the time of analysis and elevate the analysis quality and Fault Tree perception, including for specialists, who are not the Fault Tree authors.

Description

FIELD[0001]The technology herein relates to fault tree analysis, and more particularly to methods and apparatus for transforming a fault tree into a compact fault tree map. Still more particularly, the technology herein relates to Fault Tree Map generation through use of special symbols and graphical presentation in order to facilitate fault tree qualitative analysis. The technology herein can generally be adapted for use with any type of the Fault Tree, including Fault Trees developed for production installation, specific installation, hardware and integrated hardware / software technical systems. The technology herein is suitable, for example, for use in performing systems, installations and equipment faults analysis, including fault propagation, for complex or other integrated objects, systems or installations including but not limited to aircraft failure analysis.BACKGROUND AND SUMMARY[0002]No man-made machine or system can be designed to be 100% reliable. Any machine or system we...

Claims


Application Information

Patent Timeline
IPC IPC(8): G06F11/00
CPCG06F2217/10G06F17/5009G06F30/20G06F2111/08
Inventor VLASSOVA, OLGA ALEXANDROVNABAKOWSKI, ANTONIOCARDOSO, JR., JAURESMARTINAZZO, ALDO
Owner EMBRAER SA
Why Eureka
Try Eureka