
Mass spectrometer

a mass spectrometer and mass spectrometer technology, applied in the field of mass spectrometers, can solve the problems of inability to narrow down the laser to a diameter approximately a few dozen m on the sample surface with current technology, the number of repeated analysis tasks will be enormous, and the spatial resolution in creating a two-dimensional substance distribution image is improved, so as to enhance the identification accuracy of each substance, the effect of sufficient spatial resolution and accuracy

Inactive Publication Date: 2009-06-25
SHIMADZU CORP
View PDF2 Cites 12 Cited by
  • Summary
  • Abstract
  • Description
  • Claims
  • Application Information

AI Technical Summary

Benefits of technology

The present invention aims to provide a mass spectrometer that can quickly and accurately analyze the distribution of substances in a two-dimensional area on a sample. It should have a high spatial resolution even when the energy ray used for ionization cannot be narrowed down. Additionally, it can also analyze the product ions generated by the dissociation of ions.

Problems solved by technology

With the aforementioned configuration, in the case where the two-dimensional area to be analyzed is large, the number of repeated analysis tasks will be enormous, and it takes a long time to obtain a two-dimensional substance distribution image.
In addition, although the spatial resolution of a two-dimensional substance distribution image is determined by the laser irradiation area, the laser cannot be narrowed down to a diameter approximately a few dozen μm on the sample surface with current technology.
Such a spatial resolution is not enough to observe a living cell or the like, and spatial resolution is required to be enhanced by one more orders of magnitude.
However, it is difficult to achieve this only by modifying a lens optical system or other units for narrowing down the laser irradiation diameter.
Even if the laser irradiation diameter can be narrowed down, another problem will arise: the amount of ion generation decreases since the area to be analyzed is small, which leads to the decrease of the analysis accuracy.
Although the scaling of the image can be performed according to necessity, in practice it is difficult to perform an ion transport which completely satisfies such a condition.
In the case where the condition is not satisfied, the spatial resolution of a two-dimensional substance distribution image decreases, which makes the image blur.
For that purpose, an ion trap, a collision induced dissociation cell or other units are required to be placed along the ion pathway; however, this spoils the previously-described relative relationship of the ions' generation positions.

Method used


Image

  • Mass spectrometer
  • Mass spectrometer
  • Mass spectrometer

Examples


first embodiment

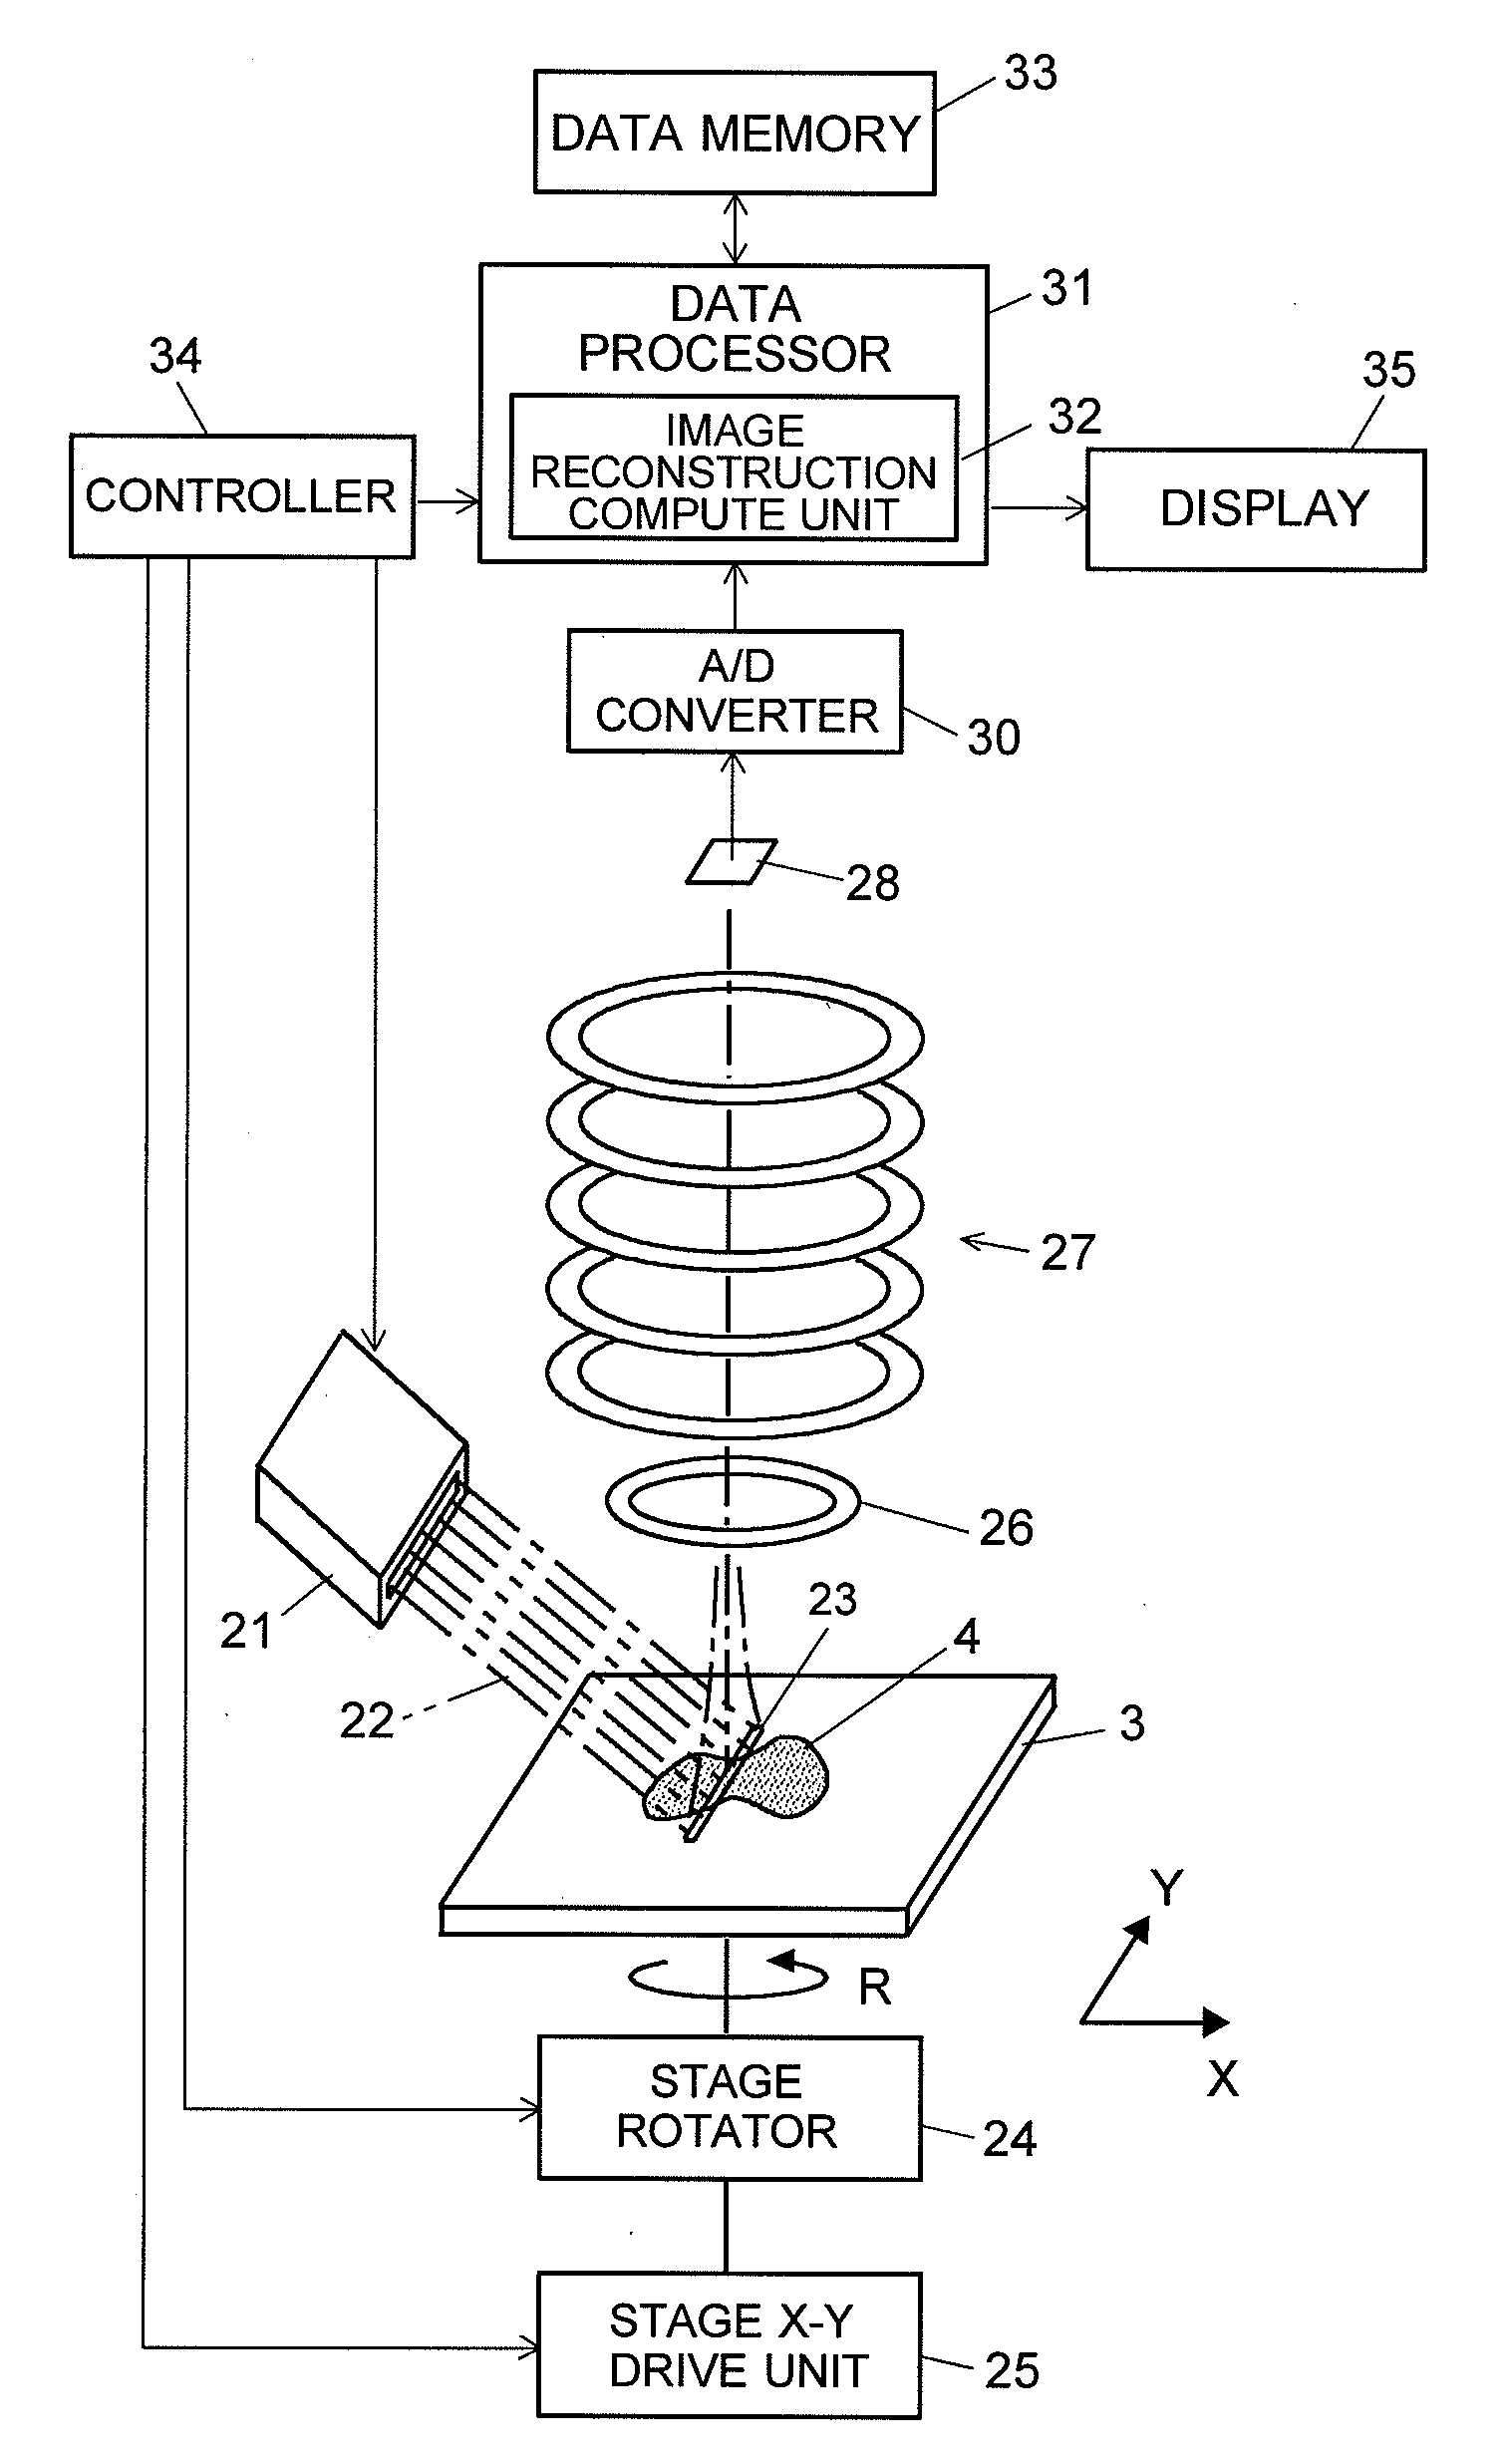
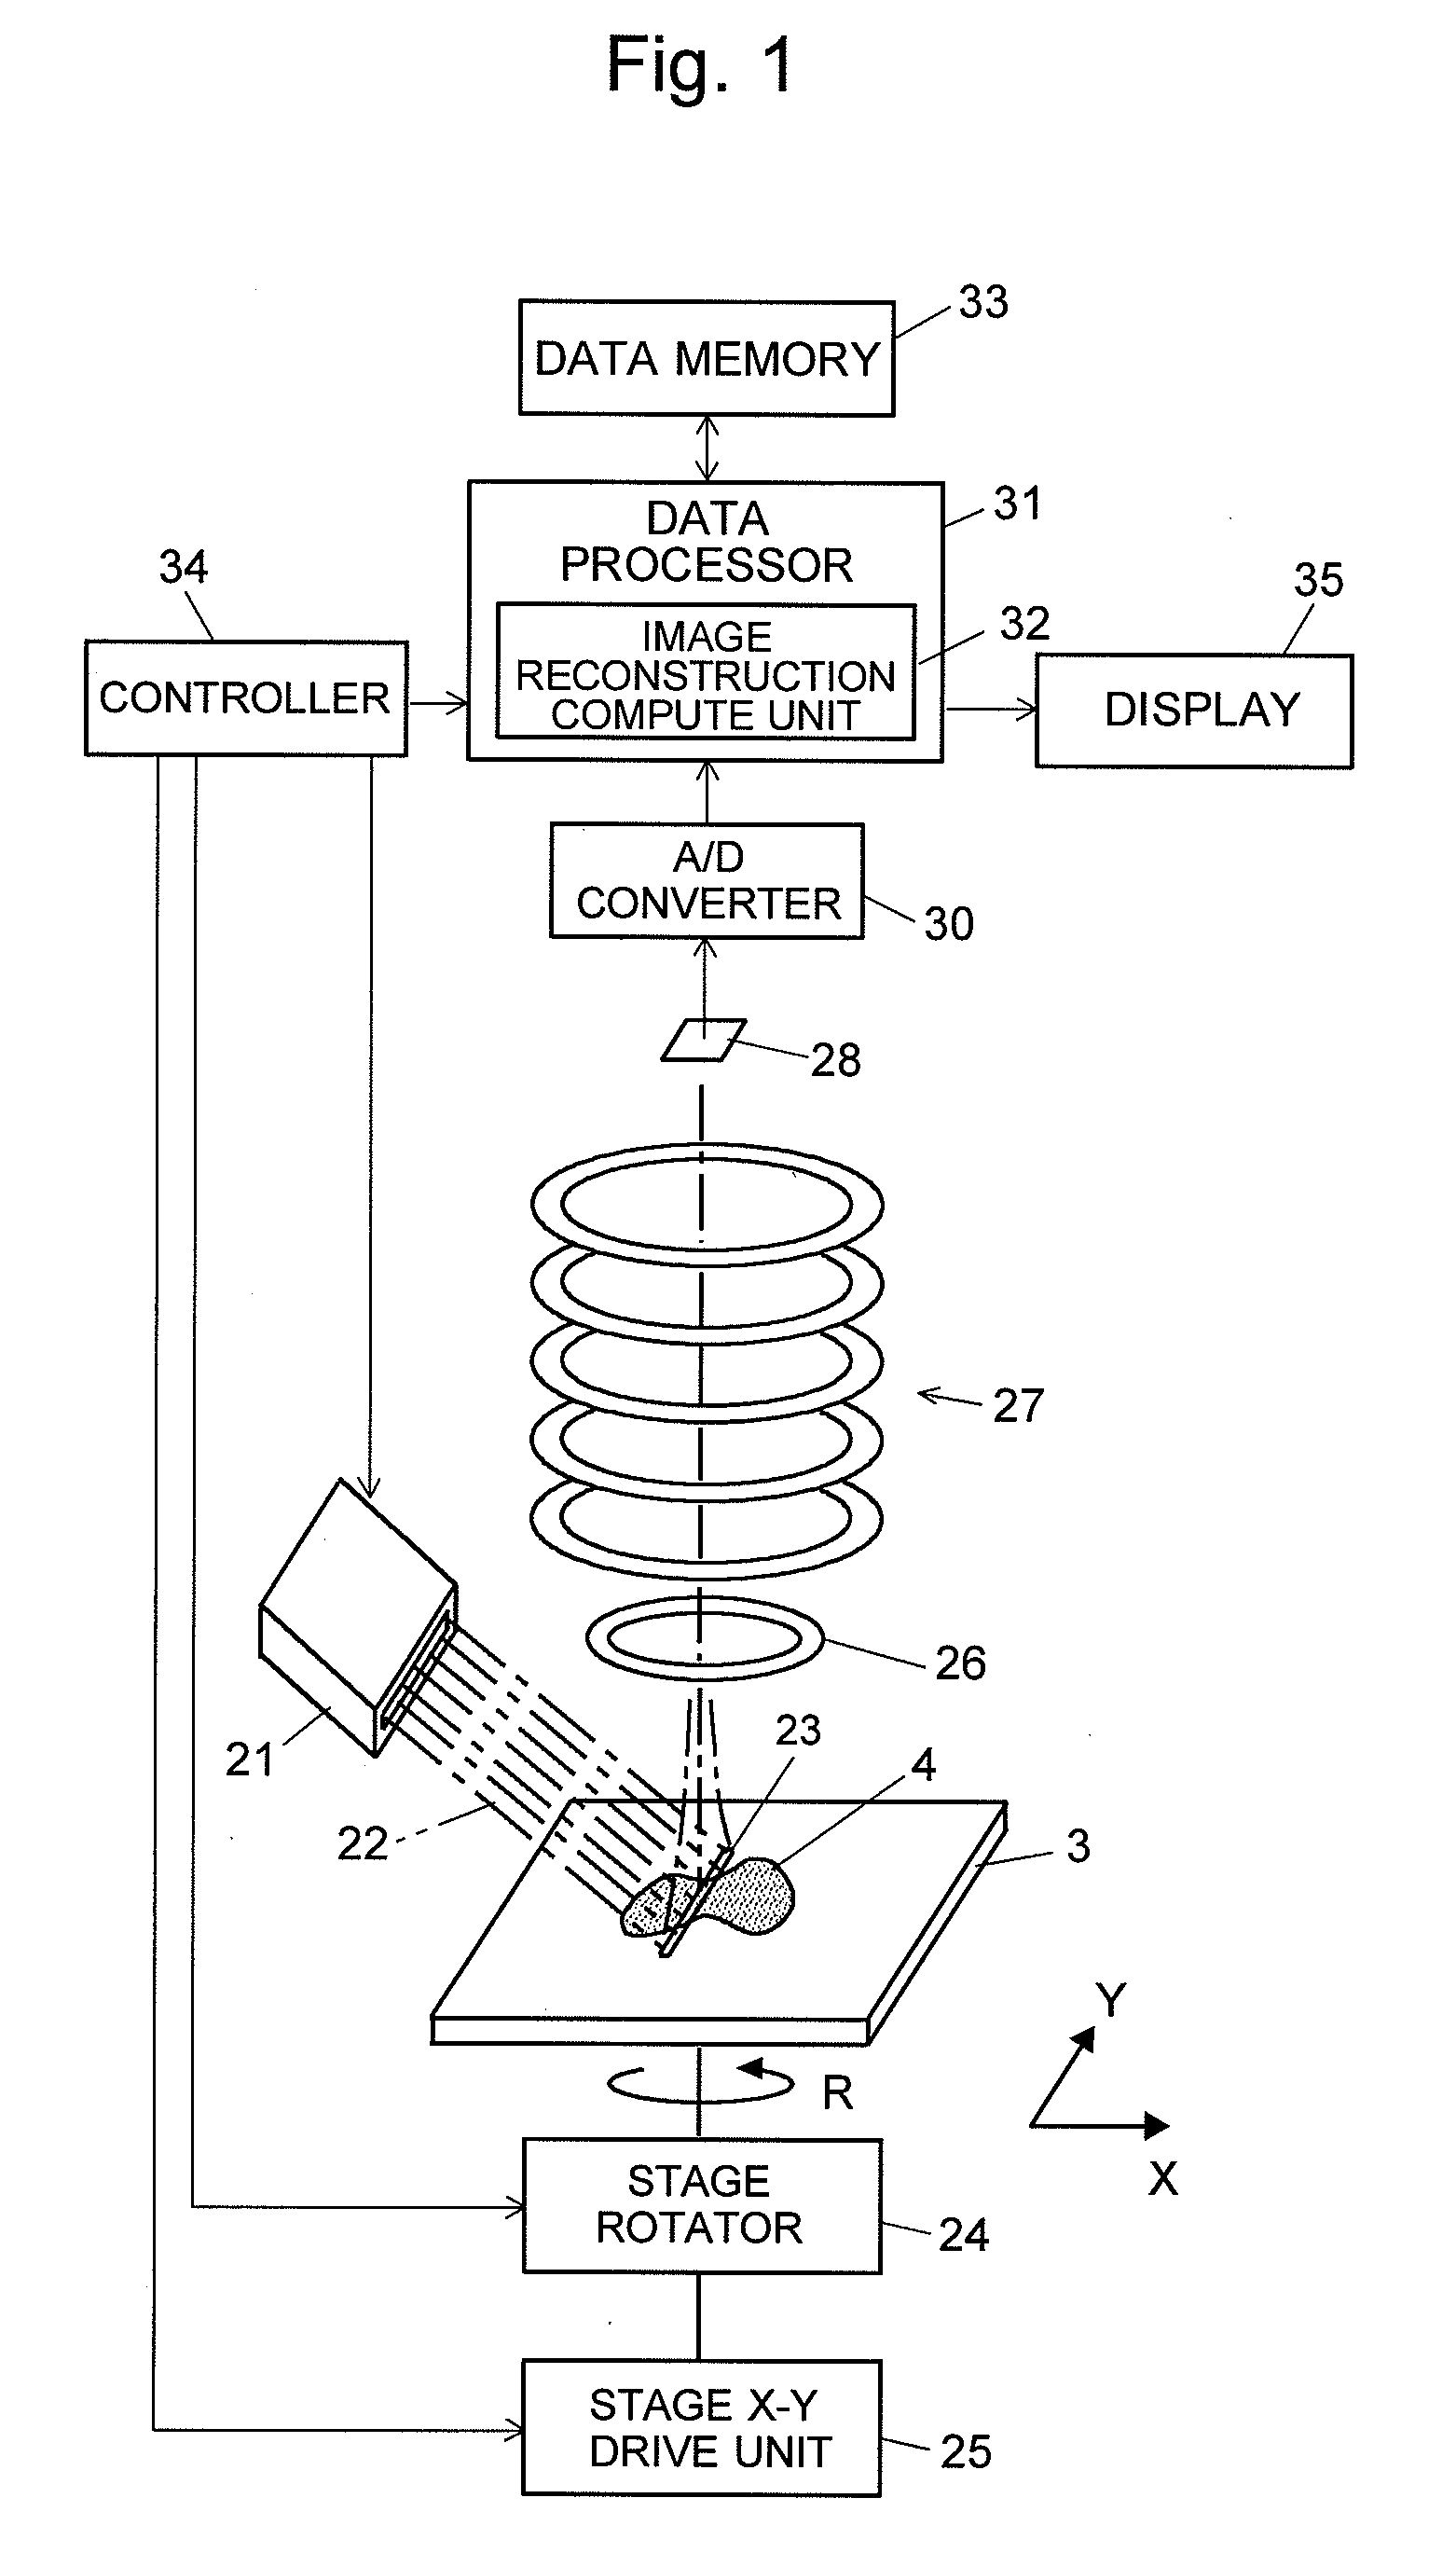
[0038]Regarding one embodiment of the mass spectrometer according to the first aspect of the present invention, its configuration and operation will be explained in detail. Hereinafter, this embodiment will be called the “first embodiment.”FIG. 1 is an overall configuration diagram of the mass spectrometer of the first embodiment. In FIG. 1, the same components as in previously-described FIGS. 6 and 7 are indicated with the same numerals and the explanations are omitted.

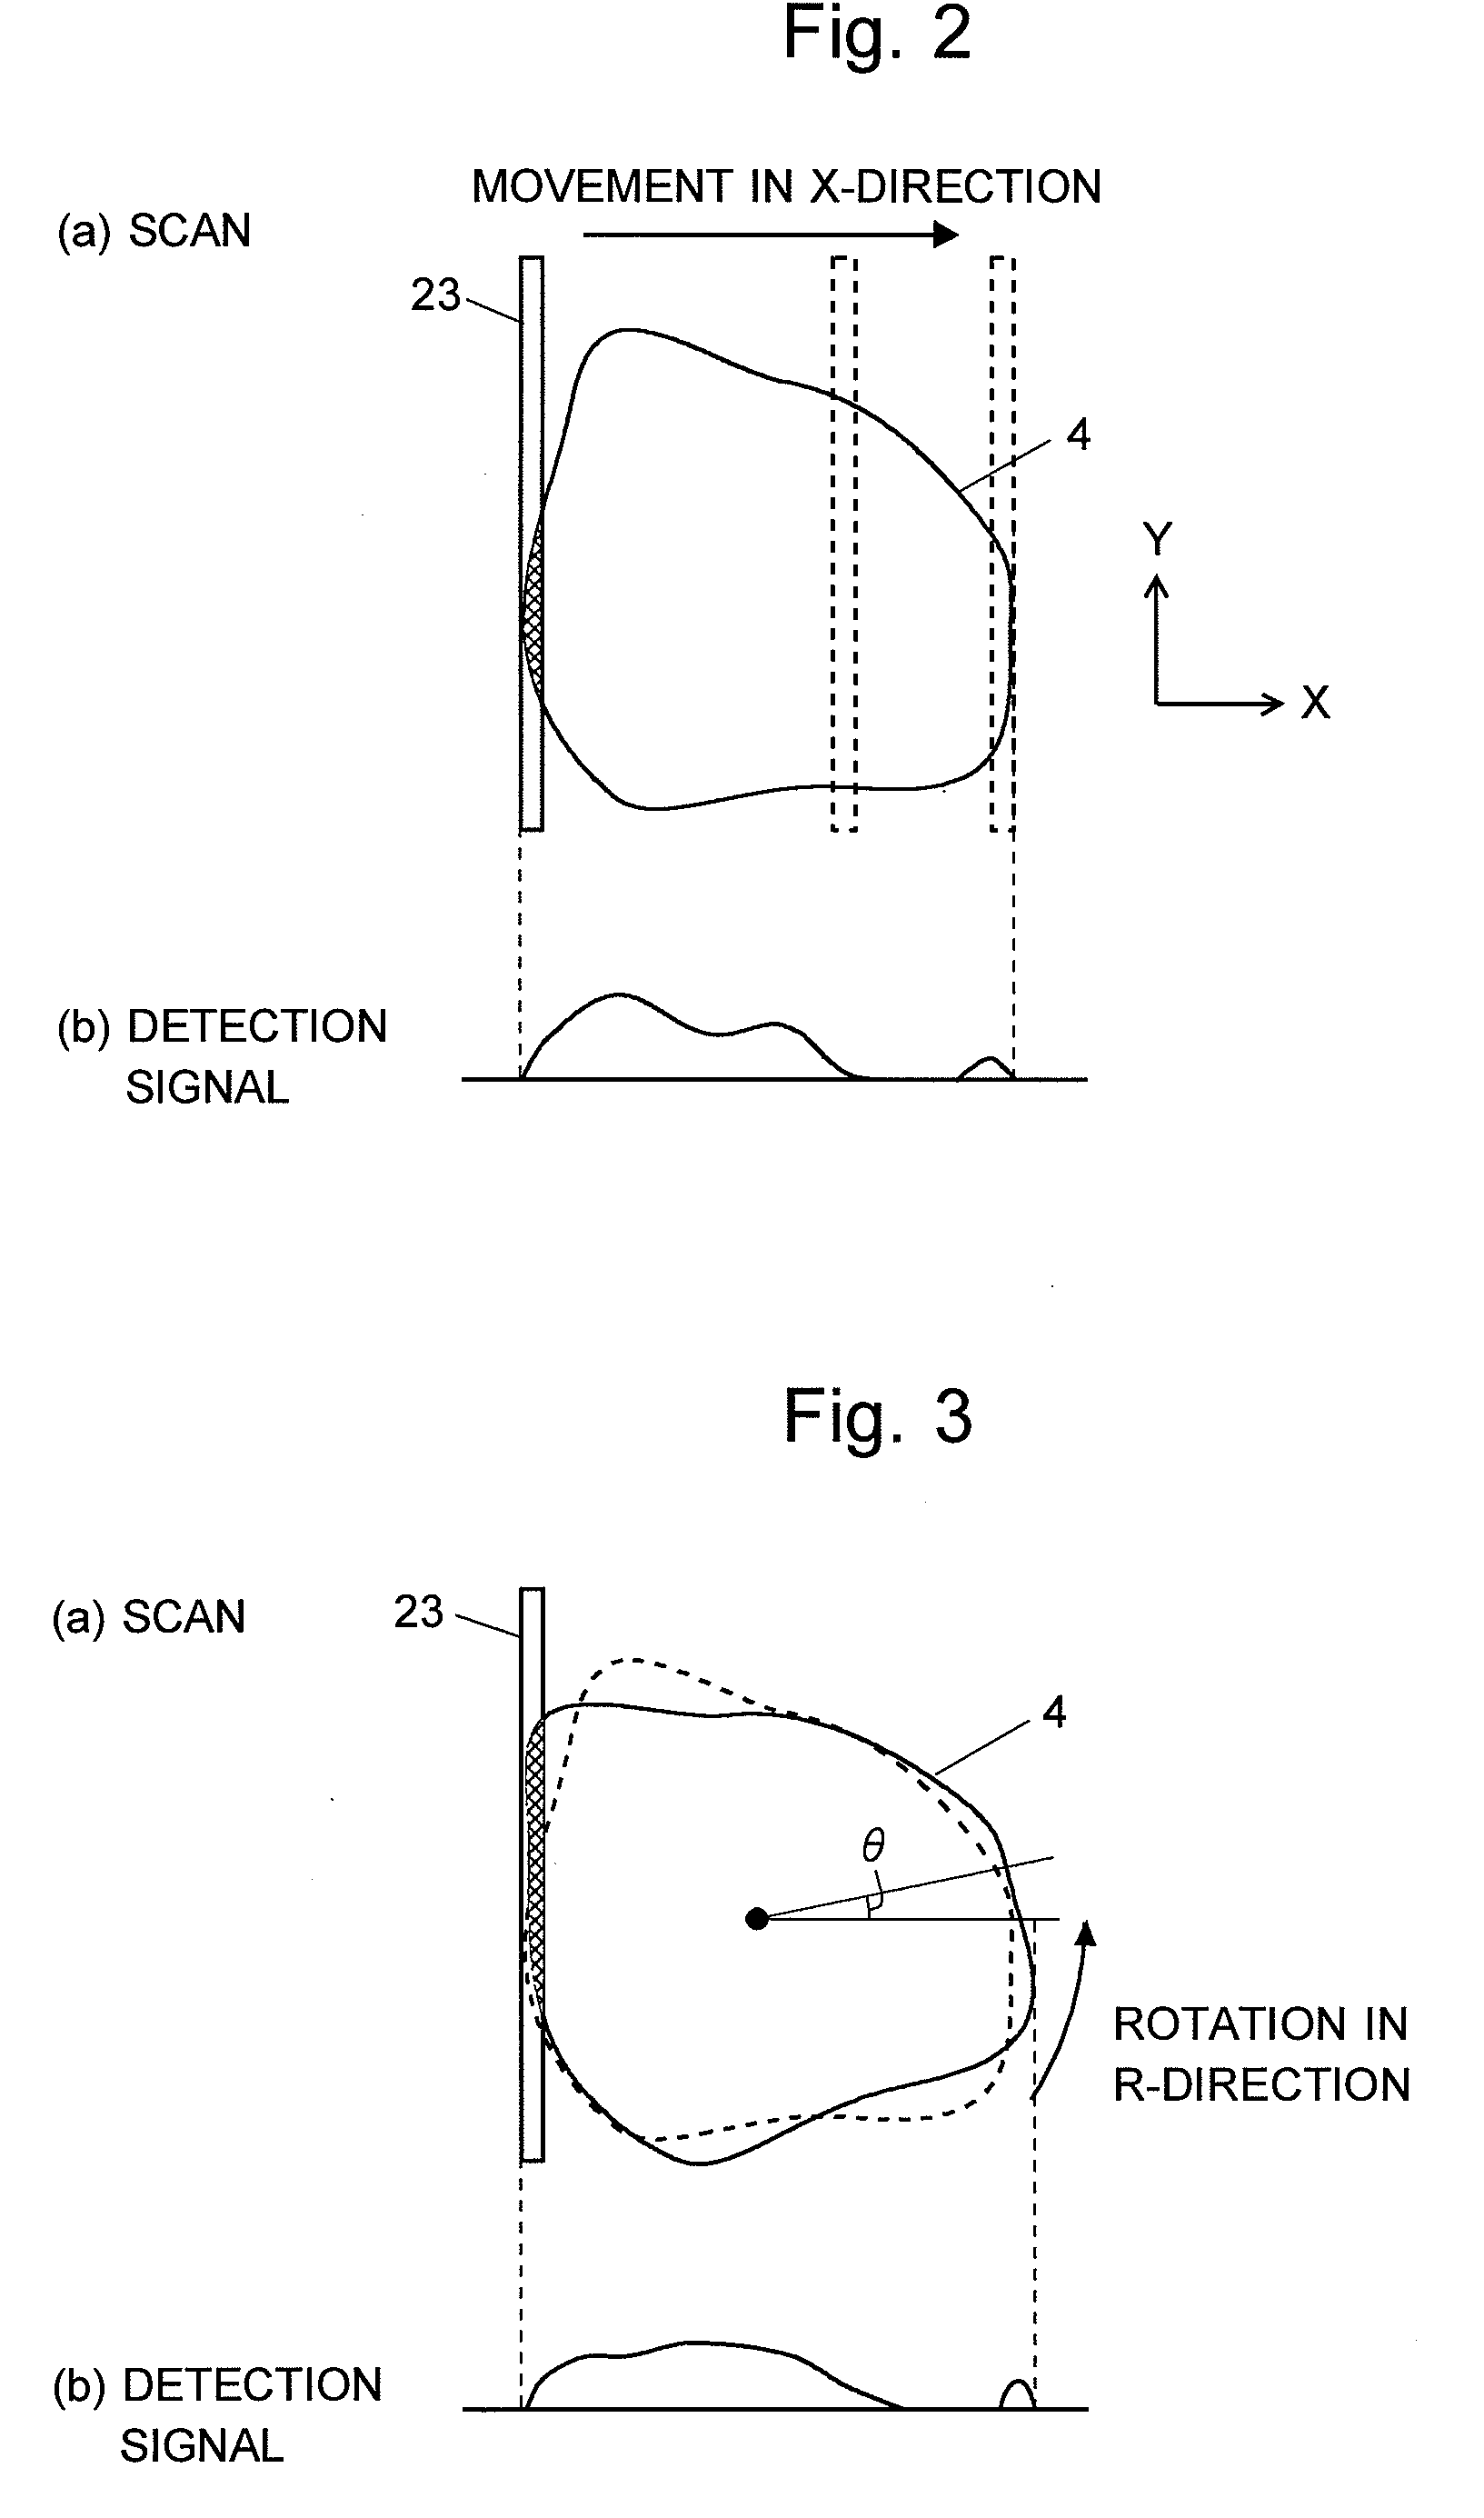
[0039]In the mass spectrometer according to the present invention, the laser irradiator 21 delivers a laser light 22 onto a linear area having a predetermined length (i.e. one-dimensional area). The sample stage 3 can be rotated in the R-direction around the axis perpendicular to the stage surface by the stage rotator 24, and the sample stage 3 is also linearly movable, at each rotational position determined by the rotation as just described, in the x-axis and y-axis directions by the stage X-Y drive unit 25.

[0040]Wh...

second embodiment

[0050]Regarding one embodiment of the mass spectrometer according to the second aspect of the present invention, its configuration and operation will be explained in detail. Hereinafter, this embodiment will be called the “second embodiment.”FIG. 4 is an overall configuration diagram of the mass spectrometer of the second embodiment. In FIG. 4, the same components as in the previously described FIGS. 1, 6 and 7 are indicated with the same numerals and the explanations are omitted.

[0051]In the mass spectrometer according to the present embodiment, the laser light 42 diffusing to some extent is delivered onto the sample 4 from the laser irradiator 41. The ions generated from the irradiated area 43 on the sample 4 are collected by the ion collector 26 and introduced, in a mixed state, to the mass separator 27. In this mass spectrometer, the following two operations are completely different from those in the first embodiment: the scanning by the stage X-Y drive unit 25 for driving the s...


PUM


Abstract

A laser light is linearly delivered onto the sample 4. The ions generated from the irradiated area are collected, mass-separated in the mass separator 27, and detected by the detector 28. A mass analysis is repeated while moving the sample stage 3 by a predetermined step width in the x-axis direction so that the one-dimensional mass spectrum information of the sample 4 at a certain rotational position is obtained. Additionally, while the sample 4 is rotated by a predetermined angle, the same measurement is repeated for the entire perimeter, so that the one-dimensional mass spectrum information at each rotational position is obtained. Based on the data obtained in this manner, a reconstruction computational processing is performed by the CT method to reconstruct the two-dimensional distribution image for a substance having a certain mass for example and the image is displayed on the display 35.

Description

TECHNICAL FIELD[0001]The present invention relates to a mass spectrometer for mass-analyzing a one-dimensional area or a two-dimensional area on a sample in order to study the substance distribution or other data in the one-dimensional area or two-dimensional area.BACKGROUND ART[0002]Mass spectrometers are an apparatus for ionizing molecules and atoms of a sample component included in a gaseous, liquid or solid sample, and separating the ions in every mass-to-charge ratio to detect them in order to identify the sample component or determine the component amount. It is widely used today for a variety of purposes such as the determination of biological samples and analysis of protein or peptide.[0003]In the fields of biochemistry and medicine, which treat living organisms, there is a great demand for obtaining the distribution information of protein included in a cell in vivo without destroying the cell. In order to meet such a demand, a mass microscope which has both the function of ...

Claims


Application Information

Patent Timeline
Patent Type & Authority Applications(United States)
IPC IPC(8): H01J49/00
CPCH01J49/0004
Inventor YAMAGUCHI, SHINICHI
Owner SHIMADZU CORP
Learn More