Medical Data Display

a medical data and display technology, applied in the field of medical data display, can solve the problems of long-term consequences for the health of patients, distress and inconvenience of sufferers, and the management of these conditions is a significant drain on healthcare budgets, and achieves the effect of easy observation of the quality of control of the condition through the use of pharmacological agents

Inactive Publication Date: 2010-10-14
E SAN LTD
View PDF23 Cites 168 Cited by
  • Summary
  • Abstract
  • Description
  • Claims
  • Application Information

AI Technical Summary

Benefits of technology

[0029]This aspect of the invention is particularly useful in forming an educational tool whereby the qualit

Problems solved by technology

The management of these conditions represents a significant drain on healthcare budgets and, of course, the conditions themselves cause distress and inconvenience for the sufferers.
While the managing of diabetes from day-to-day is inconvenient for the patient, mis-management of the condition also has long-term consequences for the patient's health.
From day-to-day it is important that the patient does not become hypoglycaemic (blood sugar level too low—leading to confusion and fainting), but for the long-term health of the patient it is important that they are not hyperglycaemic (blood sugar level generally too high) because this gives rise to long-term kidney problems, nerve damage, poor circulation, blindness and a high risk of stroke.
Early proposals based on the use of a telephone for self-reporting with readings transferred onto a home computer by the patient, or a monitoring device connected to a modem for data transmission have not proved in practice to be useful.
The systems generally require the clinicians to review all of the data once a day, or

Method used


Image

  • Medical Data Display
  • Medical Data Display
  • Medical Data Display

Examples


first embodiment

[0041]FIGS. 3(A) and (B) illustrate alternative versions of a display according to the invention for use by an asthma sufferer. The display consists of a first graphical element 30 in the form of a scale colour-coded from red at the left-hand side through amber and yellow to green at the right-hand side. FIG. 3(A) shows an arcuate version of the scale and FIG. 3(B) a straight version. As will be explained below, the scale is not fixed but is based on a model of normality for the particular patient. It therefore differs from a traditional fixed scale or a representation of such a fixed scale. The display includes a second graphical element 32, in this case in the form of a needle, which is used to indicate the current, i.e. today's, condition of the patient. This display is based on indicating to the patient a peak flow reading as obtained from a peak flow meter.

[0042]The second graphical element 32, the needle, will be displayed pointing to a position on the scale representing the c...

second embodiment

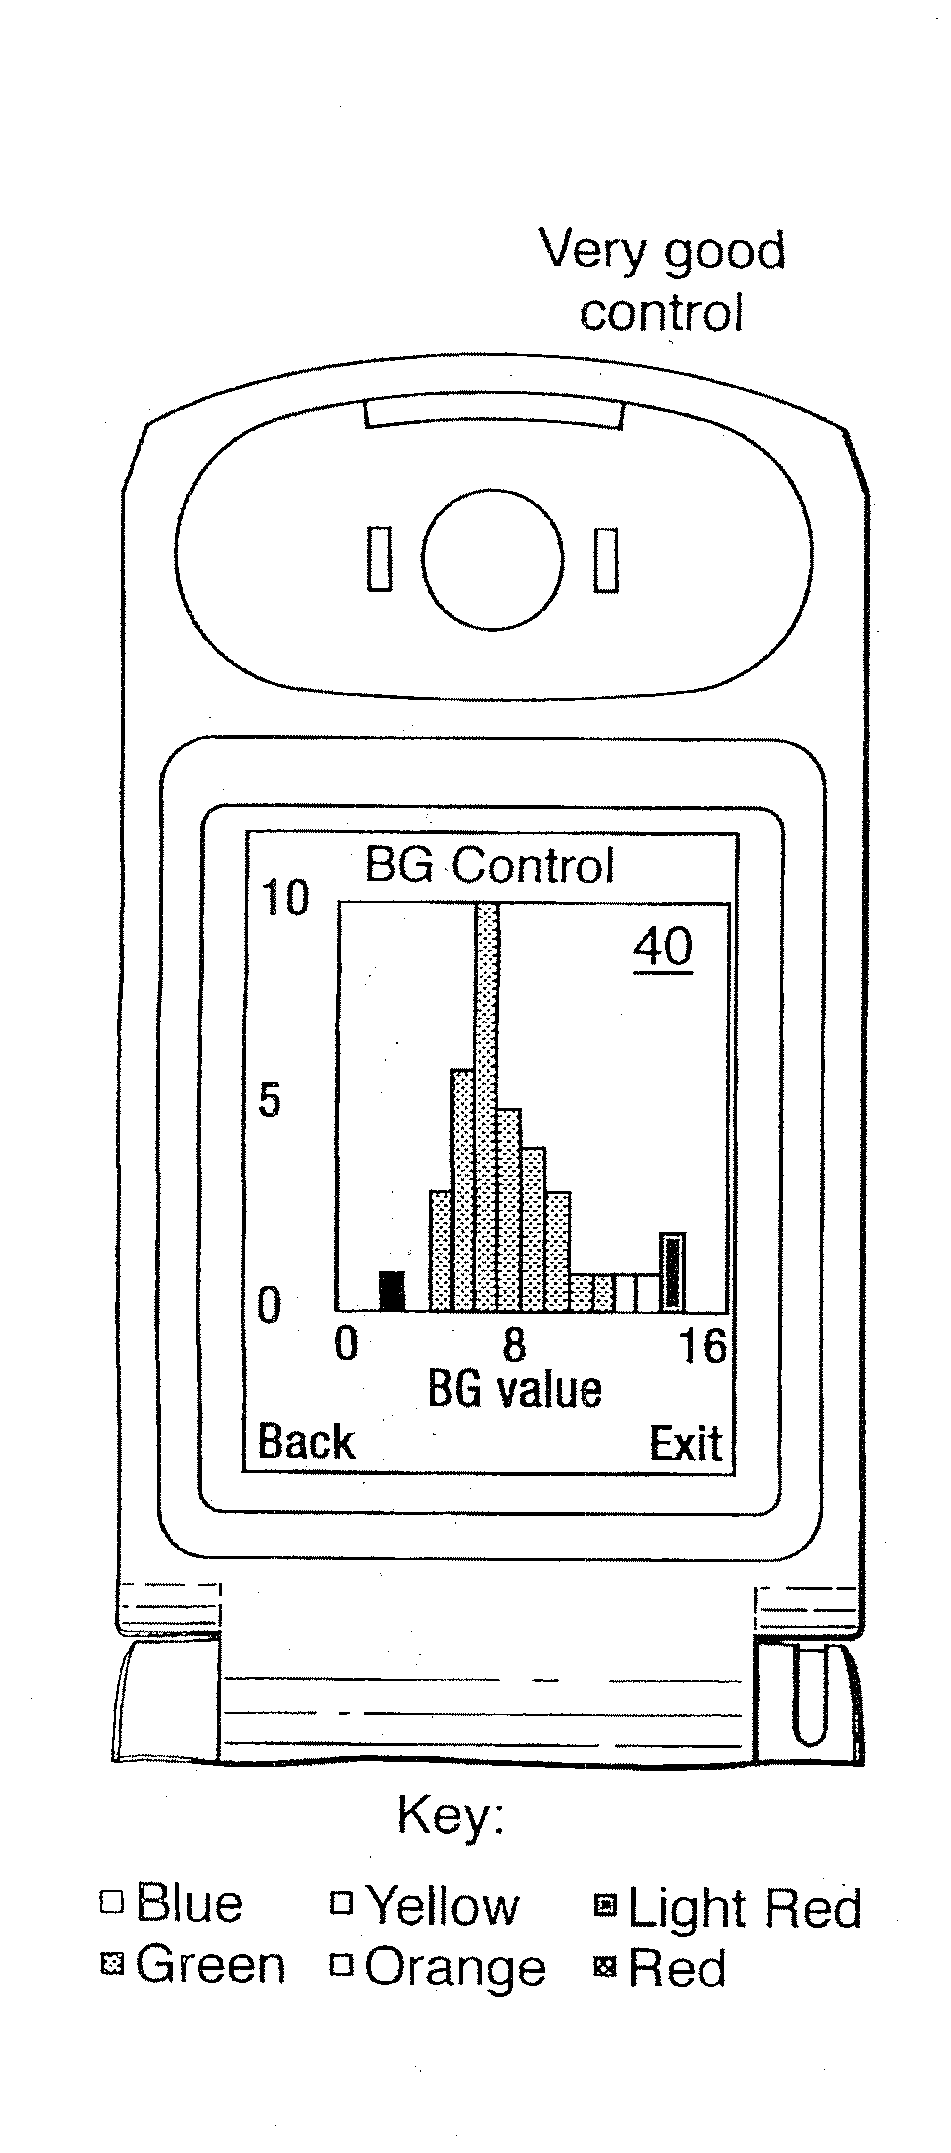
[0048]FIGS. 4(A) to (C) illustrate the invention which is useful for diabetes sufferers. In FIGS. 4(A), (B) and (C) the display shows a histogram 40 of blood glucose measurements taken by the patient. Thus the blood glucose value is plotted along the horizontal axis, with the frequency of occurrence of that value plotted vertically. The histogram contains the most recent 2 weeks worth of readings (usually 56 readings at 4 readings per day). The horizontal axis is autoscaled so as to show the full range of readings obtained. Thus a patient with good blood glucose control will tend to see a smaller range of values on the horizontal axis (0-16 in FIG. 4A) than a patient with less good control (0-20 in FIG. 4B) or poor control (0-23 in FIG. 4C). The histogram is also colour-coded according to a patient specific model of normality, in this case comprising thresholds for hypo and hyperglycemia for that patient. These target thresholds are set by a clinician by agreement with the patient o...

case 1

[0062]in which the patient is taking a reading in the morning and has taken one the previous evening (in this case the display of FIG. 7B only is shown);


PUM


Abstract

A method of displaying medical data, particularly data representative of the condition of patients suffering from chronic medical conditions such as asthma, diabetes and hypertension. The display consists of two graphical elements, one of which indicates the current value of a parameter indicative of the patient's condition, this being displayed against another graphical element which represents a model of normality for that patient. The graphical element indicating the current condition may be, for example, a needle, against a scale which is constructed according to the patient-specific model of normality. This is particularly advantageous in the case of displays which have a small display area, such as mobile telephones and PDAs. Other forms of display are disclosed, such as histograms with the display being dynamically colour-coded and auto-scaled, or displays including limits which may vary. Another form of display is also disclosed which illustrates administrations of a pharmacological agent and corresponding measurements of the patient's condition, with a visual link such as colour-coding linking the administration to the corresponding condition measurement. For example several days of insulin administration dosages may be displayed alongside several days of blood glucose measurements, with the administrations colour-coded to the corresponding blood glucose measurement, to assist the patient in determining whether the insulin administration is stably controlling their condition.

Description

CROSS-REFERENCES TO RELATED APPLICATIONS[0001]This application is a divisional of U.S. patent application Ser. No. 10 / 592,802, filed Nov. 30, 2006, pending, which is the U.S. national phase of PCT International Patent Application No. PCT / GB2005 / 000980 filed Mar. 15, 2005 which designated the U.S. and claims the benefit of Great Britain Patent Application No. 0405798.0 filed Mar. 15, 2004, the entire contents of each of which are hereby incorporated by reference in this application.STATEMENT REGARDING FEDERALLY SPONSORED RESEARCH OR DEVELOPMENT[0002](NOT APPLICABLE)BACKGROUND OF THE INVENTION[0003]The present invention relates to a method and apparatus for displaying medical data, particularly data indicative of the current state of a chronic medical condition in a form which can be delivered easily to a patient and is easily understandable by them.[0004]As many as 20% of the population in the Western world suffer from chronic medical conditions such as asthma, diabetes or hypertensi...

Claims


Application Information

Patent Timeline
IPC IPC(8): G06T11/20A61B5/00A61B5/087G16H10/60G16H20/10
CPCA61B5/0002A61B5/087A61B5/14532G06F19/3487G06F19/3418G06F19/3437G06F19/3456G06F19/3406G16H40/63G16H50/50G16H15/00G16H20/10G16H10/60
Inventor TARASSENKO, LIONELHAYTON, PAUL MICHAELGEORGE, ALASTAIR WILLIAM
Owner E SAN LTD
Why Eureka
Try Eureka