System and method for measuring analyte concentration with interferant correction

a technology of interferant correction and analyte, which is applied in the field of system and method for measuring analyte concentration with interferant correction, can solve the problems of reducing the rate of chemistry dissolution, interfering with the accuracy of test, and affecting the accuracy of test results

Inactive Publication Date: 2011-06-16
TAIDOC TECH CORP
View PDF10 Cites 129 Cited by
  • Summary
  • Abstract
  • Description
  • Claims
  • Application Information

AI Technical Summary

Benefits of technology

[0012]In order to solve the above noted conventional problems, one aspect of the present invention is to provide a biosensor strip, biosensing meter, system and method that is measurement of hematocrit and analyte concentration at two electrode sets

Problems solved by technology

An important limitation of electrochemical methods of measuring the concentration of the analyte in blood is the effect of confounding variables on the diffusion of analyte and the various active ingredients of the reagent.
Electrochemical method has a problem that the accuracy of the test is interfering by hematocrit (a ratio of the volume of packed red blood cells to the total blood volume).
At high hematocrit, the red blood cells may impede the reaction of enzymes and electrochemical mediators, reduce the rate of chemistry dissolution since there less plasma volume to solvate the chemical reactants, and slow diffusion of the mediator and then cause a slower current result.
However, the method of '811 is providing AC and DC signals to a sample in the same reaction zone and further used only

Method used


Image

  • System and method for measuring analyte concentration with interferant correction
  • System and method for measuring analyte concentration with interferant correction
  • System and method for measuring analyte concentration with interferant correction

Examples


example 1

Whole Blood and Plasma Measurement with Different Frequencies, Amplitudes and Time of the Excitation to Obtain Hematocrit Level

[0103]This example applied an AC with DC offset signal with different frequencies and different amplitudes to a sample within a biosensor strip. The frequencies were 1, 2, 3 and 4 kHz and the amplitudes were 0.5, 1 and 1.5V. The samples were whole blood and plasma and detect the current values at 5 and 10 seconds. The hematocrit levels were calculated and the result was shown in FIGS. 7 and 8.

[0104]Referring to FIG. 7, left is whole blood result and right is plasma result. Detect the current values after 5 seconds when apply an AC signal with different frequencies and amplitudes. Compare difference between whole blood and plasma.

[0105]Referring to FIG. 8, left is whole blood result and right is plasma result. Detect the current values after 5 and 10 seconds when apply an AC signal with 2 and 4 kHz frequencies and different amplitudes. Compare the difference ...

example 2

Current Versus Hematocrit Relationship Measurement

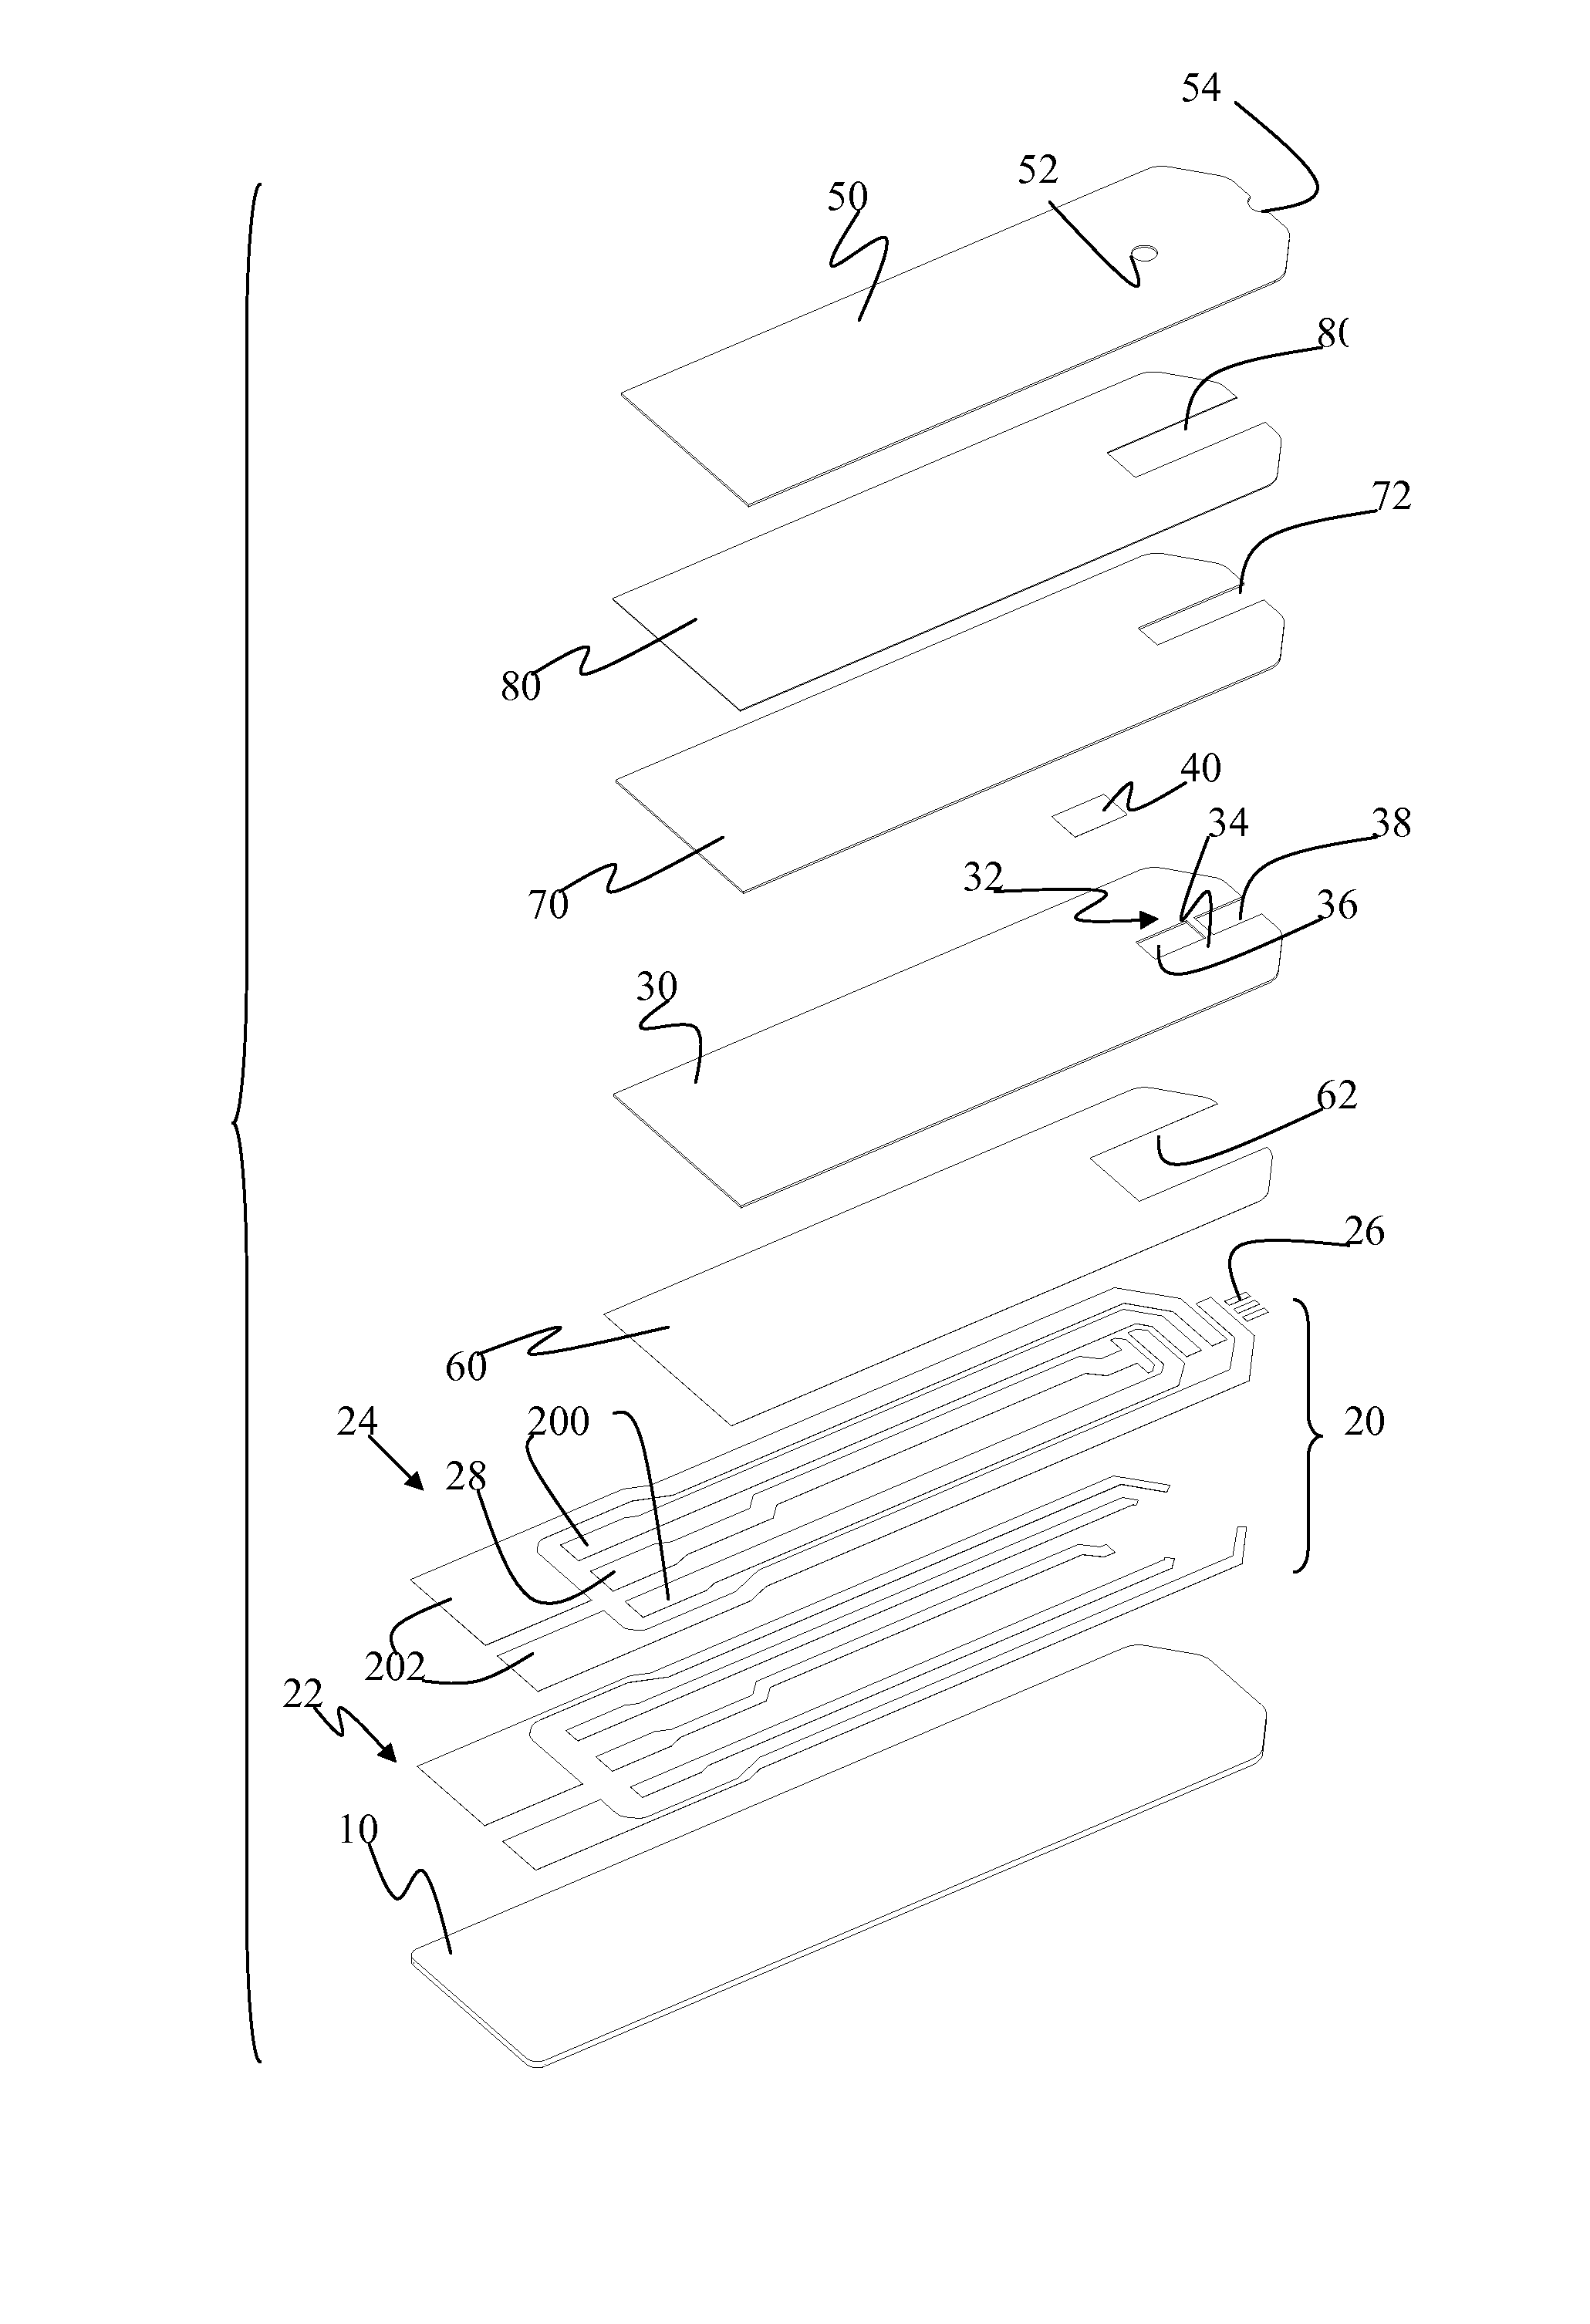
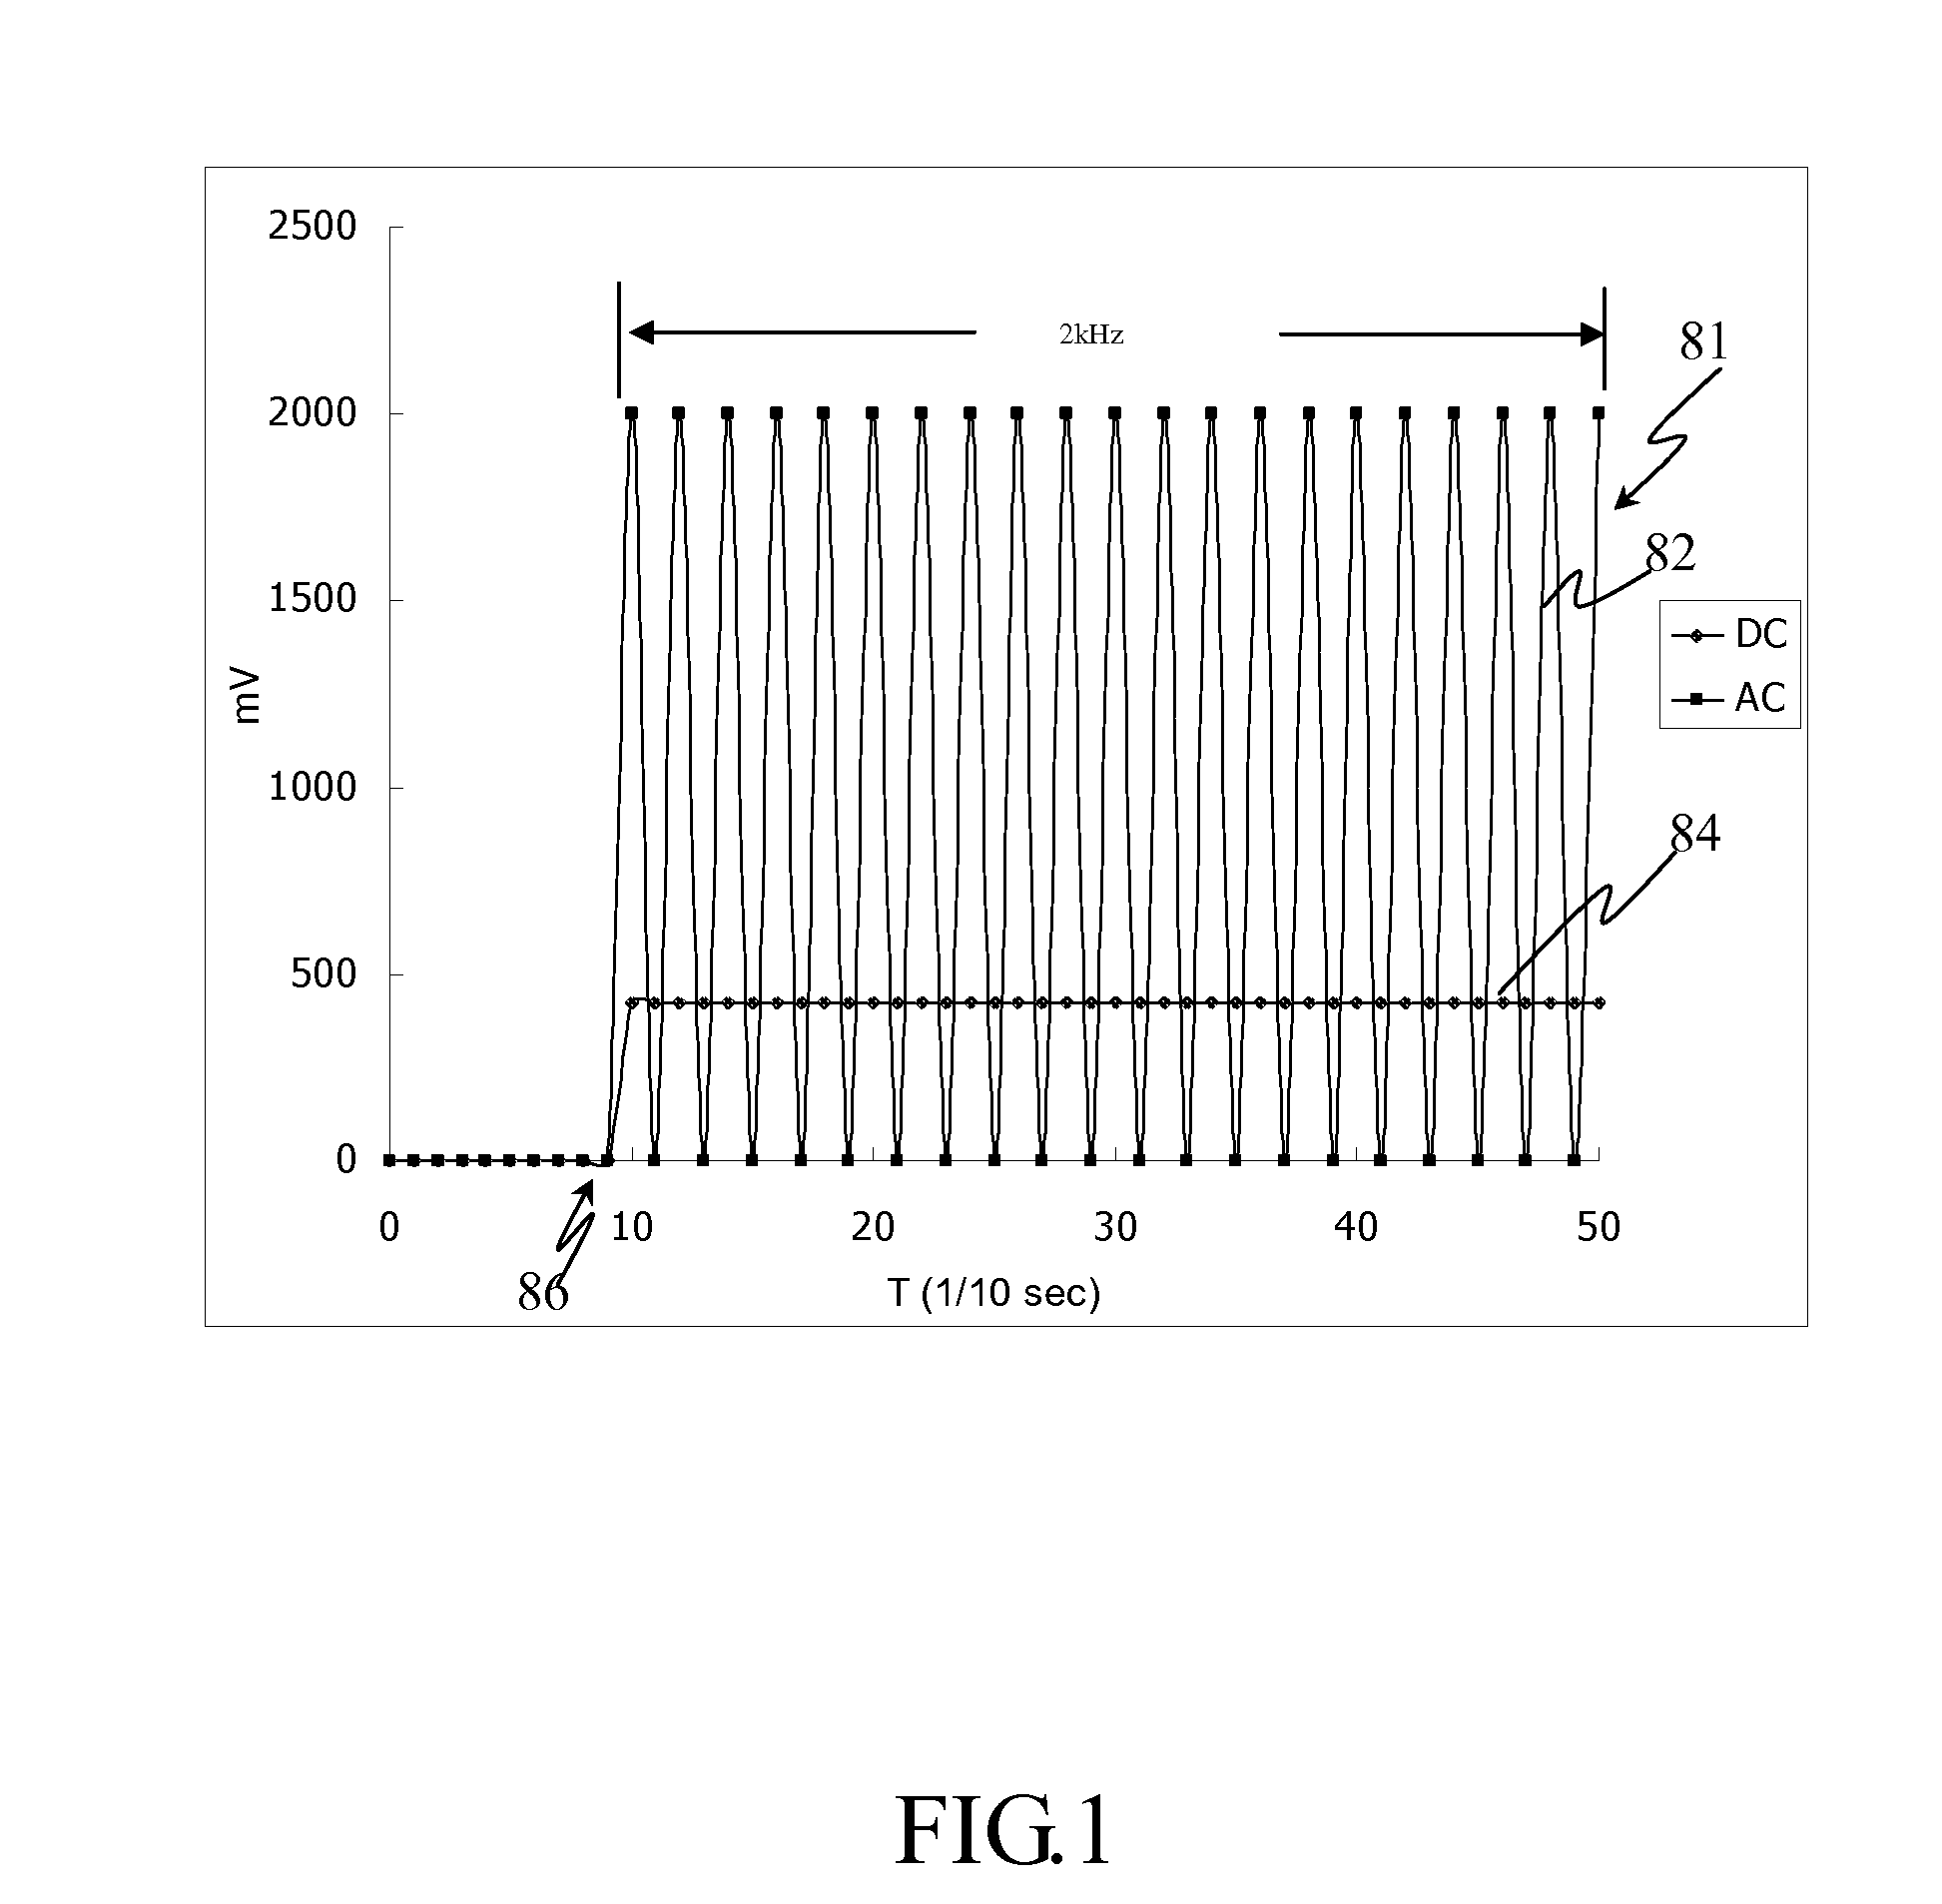
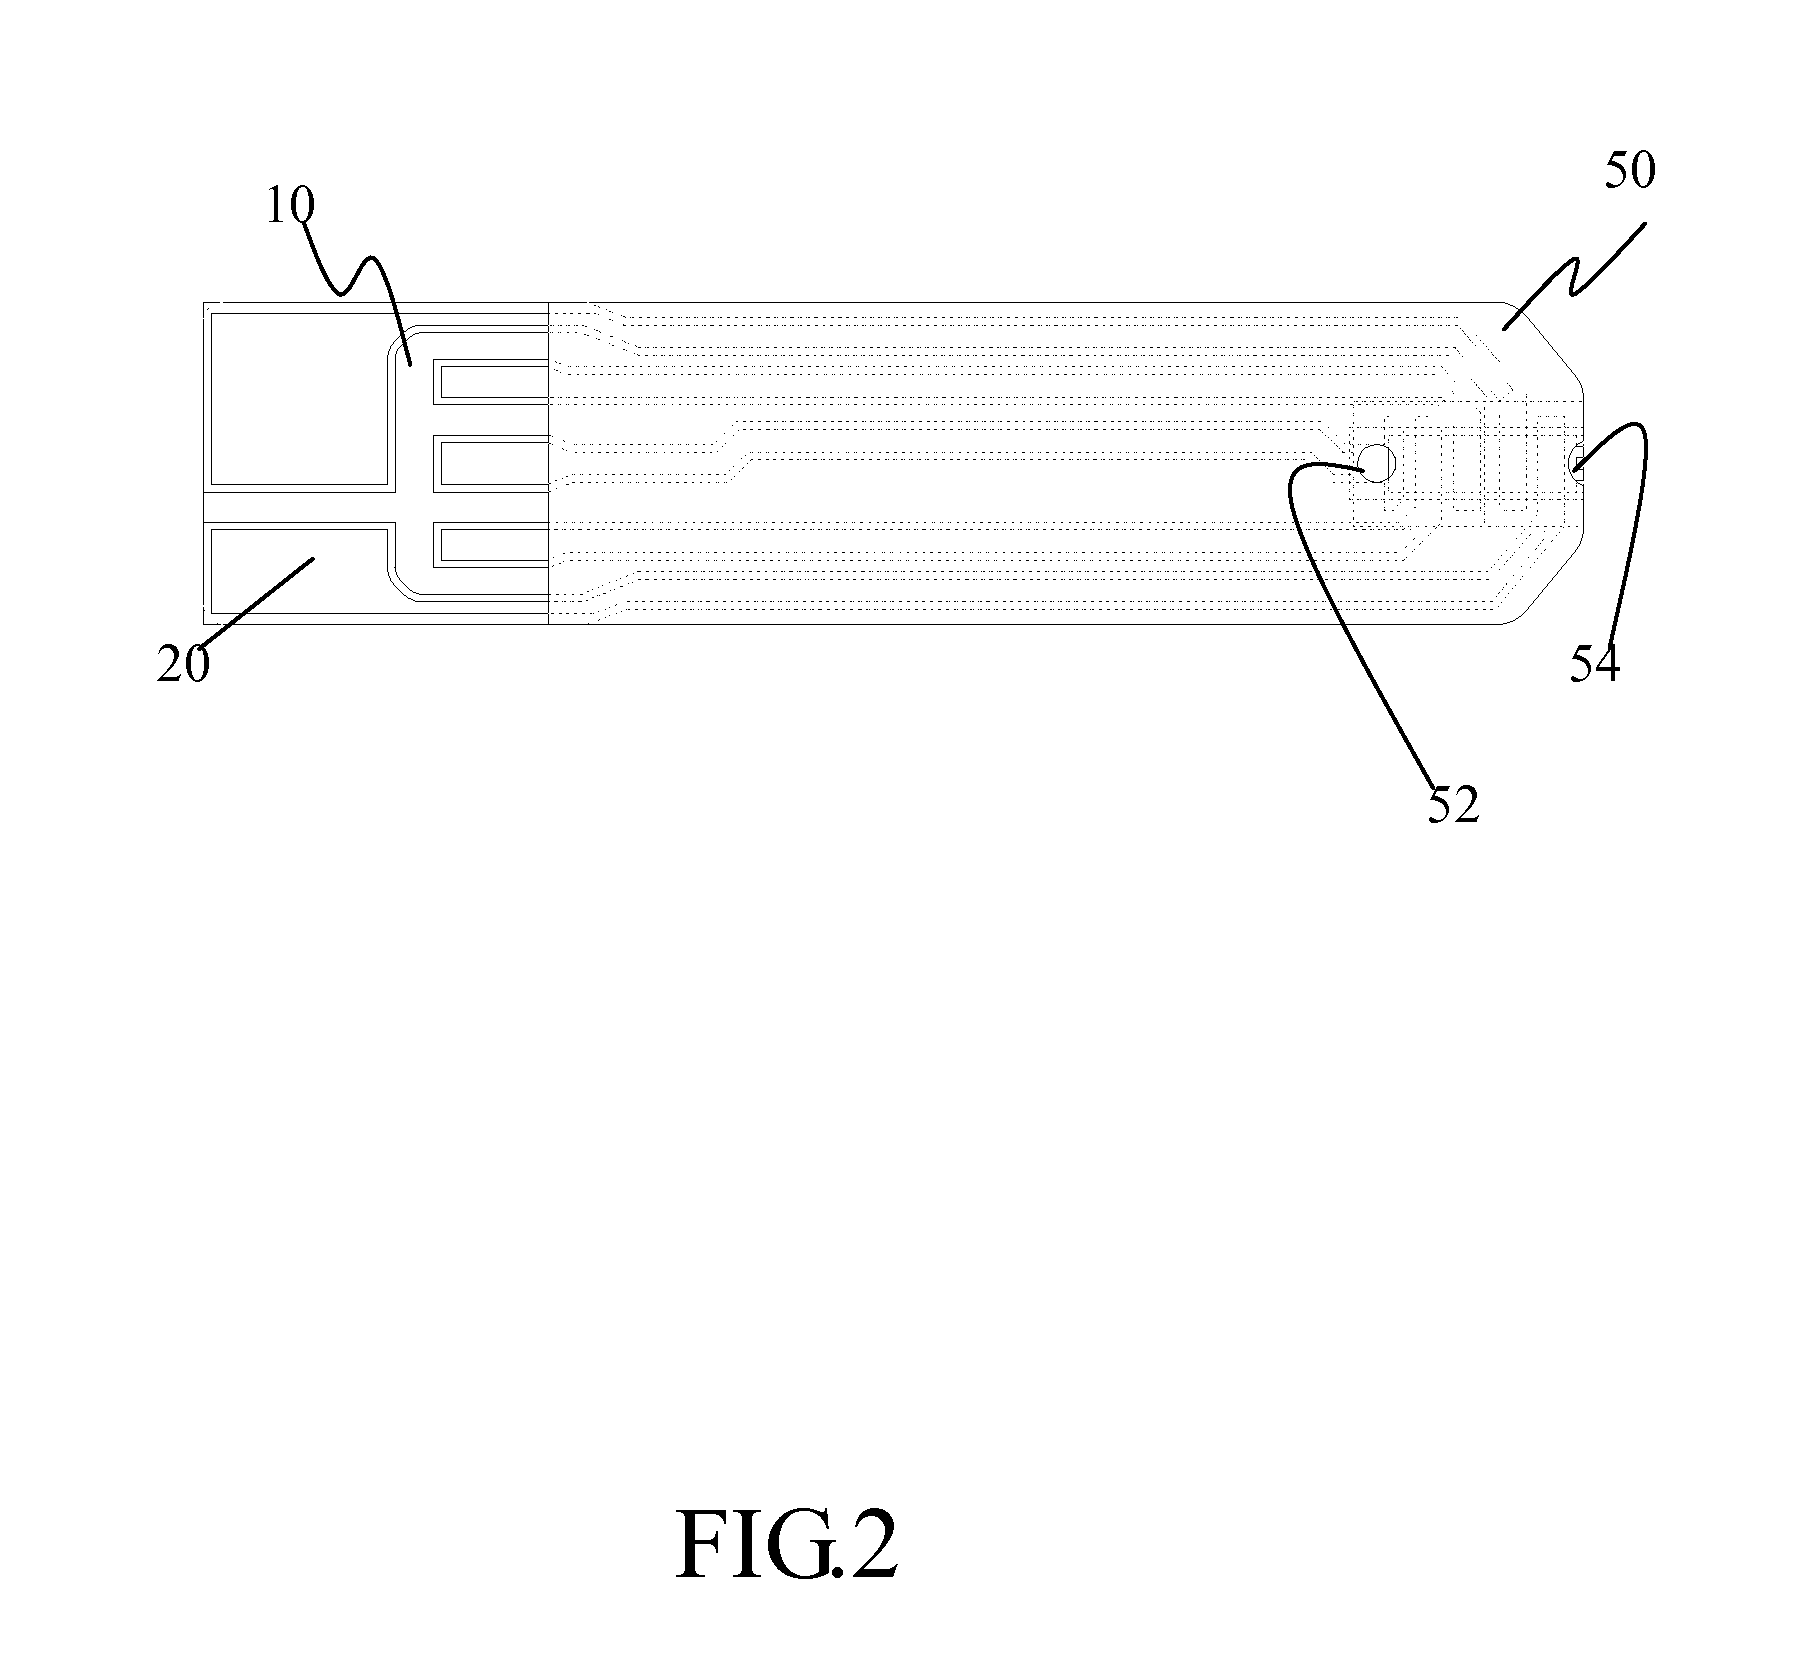
[0106]This example used biosensor strips like FIG. 2 of the present invention. Apply an AC with DC offset signal to samples within biosensor strips. The signal comprised a frequency of 2 kHz and amplitude of 1 V. Detect the current value after 5 seconds with different hematocrit levels of samples and repeat three times. Compare the current and the hematocrit levels and the result was shown in FIG. 9.

[0107]Referring to FIG. 9, it can obtain a relationship curve between current and hematocrit level by measuring the sample three times and measuring different samples.

example 3

Measurement Hematocrit Level by Utilizing a Reaction Reagent Covered on a First Electrode Set and a Second Electrode Set of a Biosensor Strip

[0108]This example utilized a biosensor strip like FIG. 2 except a reaction reagent is covered on the first electrode set and the second electrode set. The hematocrit levels of samples are 0, 20, 45 and 65%.

[0109]When measurement, sample received by capillarity to the reaction reagent of the biosensor strip. Apply a DC signal to the first electrode set and an AC with DC offset signal to the second electrode set, and then measure the current value at the desired time to repeat eight times.

[0110]Referring to FIG. 10, it is a current and hematocrit relationship curve of this example. The result showed a big deviation if the reaction reagent is covered on the first electrode set and the second electrode set.


PUM

PropertyMeasurementUnit
Timeaaaaaaaaaa
Electric potential / voltageaaaaaaaaaa

Abstract

The present invention is related to an electrochemical biosensing test strip, biosensing meter, system and method for analyte measurement incorporating a hematocrit correction. The biosensor strip comprises a first and a second electrode sets respectively for detecting analyte concentration and hematocrit level. The first and second electrode sets are respectively corresponding to different reaction zones and a reaction reagent is only formed on the first electrode set corresponding reaction zone. Applying a first signal comprising a DC component and a second signal comprising an AC component that has a constant frequency respectively to the first and second electrode sets can respectively detect an uncorrected analyte concentration and hematocrit level. Therefore, the corrected analyte concentration is more accurate by incorporating the hematocrit correction.

Description

BACKGROUND OF THE INVENTION[0001]1. Field of the Invention[0002]The present invention relates in general to a system and method for measuring analyte concentration with interferant correction. More particularly, the present invention relates to a biosensing meter, biosensor strip, system and method for measuring analyte concentration with hematocrit correction by applying AC and DC signals simultaneously.[0003]2. Description of the Related Art[0004]Since the improvement of the science and technology, many tests can be operated by users at home. In the market, many disposable strips are used for measuring specific components in a biological fluid and can be operated by users at home. Analytical biosensor strips are useful in chemistry and medicine to determine the presence and concentration of a biological analyte. Such strips are needed, for example, to monitor glucose in diabetic patients and lactate during critical care events. In the recent year, Diabetes is a modern disease, esp...

Claims


Application Information

Patent Timeline
IPC IPC(8): G01F1/64G01N33/487
CPCG01N27/3274
Inventor CHOU, TAI-CHENGWU, CHIA-CHILEE, TSAI-YUNCHEN, CHAO-WANG
Owner TAIDOC TECH CORP
Why Eureka
Try Eureka