Method and system for improving characteristic peak signals in analytical electron microscopy

a characteristic peak signal and electron microscopy technology, applied in material analysis using wave/particle radiation, photoelectric discharge tubes, instruments, etc., can solve the problems of increasing the increasing the stochastic noise and uncertainty of quantitative measurements, and being extremely difficult to quantify

Active Publication Date: 2013-09-19
NANOMEGAS SPRL +2
View PDF12 Cites 11 Cited by
  • Summary
  • Abstract
  • Description
  • Claims
  • Application Information

AI Technical Summary

Benefits of technology

[0020]In another embodiment, a system is disclosed comprising an external beam control device configured to deliver beam scanning protocol signals to the beam deflection control circuits of the electron microscope, with the external beam control device comprising digital to analog converters (“DACs”), each DAC configured to deliver the beam scanning protocol signals to one of the

Problems solved by technology

The strength of signal associated with a given peak or peaks, and thus the accuracy and sensitivity of the measurement of the concentration of a given element, can be affected by a range of factors, including local sample composition and morphology, the spatial/energy profile and coherence of the incident beam, and the resolution and other characteristics of the X-ray or EELS detection system, that, taken together, can be extremely difficult to quantify.
This can be deliberate—for example, when obtaining atomic resolution images in TEM/STEM or seeking information about crystallographic defects, such as grain boundaries or interfaces—or can occur accidentally, particularly when investigating polycrystalline materials comprised of crystallites having a range of different orientations.
In general, however, channeling makes it more difficult to extract meaningful compositional information from crystalline samples.
Having a beam orientation close to a zone axis can also redu

Method used


Image

  • Method and system for improving characteristic peak signals in analytical electron microscopy
  • Method and system for improving characteristic peak signals in analytical electron microscopy
  • Method and system for improving characteristic peak signals in analytical electron microscopy

Examples


example 1

EELS

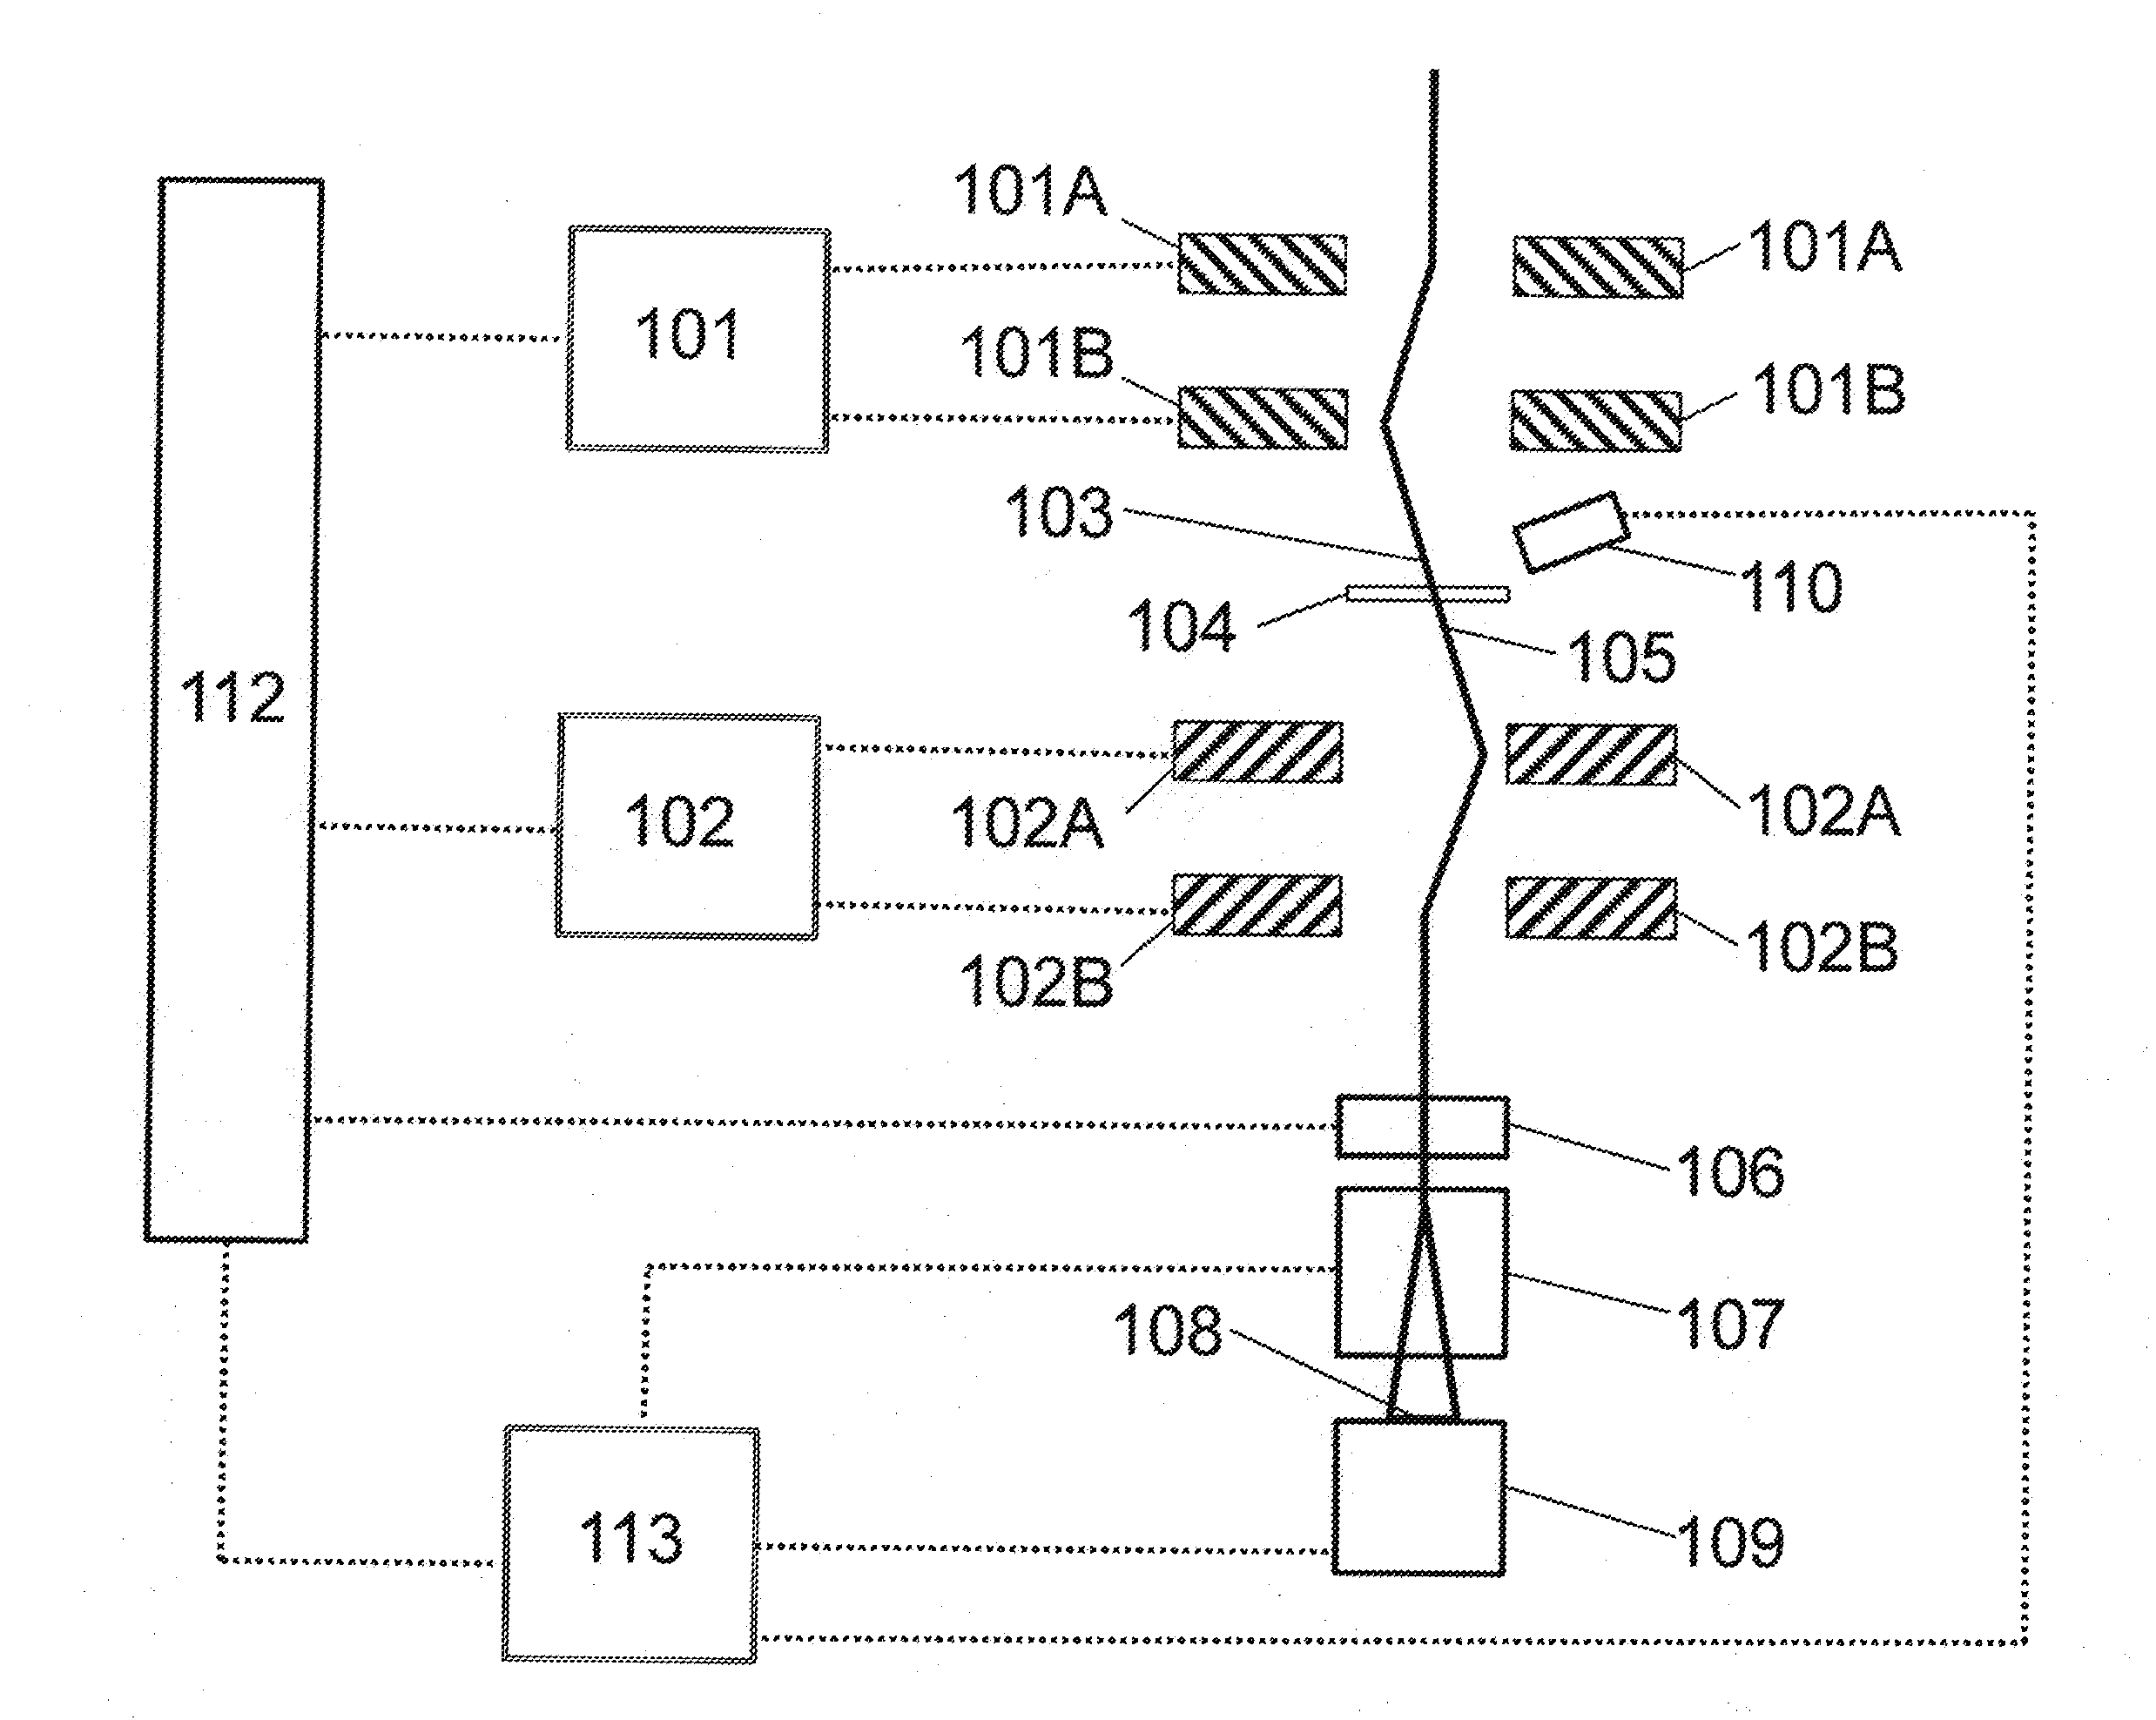
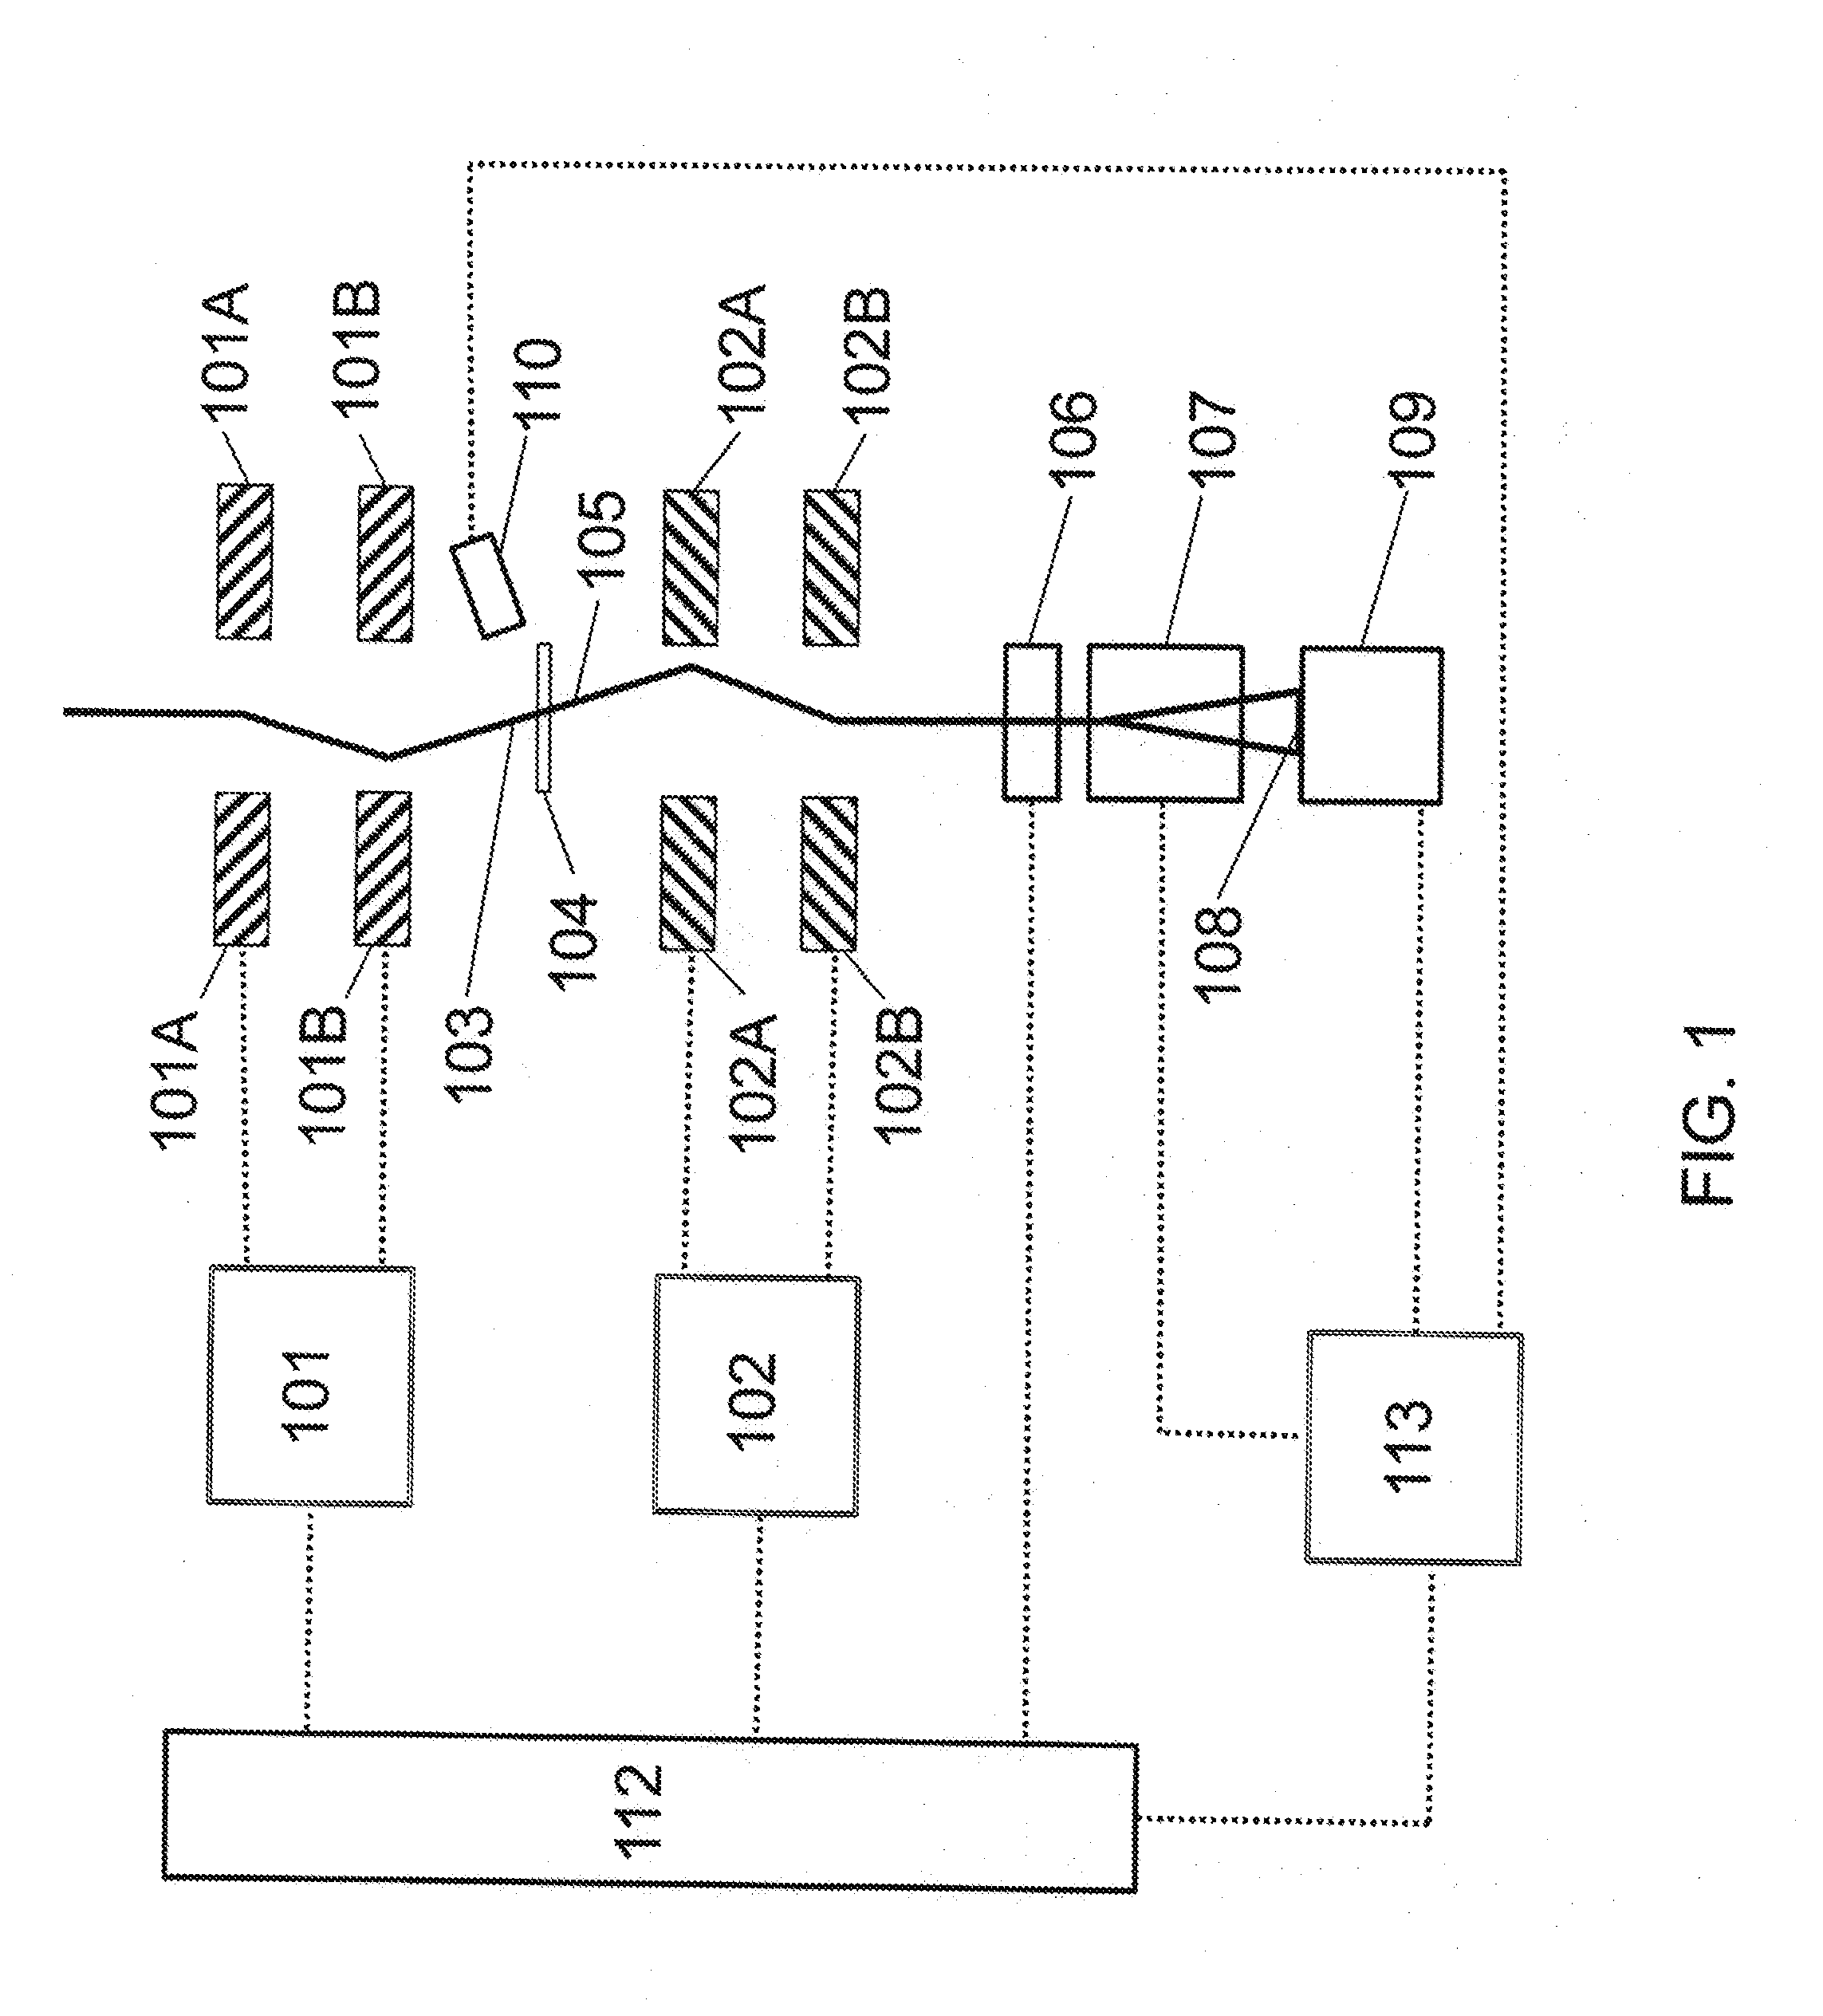
[0048]Proof of concept EELS experiments were conducted using a JEOL 2010 F TEM coupled to a Gatan Imaging Filter and a NanoMEGAS SpinningStar precession system (designed for and marketed for structural analysis of crystalline materials using PED). A 0.5 nm probe with a 9 mrad (approx. 0.5°) convergence and 10 mrad (approx. 0.6°) collection semi-angle was used in conjunction with precession angles between 0 and 1.92°. The precession frequency was set at 100 Hz and the microscope operating voltage at 200 keV.

[0049]A first proof of concept experiment was conducted using the Si L2,3 peak (edge) obtained from a single crystal Si sample oriented along the [011] zone axis. Spectra containing the Si L2,3 peak were acquired over 3 s periods at range of precession angles. FIG. 3A shows raw data, counts (C) expressed in arbitrary units (a.u.) plotted against energy loss (E.L.) expressed in eV, for the Si L2,3 spectral region acquired without precession and at a 0.48° precession angle. The ...

example 2

EDS

[0051]Proof of concept EDS experiments were conducted using a JEOL 2100 LaB6 TEM coupled to: a) an Oxford Inca EDS detector model 6498 with a take-off angle of 22 degrees, a detector area of 30 mm2 and an energy resolution of 136 eV at 5.9 KeV; and b) a NanoMEGAS DigiStar precession system model P1000. A 25 nm probe with a 2 mrad (0.12 degrees) convergence angle was used in conjunction with precession angles between 0 and 3 degrees. The precession frequency was set at 100 Hz and the microscope operating voltage was 200 keV.

[0052]A sample of single crystal silicon was aligned precisely along the [110] zone axis and the SiKα peak measured with precession inclination angles of 0, 1, 2 and 3 degrees. A maximum increase in signal strength of approximately 8% in the strength of the Si peak was observed.

[0053]FIG. 5 displays an overlay of the different SiKα peak signals acquired at different precession angles after background normalization. Data labeled 0 was acquired without precession...


PUM


Abstract

A method and system are disclosed for improving characteristic peak signals in electron energy loss spectroscopy (EELS) and energy dispersive x-ray spectroscopy (EDS) measurements of crystalline materials. A beam scanning protocol is applied which varies the inclination, azimuthal angle, or a combination thereof of the incident beam while spectroscopic data is acquired. The method and system may be applied to compositional mapping.

Description

RELATED APPLICATIONS[0001]This application claims priority benefit of EP Application 12160112.4 filed 19 Mar. 2012; the contents of which are hereby incorporated by reference.FIELD OF THE INVENTION[0002]The invention relates to the use in electron microscopy of electron energy loss and energy dispersive x-ray spectroscopy for determining the local chemical composition of materials. More specifically, it relates to quantitative measurements of characteristic peak signals obtained from samples containing crystalline regions and the generation of compositional maps from such samples.BACKGROUND[0003]Analytical electron microscopy is frequently used to investigate the chemical composition of materials down to sub-nanometer length scales. Electron energy loss spectroscopy (“EELS”) relies on measurements of the energy distribution of incident electrons transmitted through the microscope sample, while energy dispersive x-ray spectroscopy (“EDS”) relies on measurements of the energy distribu...

Claims


Application Information

Patent Timeline
IPC IPC(8): H01J49/44
CPCH01J49/44G01N2223/051G01N2223/402G01N23/2251H01J2237/1505H01J2237/1506H01J2237/1507H01J2237/2808H01J37/28
Inventor ALBIOL, SONIA ESTRADESERRA, JOAQUIN PORTILLOMARTINEZ, FRANCISCA PEIROCORSELLAS, JOSE MANUEL REBLEDCARDONA, LLUIS YEDRANICOLOPOULOS, STAVROSKIM, STEVENWEISS, JON KARL
Owner NANOMEGAS SPRL
Why Eureka
Try Eureka